

Summary - Track the metrics that drive SaaS growth. This guide covers 25 critical metrics—from ARR and CAC to NRR and churn—that help growing companies make faster, smarter decisions. Learn what each metric measures, why it matters, and how to use it to improve profitability and retention.
As SaaS companies scale, metrics become your compass. They translate strategy into action and reveal what's actually working. This guide covers 25 critical metrics that define SaaS success—from growth and profitability to customer retention and engagement.
Whether you're tracking revenue efficiency, customer behaviour, or market opportunity, these metrics help you make informed decisions faster. Let's explore the metrics that matter most.
25. ARR Growth Rate
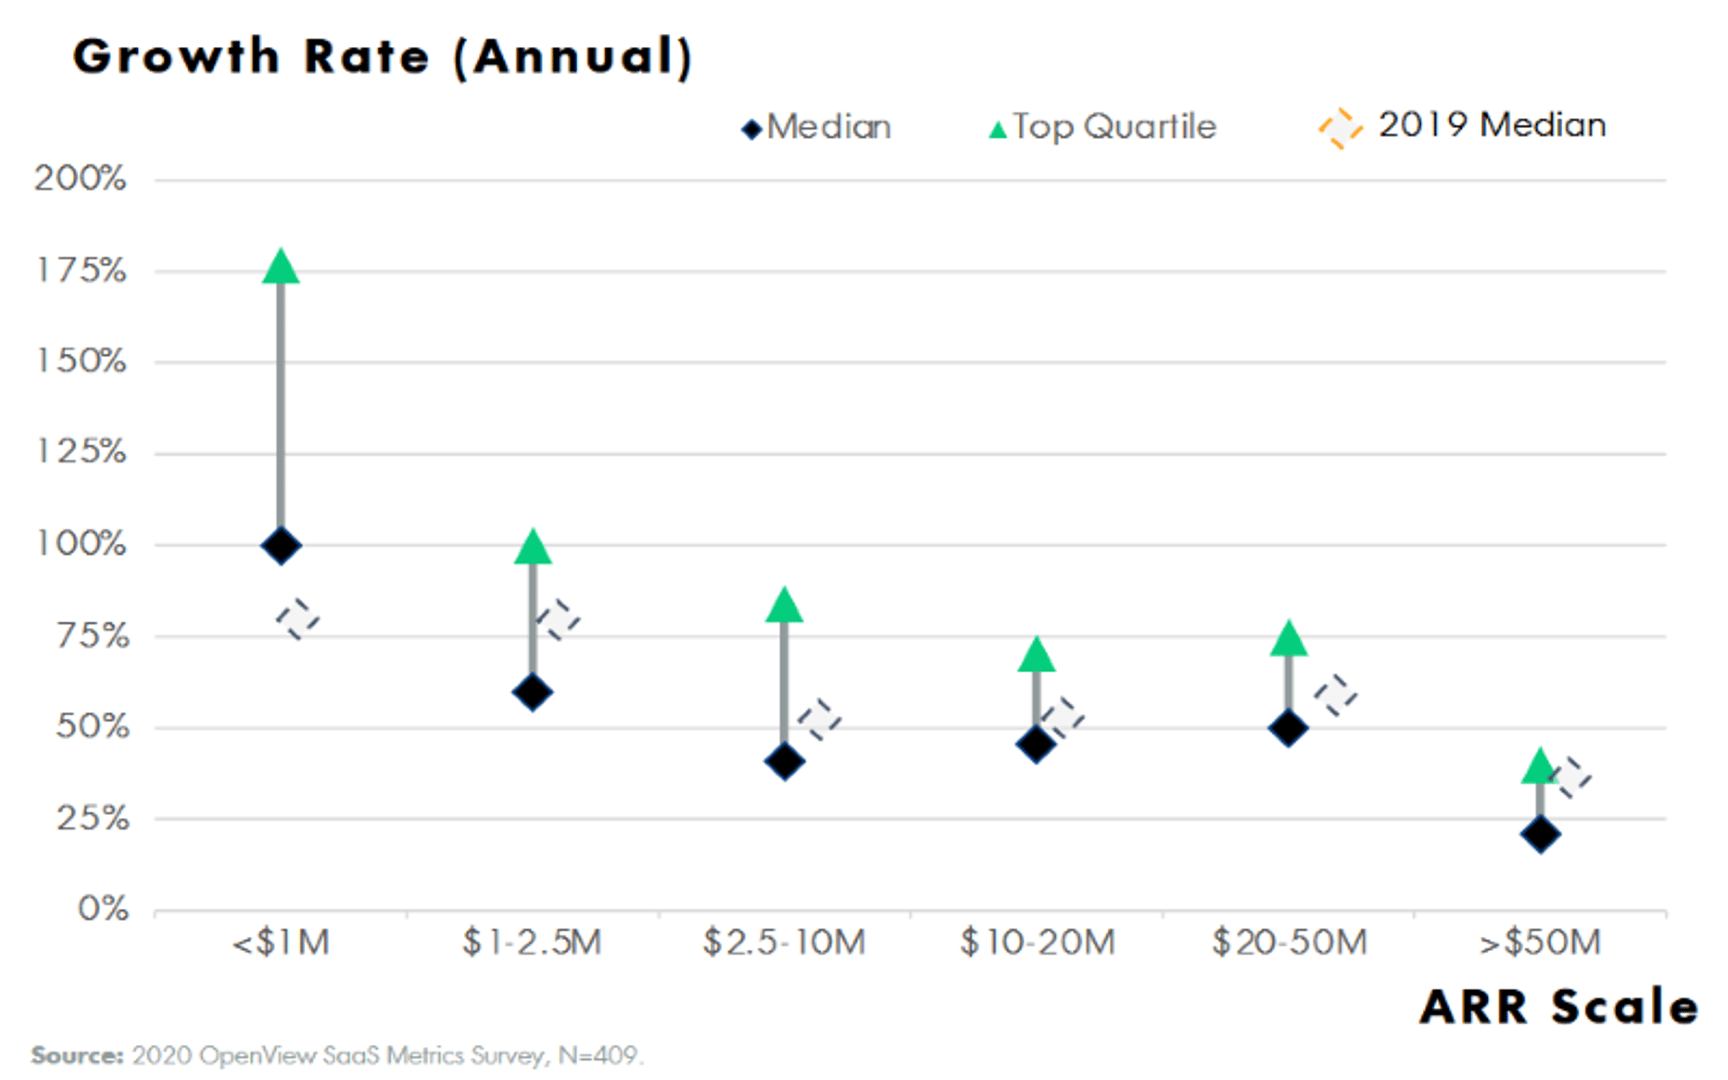
ARR Growth Rate measures how quickly your Annual Recurring Revenue grows year over year. It's a single number that tells you how fast you're expanding, whether your product resonates with customers, and how close you are to sustainable growth.
The metric reveals product-market fit health. Companies with strong ARR Growth Rates—typically 40% to 100% annually—demonstrate both customer demand and repeatable revenue. Public SaaS companies averaged 61% year-over-year ARR Growth Rate in the years leading up to IPO, making this a benchmark worth tracking.
24. Bessemer Efficiency Score
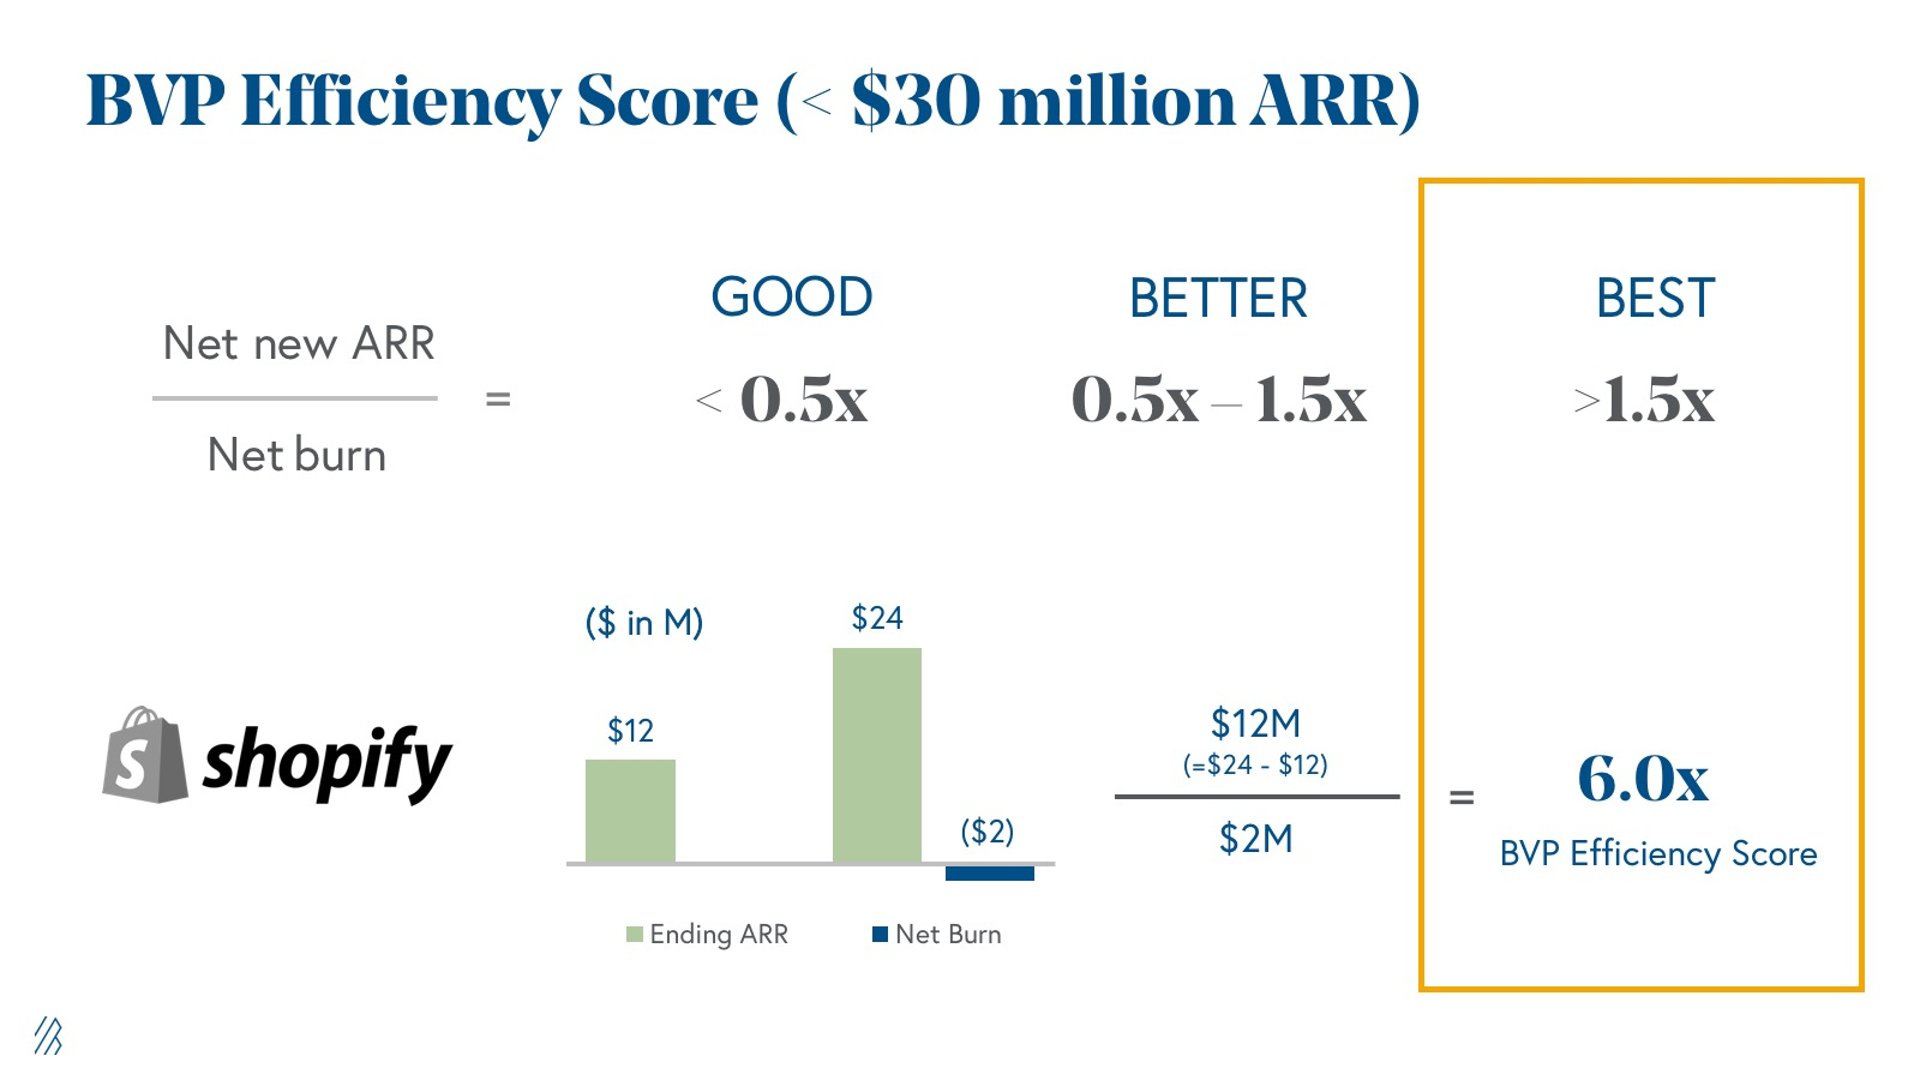
Bessemer Efficiency Score (BVP Efficiency Score) measures how much revenue you generate for every dollar burned. It's calculated as net new ARR divided by net burn—a ratio that separates efficient growth from wasteful spending.
A score of 1.0 means you burned one dollar to earn one dollar of incremental revenue. A score of 1.5 or higher indicates "best-in-class" efficiency and signals sustainable, resilient growth. This metric matters to investors because it proves you can scale without burning through cash indefinitely.
23. Hype Factor
Hype Factor is the ratio of raised capital to ARR. It answers a hard question: Are you converting investor money into real revenue, or just generating buzz?
Coined by investor and enterprise software expert Dave Kellogg, Hype Factor reveals whether your capital is producing returns or simply inflating valuation. An optimal Hype Factor sits between 1 and 2—meaning for every dollar raised, you've converted it into one to two dollars of ARR. High Hype Factors suggest capital inefficiency and signal that growth may not be sustainable without additional funding.

22. Net Promoter Score (NPS)
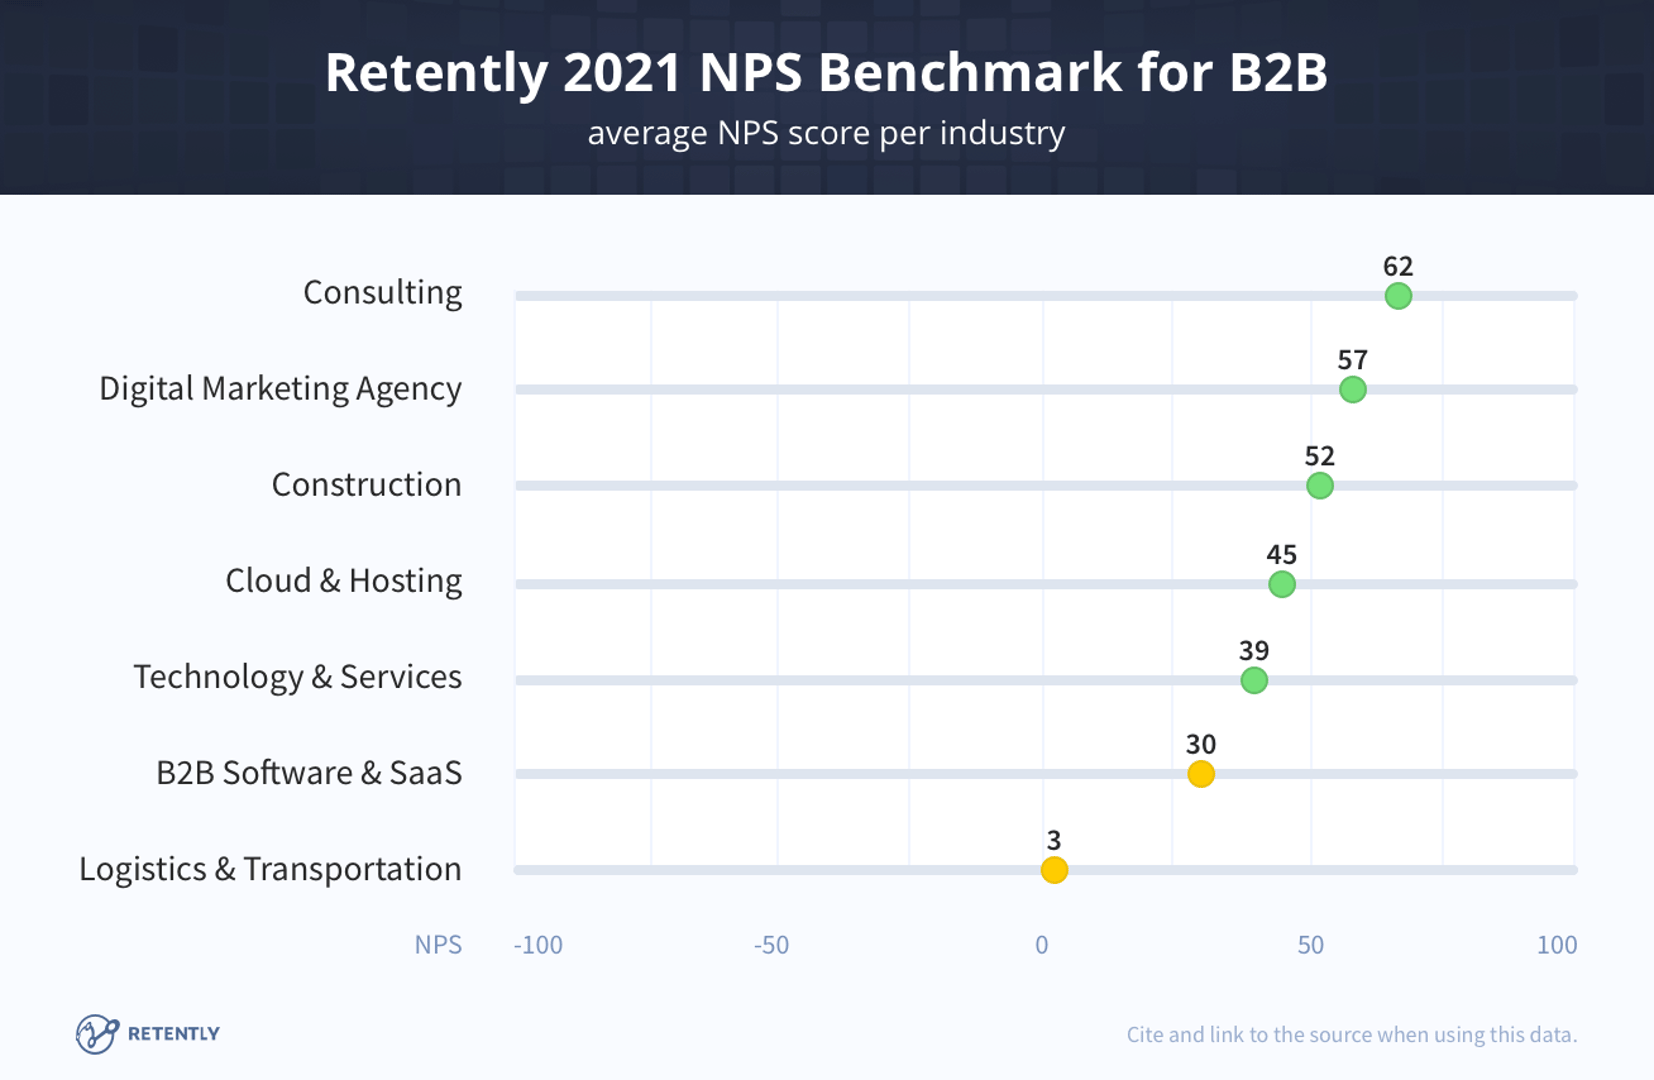
Net Promoter Score (NPS) segments customers into three groups: Promoters (loyal advocates), Passives (satisfied but indifferent), and Detractors (unhappy customers likely to leave). The score ranges from -100 to +100.
NPS reveals customer sentiment at scale. Rather than collecting individual testimonials, NPS gives you a quantifiable measure of loyalty and word-of-mouth potential. Passives represent your biggest opportunity—they're on the fence and small improvements can convert them into promoters.
21. Customer Acquisition Cost
Customer Acquisition Cost (CAC) is the total sales and marketing spend required to acquire one new customer. It's a startup survival metric because rising CAC directly threatens profitability.
CAC has increased significantly over the past decade, making efficient acquisition harder. The challenge compounds when you factor in churn—if customers leave before you recover your acquisition investment, you lose money on every sale. Understanding your CAC relative to customer lifetime value is essential.
20. LTV/CAC Ratio
LTV/CAC Ratio compares Customer Lifetime Value (the total profit from a customer) against Customer Acquisition Cost. It's the magic ratio that determines whether your unit economics work.
A 3:1 ratio is the gold standard—you want to earn three dollars in lifetime value for every dollar spent acquiring a customer. Ratios below 3:1 signal unsustainable growth. Ratios above 5:1 indicate you're underinvesting in acquisition and missing growth opportunities.
19. CAC Payback Period
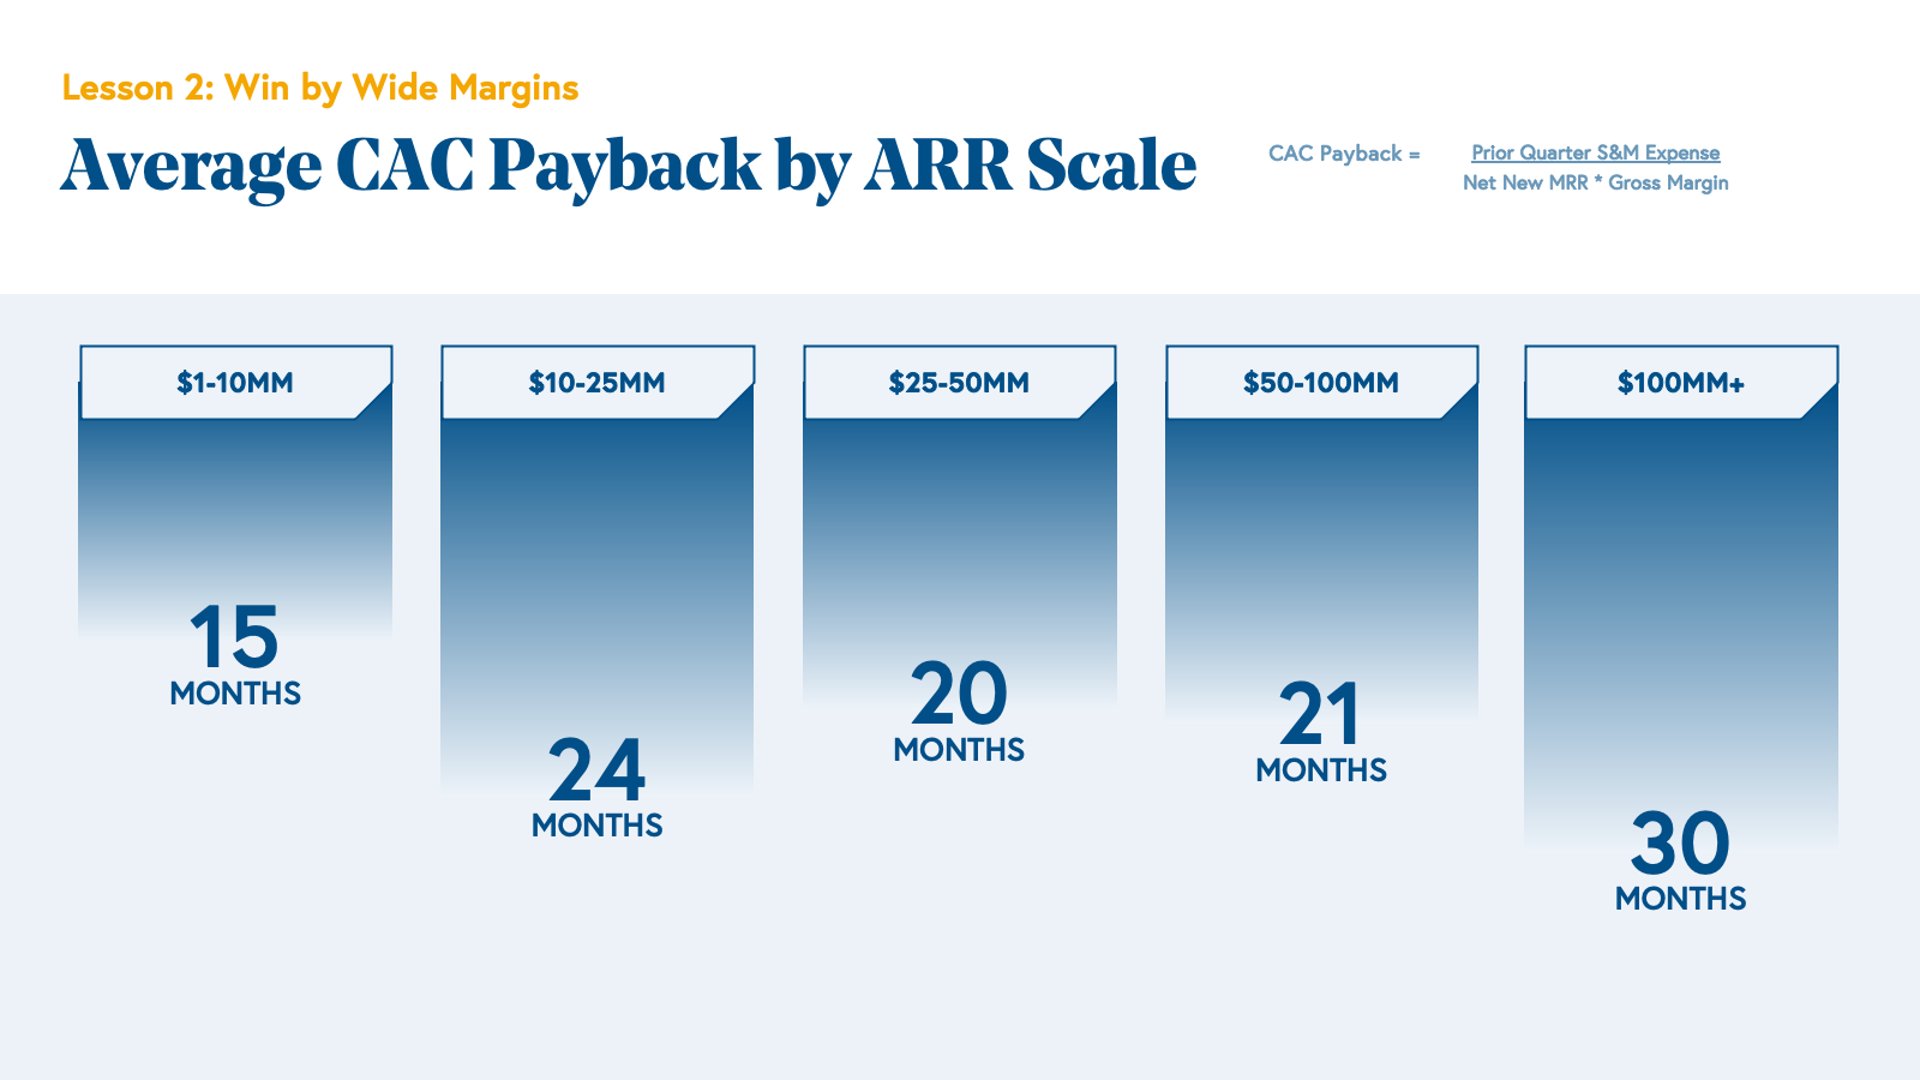
CAC Payback Period measures how many months it takes to recover your customer acquisition investment. It puts CAC into perspective by adding the dimension of time.
Bessemer Venture Partners identifies CAC Payback Period as their primary metric for evaluating sales and marketing efficiency. A healthy benchmark ranges from 8 to 12 months, though this varies by customer size and ARR scale. Longer payback periods delay cash flow and increase financial risk.
18. Burn Multiple
Burn Multiple is the ratio of net burn to net new ARR. It measures how much cash you're spending to generate each dollar of new recurring revenue.
A burn multiple under 1.0 is ideal—you're generating more revenue than you're burning. Early-stage startups often see multiples between 1.0 and 2.0, which is acceptable if you're in a high-growth phase. Multiples above 2.0 signal that expenses are outpacing revenue growth and warrant immediate attention.
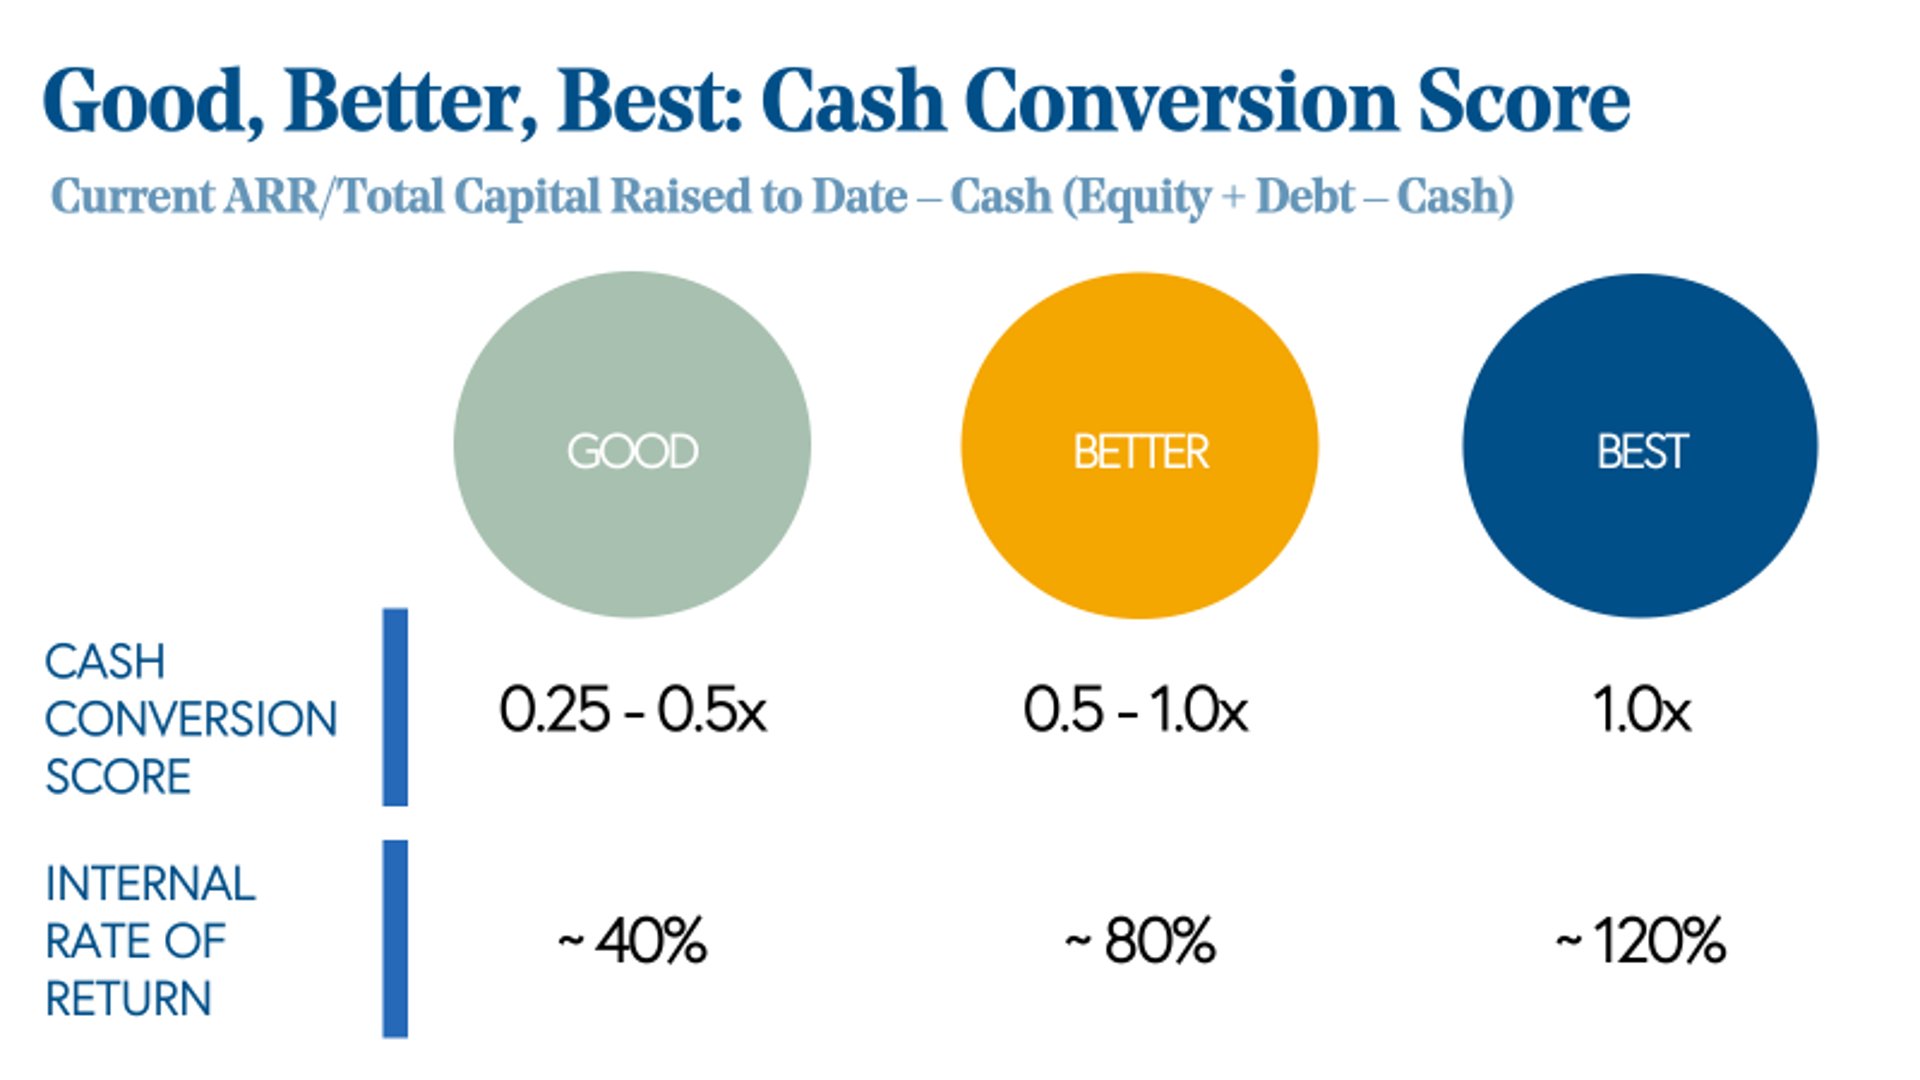
17. Cash Conversion Score
Cash Conversion Score (CCS) measures the ratio between ARR and invested capital. It's the inverse of Hype Factor and shows how efficiently you convert investor dollars into recurring revenue.
Investors use CCS to assess whether you're positioned for sustainable growth. Higher CCS scores correlate with higher IRR (internal rate of return), making this metric critical for fundraising. A strong CCS demonstrates that you can scale profitably with additional capital.
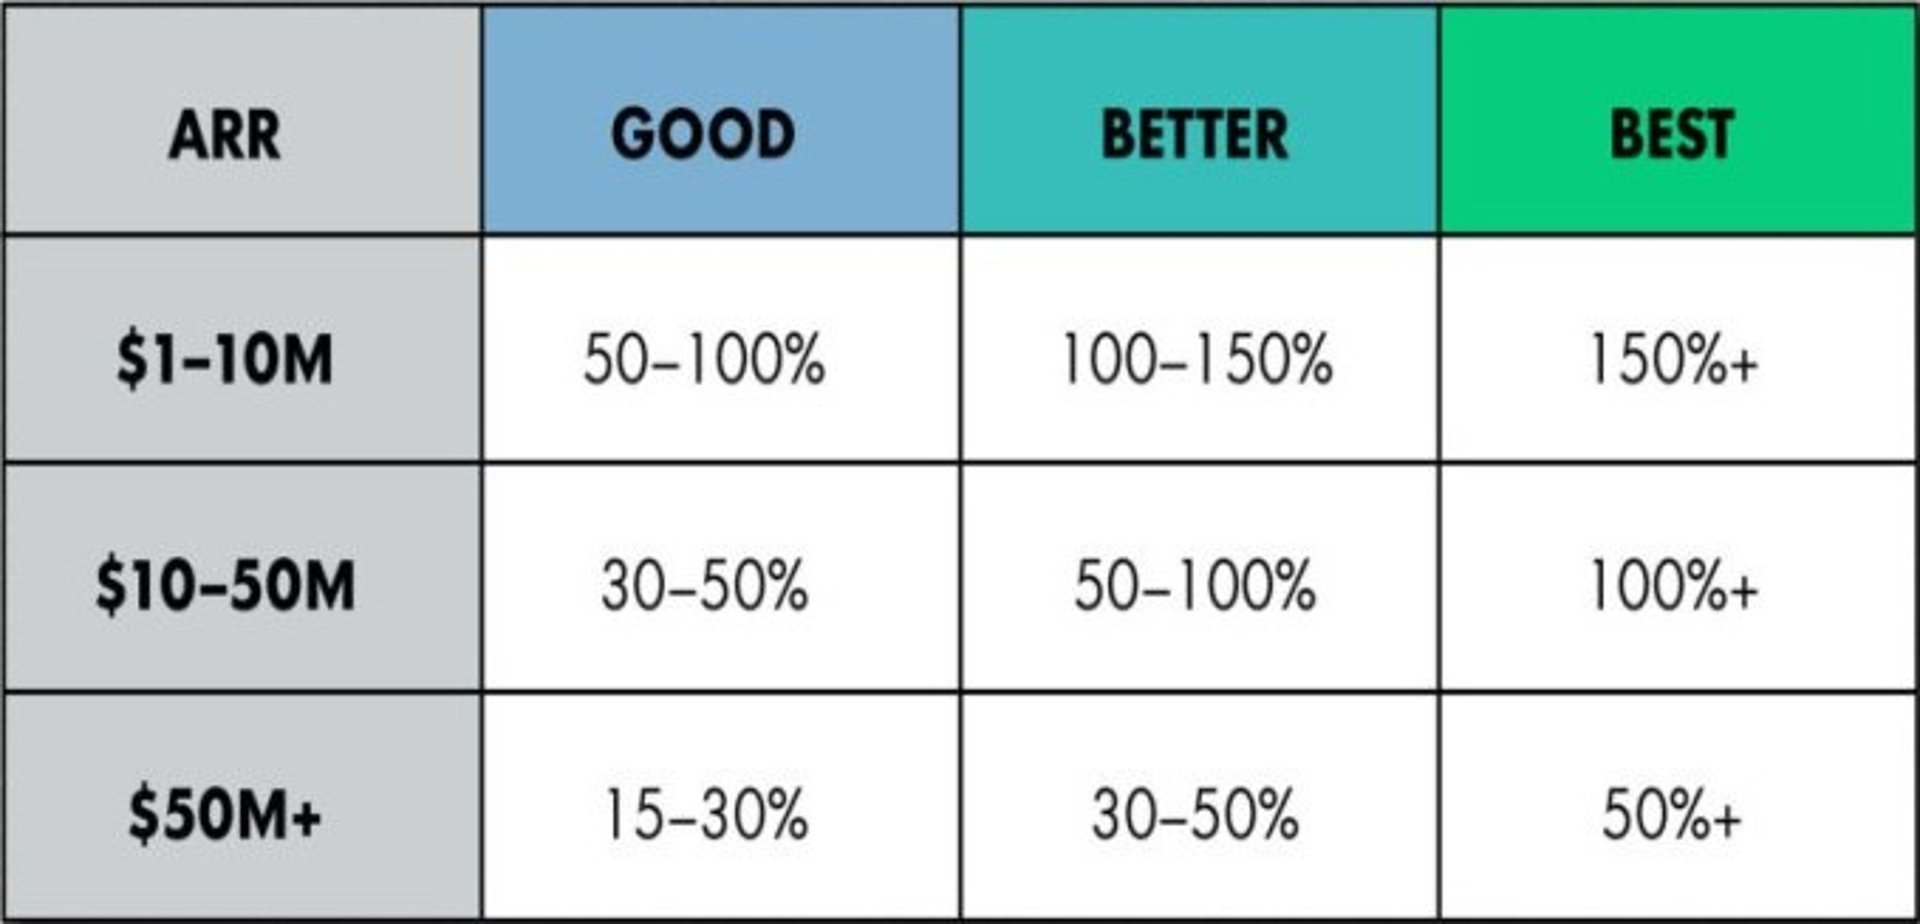
16. Net Revenue Retention Rate
Net Revenue Retention Rate (NRR) measures revenue from existing customers, including expansion revenue, minus churn and downgrades. It reveals whether your customer base is growing or shrinking.
An NRR of 100% means you're retaining all revenue from existing customers. Above 100% indicates expansion revenue exceeds churn—the ideal scenario. Benchmark studies show strong SaaS companies achieve NRR between 110% and 130%, proving that expansion revenue can offset acquisition costs and drive profitability.
15. DAU/MAU Ratio
DAU/MAU Ratio compares Daily Active Users (DAU) to Monthly Active Users (MAU). It measures engagement stickiness—how consistently users return to your product.
A higher ratio indicates stronger daily engagement. For example, a 0.5 ratio means half your monthly users return daily. This metric works best for consumer and product-led SaaS companies where daily usage drives value. Use it cautiously for enterprise tools where weekly or monthly usage may be appropriate.
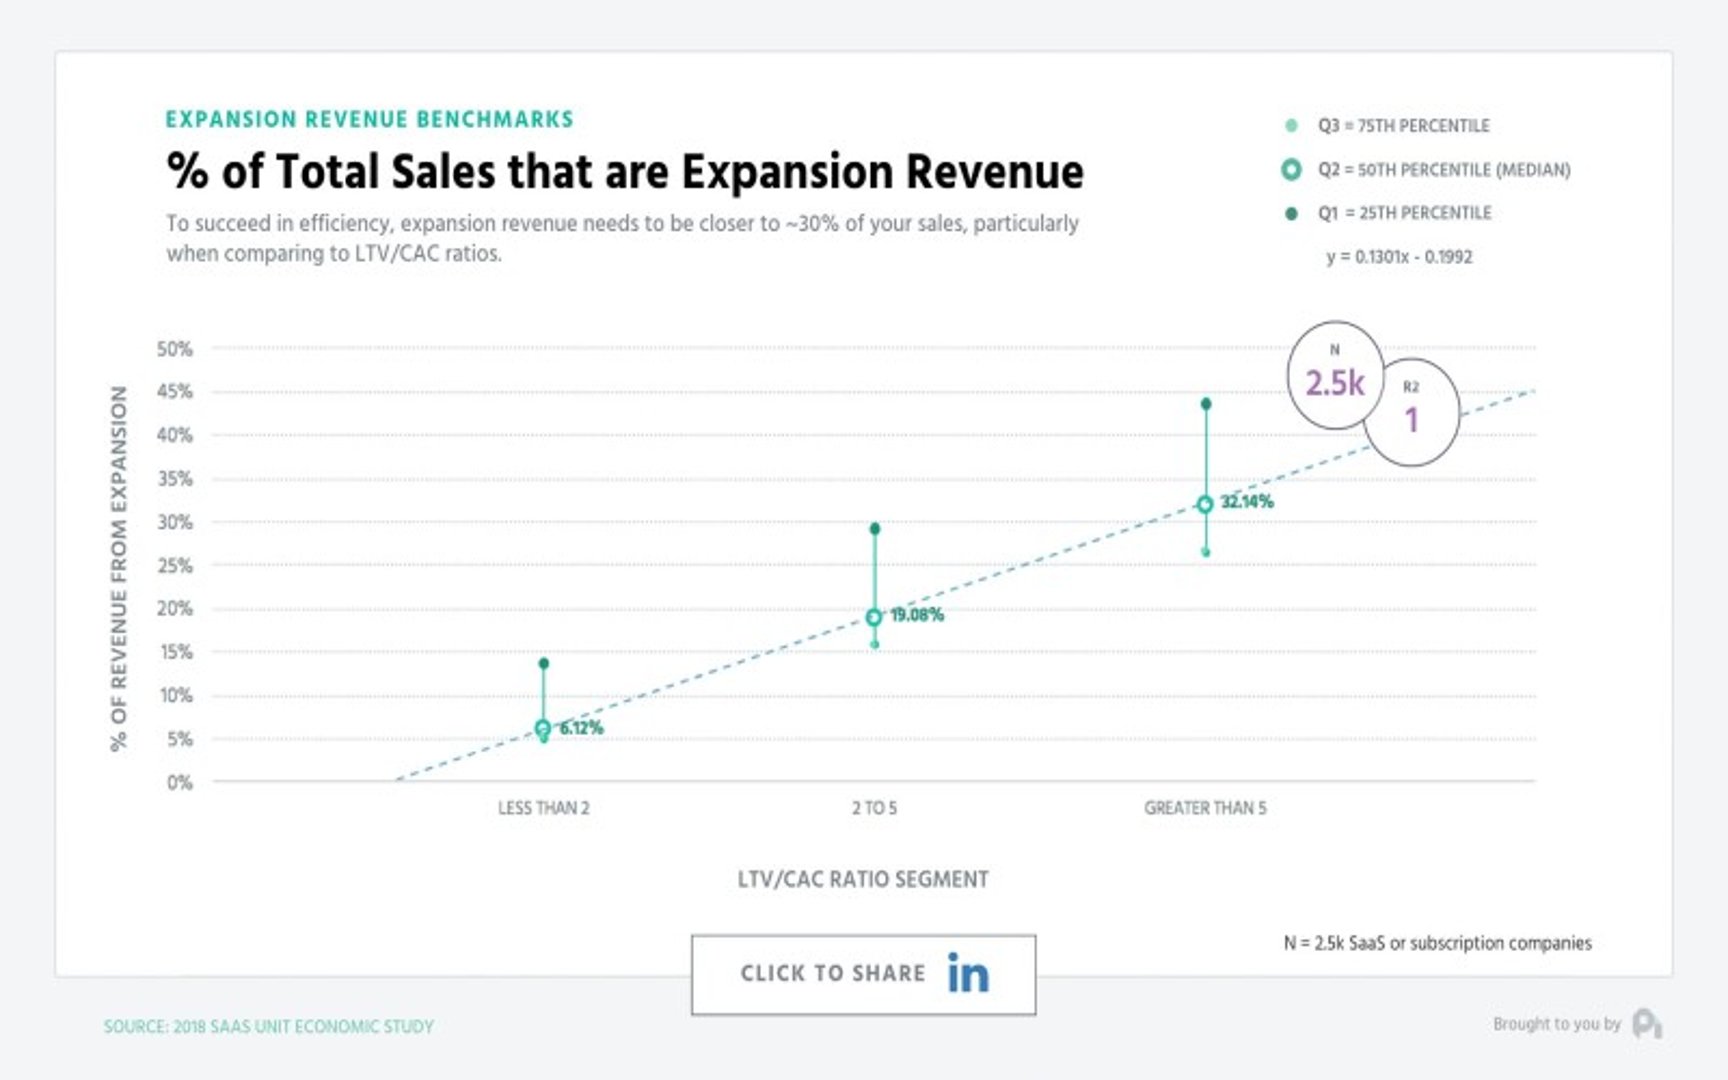
14. Expansion Revenue
Expansion revenue comes from existing customers—upsells, cross-sells, and increased usage. Two metrics capture its importance:
Expansion Revenue as a Percentage of New Revenue shows what portion of your new revenue comes from existing customers rather than new acquisition. Since expansion revenue avoids high CAC costs, it's weighted more heavily toward profit.
Expansion MRR Growth Rate measures the percentage of total monthly recurring revenue from expansion. Track this over time to validate whether your expansion strategy is working and watch your average customer lifetime value grow alongside it.
13. Natural Rate of Growth
Natural Rate of Growth measures organic growth through social channels, referrals, and product virality—without direct sales involvement. It emerged as a key metric alongside product-led growth trends.
This metric captures conversions from free trials, freemium adoption, and word-of-mouth. An ideal natural growth rate falls between 50% and 150% of your total ARR growth. Higher percentages indicate strong product-market fit and reduce your dependence on expensive sales and marketing.
12. Burn Rate
Burn Rate is the amount of cash you spend monthly on operating expenses that don't generate profit. It's calculated by subtracting gross profit from total operating expenses.
Burn Rate reveals operating efficiency. By focusing on gross profit rather than total revenue, you measure only the costs directly tied to your business. Early-stage startups with high R&D costs often have higher acceptable burn rates. As you scale, burn rate should decline relative to revenue growth.
11. Logo Churn
Logo Churn is the percentage of customers who cancel in a given period. It's distinct from revenue churn because it counts customer count, not dollars.
Benchmark studies show growing companies experience 3% to 7% monthly logo churn, while larger enterprises see 1% to 2%. Logo churn is a leading indicator of product-market fit problems. High churn signals that customers aren't finding sufficient value, making retention improvements critical before scaling acquisition.
10. Trial Conversion Rate
Trial Conversion Rate measures the percentage of free trial users who convert to paid customers. It's a powerful metric because trial users have already experienced your product.
A high trial conversion rate proves your product delivers immediate value. Industry benchmarks show average trial conversion rates around 0.4% when retention is included as a success criterion. This metric is especially important for freemium and free trial models where product experience drives purchasing decisions.
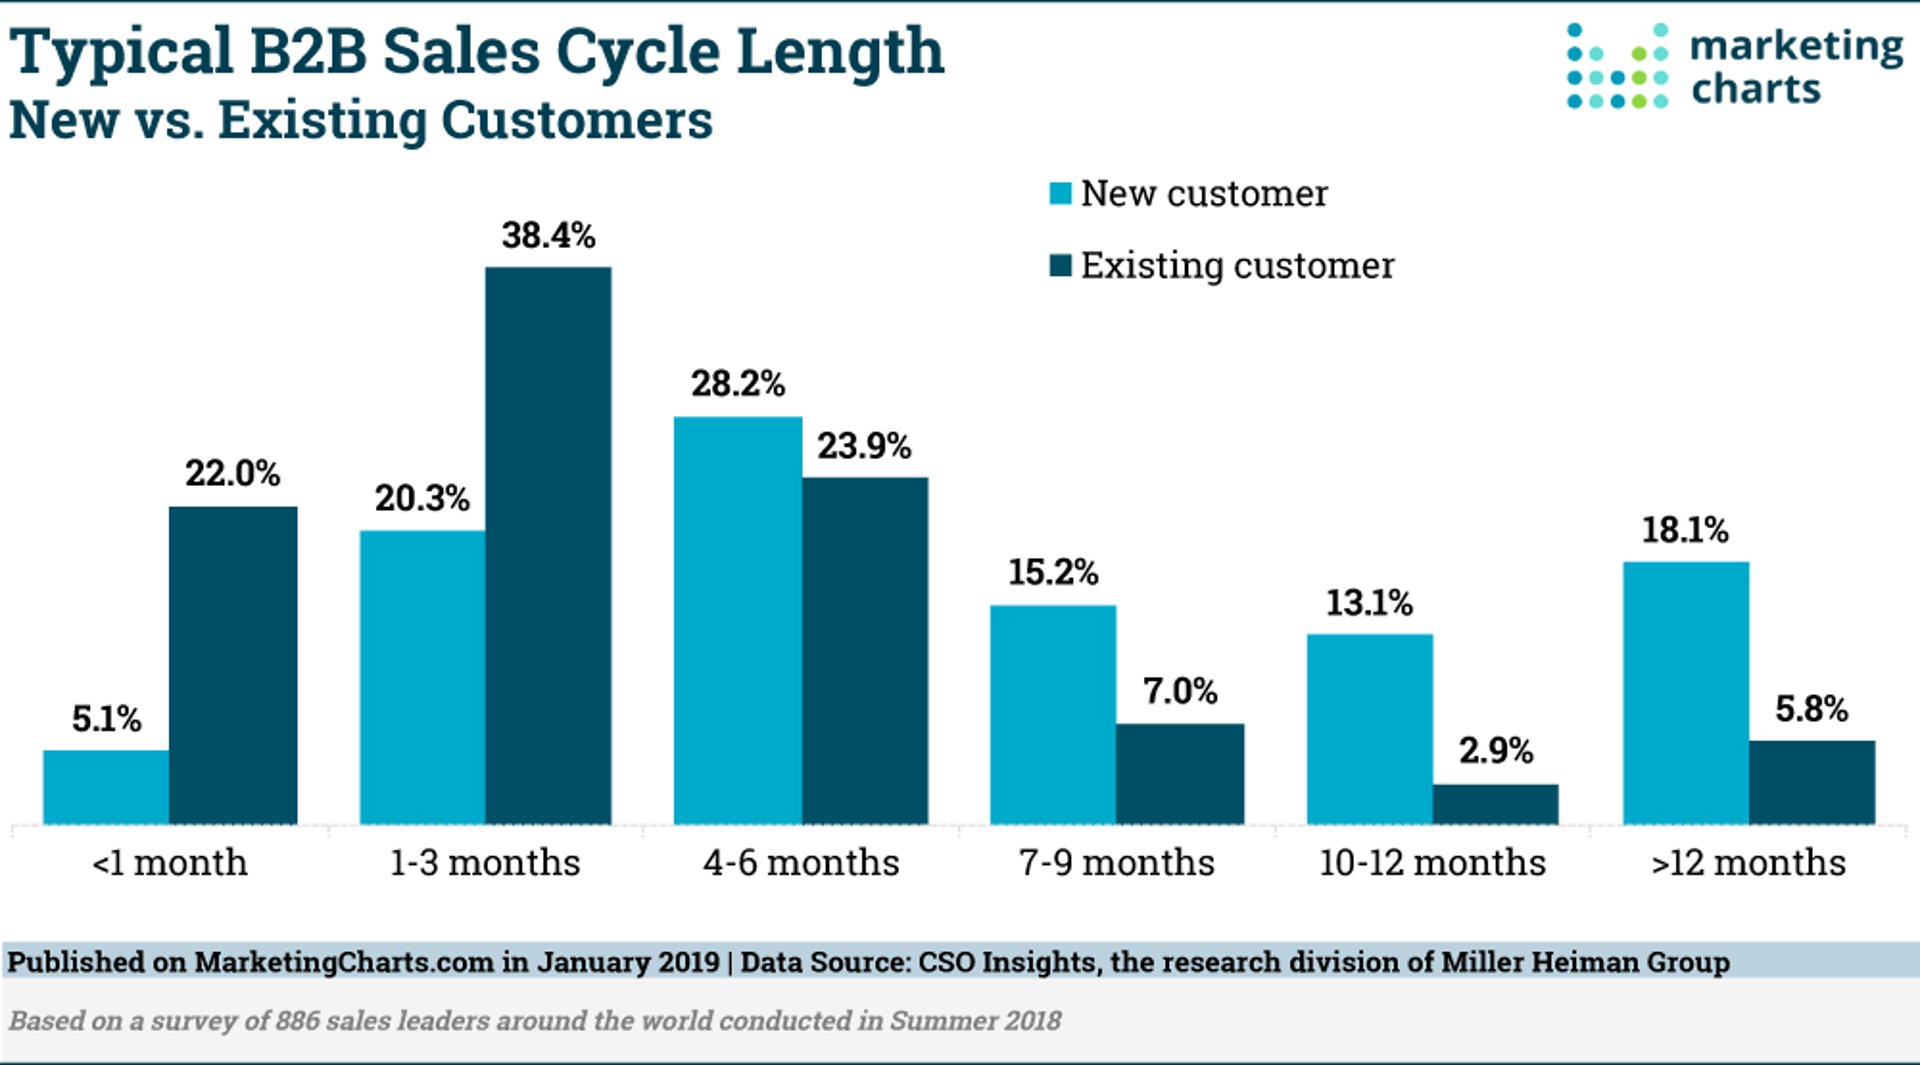
9. Sales Cycle Length
Sales Cycle Length measures the average time from initial contact to closed deal. It's critical for companies with direct sales models.
Shorter sales cycles improve cash flow and allow faster scaling. Typical enterprise sales cycles range from 3 to 6 months, while mid-market deals average 1 to 3 months. If your sales cycle is longer than industry benchmarks, investigate bottlenecks in your sales process and look for ways to accelerate deal progression.
8. Total Addressable Market (TAM)
Total Addressable Market (TAM) is the total revenue opportunity available in your market. It's a massive number that shows the ceiling for your business potential.
TAM alone is too broad. Narrow it further with Serviceable Addressable Market (SAM)—the portion you can realistically reach—and Serviceable Obtainable Market (SOM)—your realistic market share in the near term. Understanding all three helps you set credible growth targets and demonstrates market validation to investors.
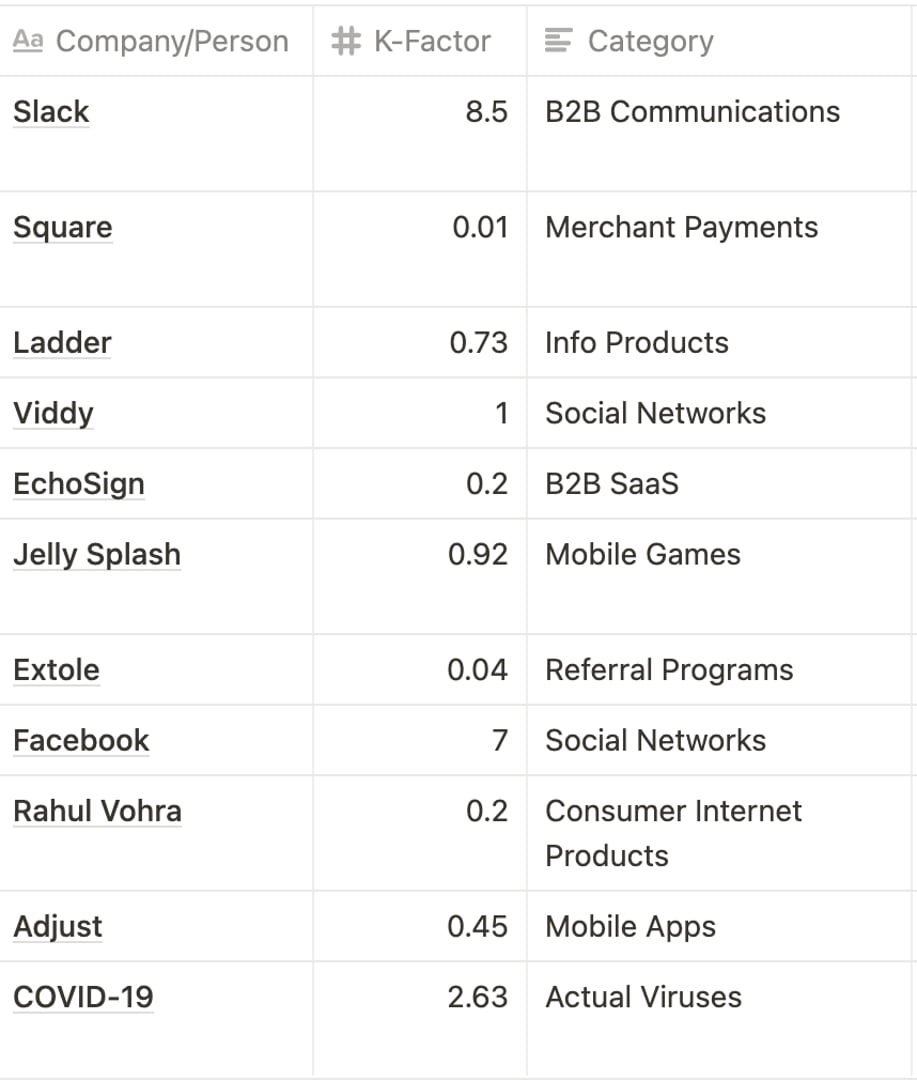
7. Viral Coefficient
Viral Coefficient measures how many new customers each existing customer brings through referrals. It's calculated as referral rate multiplied by conversion rate of those referrals.
A viral coefficient above 1.0 means each customer brings more than one new customer, creating exponential growth. A coefficient of 1.5 indicates strong virality. This metric matters most for consumer and product-led SaaS companies where word-of-mouth drives acquisition.
6. Annual Contract Value (ACV)
Annual Contract Value (ACV) is the average revenue per customer per year. It's calculated by dividing total annual contract revenue by the number of customers.
ACV shapes your entire business model. A high-value ACV supports a direct sales model with longer sales cycles. A low-value ACV requires product-led or self-serve models to scale efficiently. The ideal scenario combines high ACV with high customer count, avoiding customer concentration risk.
5. Customer Concentration
Customer Concentration is the percentage of total revenue from your largest customers. High concentration creates risk—if one major customer leaves, your revenue drops significantly.
Safe concentration benchmarks range from 1% to 10%, depending on your customer base. If you serve primarily growing companies with low deal values, aim for 1% or less. If you serve enterprise customers with high ACV, 5% to 10% may be acceptable. Diversifying your customer base reduces churn risk and improves valuation multiples.
4. Sign-Up Rate
Sign-Up Rate measures the percentage of website visitors who sign up for a trial, demo, or freemium access. It's a leading indicator of website quality and product interest.
A high sign-up rate proves you're attracting qualified traffic and your value proposition resonates. Optimize your website for sign-ups by improving page speed, simplifying navigation, and highlighting core benefits. Even small improvements in sign-up rate compound into significant revenue gains over time.
3. Lead Conversion Rate
Lead Conversion Rate measures the percentage of website visitors captured as leads through forms, email signups, or contact requests. It's your top-of-funnel conversion metric.
Lead conversion feeds your sales pipeline. Improve this metric by creating high-value content, reducing form friction, and personalising your messaging. A strong lead conversion rate ensures you have enough pipeline to hit revenue targets, even if downstream conversion rates fluctuate.
2. Time to Value
Time to Value measures how long customers wait before experiencing tangible value from your product. It's a critical onboarding metric that directly impacts retention.
Reduce time to value by simplifying initial setup, providing guided tours, and offering proactive support. Customers who experience value quickly are more likely to renew, expand, and refer. Tracking time to value alongside churn reveals whether onboarding improvements drive retention gains.
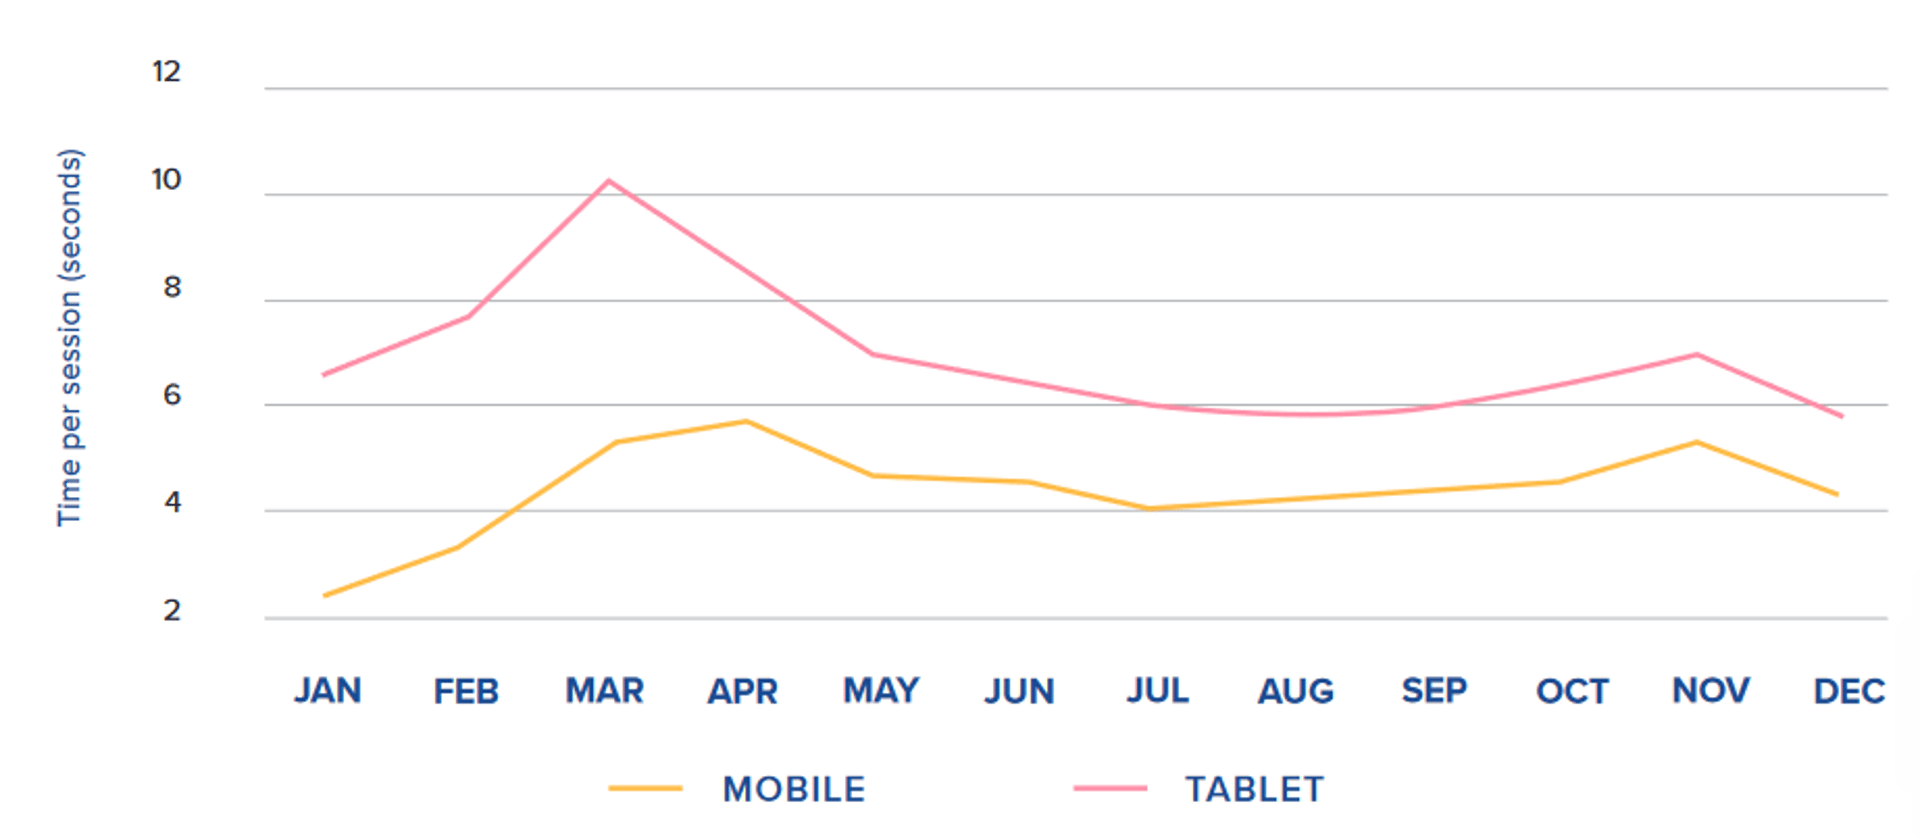
1. Average Session Duration
Average Session Duration measures the average time visitors spend on your website per session. It indicates content relevance and user engagement.
Longer sessions typically indicate higher engagement, though context matters. A 5-minute session on a blog post suggests strong content value. A 2-minute session on your pricing page may indicate confusion. Analyse session duration by page and user segment to identify where engagement is strongest and where improvements are needed.
Track metrics that matter
These 25 metrics cover the full SaaS lifecycle—from acquisition and retention to profitability and growth. You don't need to track all of them simultaneously. Start with metrics aligned to your current stage and business model, then add others as you scale.
The most successful growing companies treat metrics as a communication tool. Share key metrics across teams, align everyone on targets, and review progress regularly. When your entire organisation understands what matters and why, you move faster together. Use dashboard software to centralise your metrics, automate data retrieval, and distribute insights across your team—eliminating spreadsheets and ensuring everyone sees the same truth.
Related Articles

5 tips to understand (and organize) your restaurant data
By Saleem Khatri — June 9th, 2026
6 dashboards I use daily to run my SaaS company
By Allan Wille, Co-Founder — April 10th, 2026
Business Metrics vs. KPIs: What’s the Difference?
By Jonathan Taylor — March 13th, 2026
