

Five Google Ads metrics to measure PPC advertising performance
Track impressions, clicks, cost per click, click-through rate, and conversions to measure your PPC campaign performance. This guide explains what each Google Ads metric tells you, how to use it to make smarter budget decisions, and how to monitor all five in one Klips dashboard.
Digital advertising works, but only when you know which numbers to trust.
The goal is consistent across every campaign: get your ad in front of the right people, earn the click, and turn that click into a customer, all at a cost that makes sense. Google Ads is a pay-per-click (PPC) platform where you control budget allocation by campaign type. But without the right metrics, you can't tell whether your spending is working or just disappearing.
This guide covers the five Google Ads metrics every marketer should track to measure PPC campaign performance, and how to monitor them all in one place using a Klips dashboard.
Top 5 Google Ads metrics to measure your performance
Track these metrics regardless of your bidding strategy. Your focus may shift based on campaign goals, but watching all five gives you a complete picture of what's working, what's wasting budget, and what to do next.
1. Ad impressions
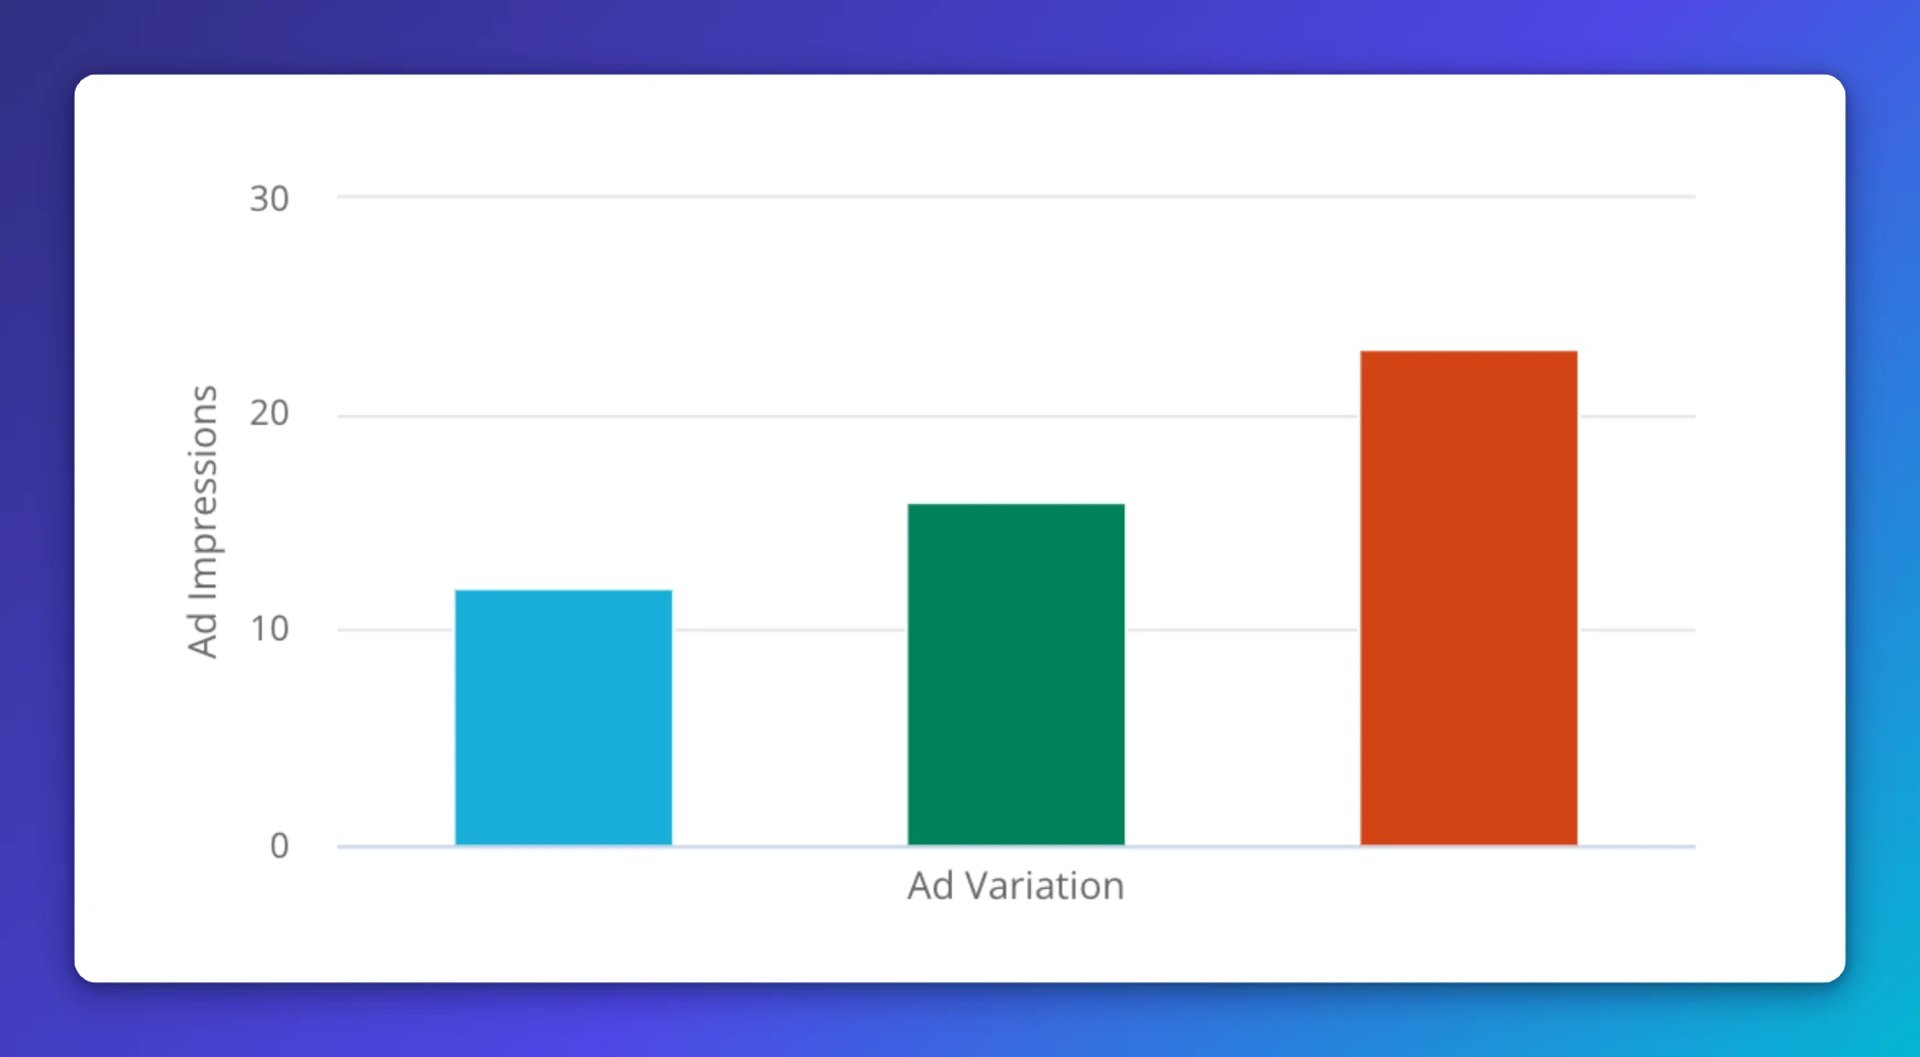
Ad impressions are the total number of times your ad appears on screen. Getting in front of the right audience is the first step in any digital advertising campaign, and impressions confirm that's happening.
Track impressions for two reasons. First, you can segment by campaign group to identify which message or creative resonates best. Second, higher impressions correlate with higher click likelihood. If you're running a Search Ads strategy tied to brand awareness or visibility, impressions become your primary success metric. Learn more about ad impressions.
2. Ad clicks
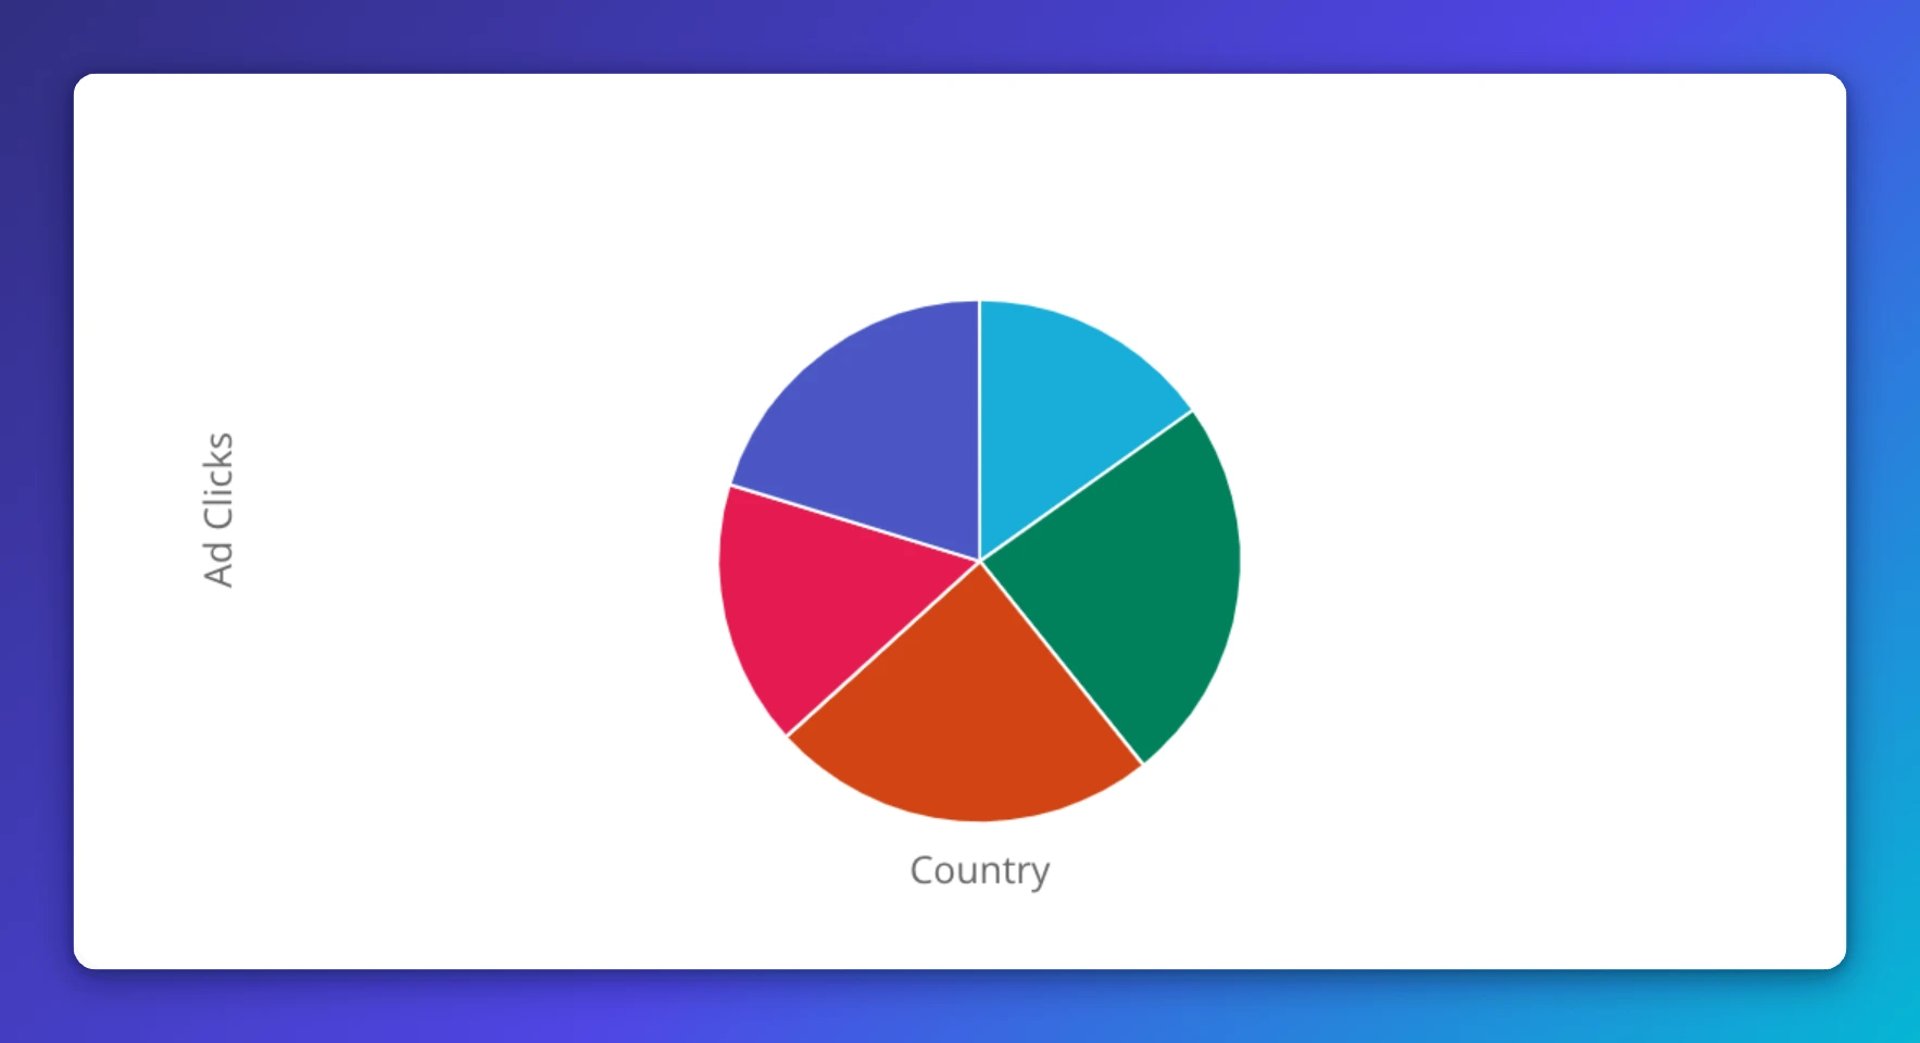
Clicks measure how many users engage with your ad by clicking through to your website or landing page. If your campaign goal is driving traffic, clicks are the right bidding strategy and a critical number to watch across search and display networks.
Like impressions, clicks segment by campaign group, so you can quickly spot top performers and identify ads that need attention. Higher clicks typically lead to more conversions. Explore ad click metrics to understand which ads drive the most engagement.
3. Cost per click
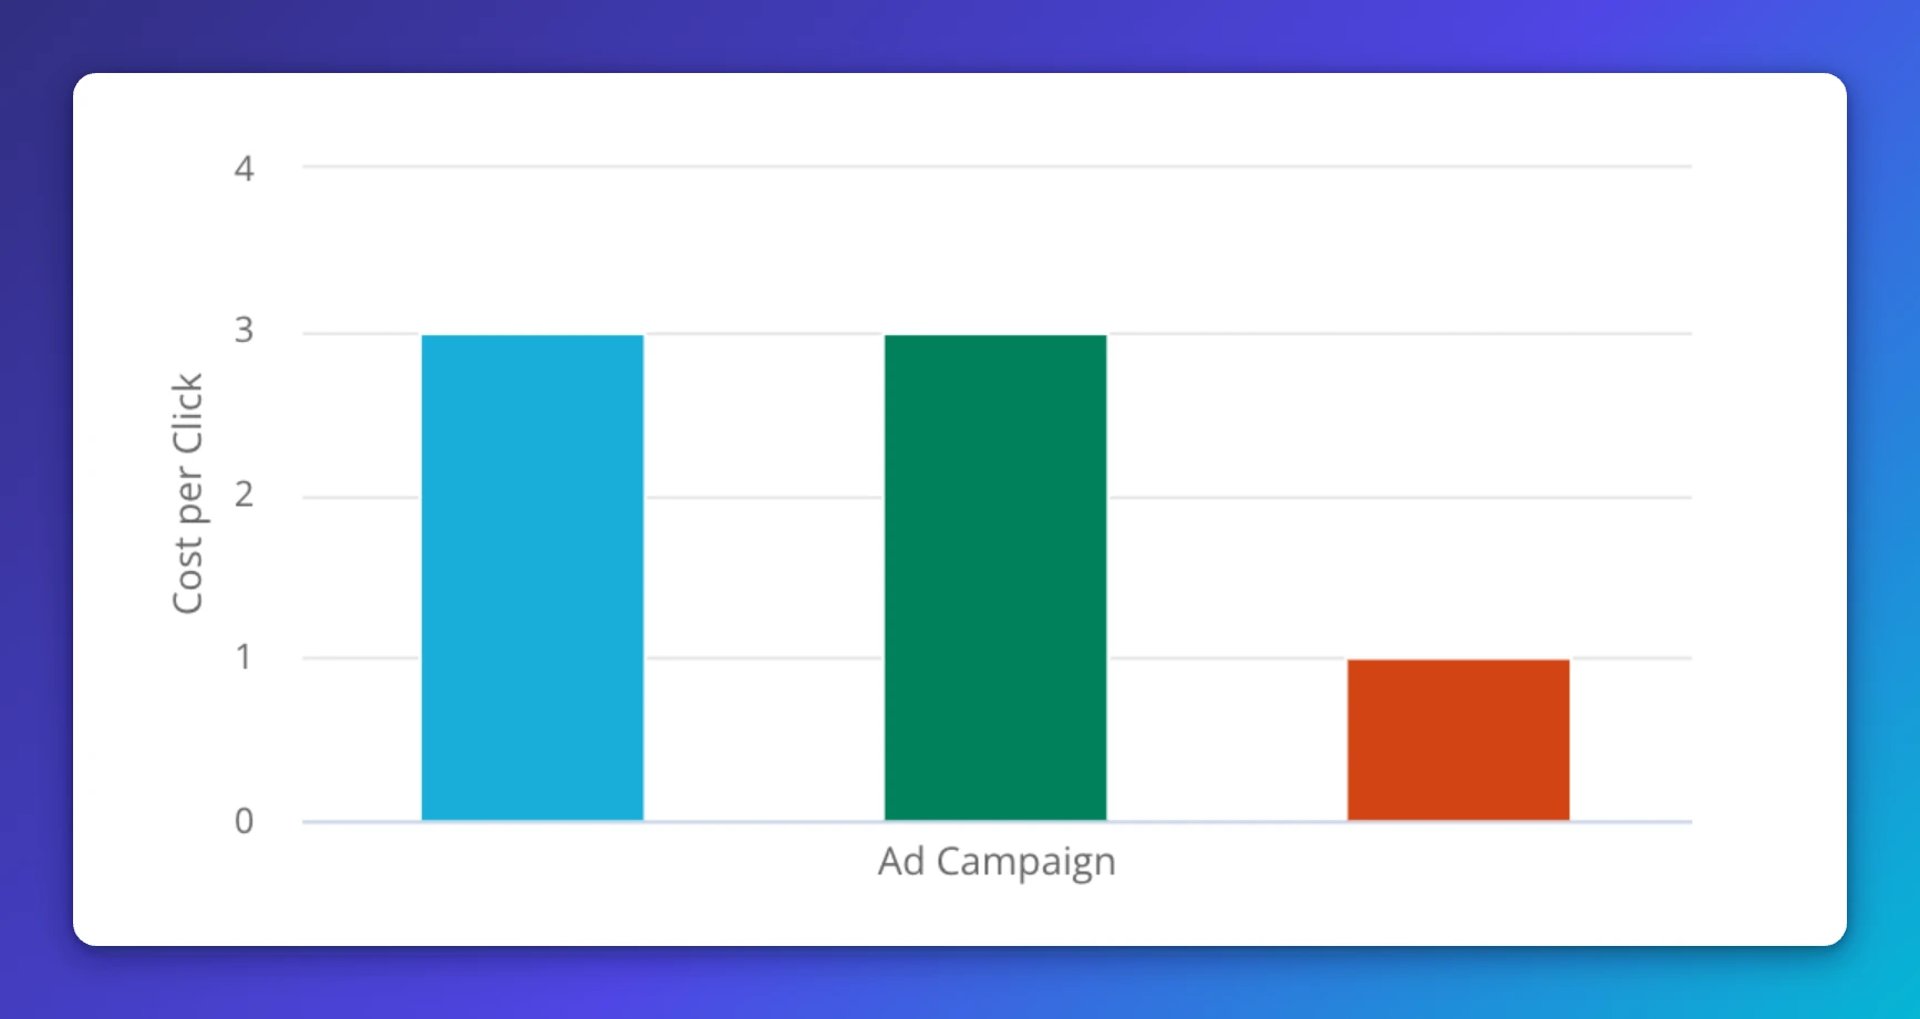
Cost per click (CPC) is the amount you pay each time someone clicks your ad. Your budget depends on it, so monitoring CPC is non-negotiable.
Google Ads operates on a bidding system where CPC varies by industry and keyword competitiveness. WordStream's benchmarks show that CPC fluctuates significantly across sectors. If you're using the display network with an impressions goal, your cost is measured as cost per thousand impressions (CPM) rather than per click. Knowing your CPC tells you whether you're paying a fair price for attention, and where you can reallocate to get more from the same budget. Review cost-per-click benchmarks.
4. Click-through rate (CTR)
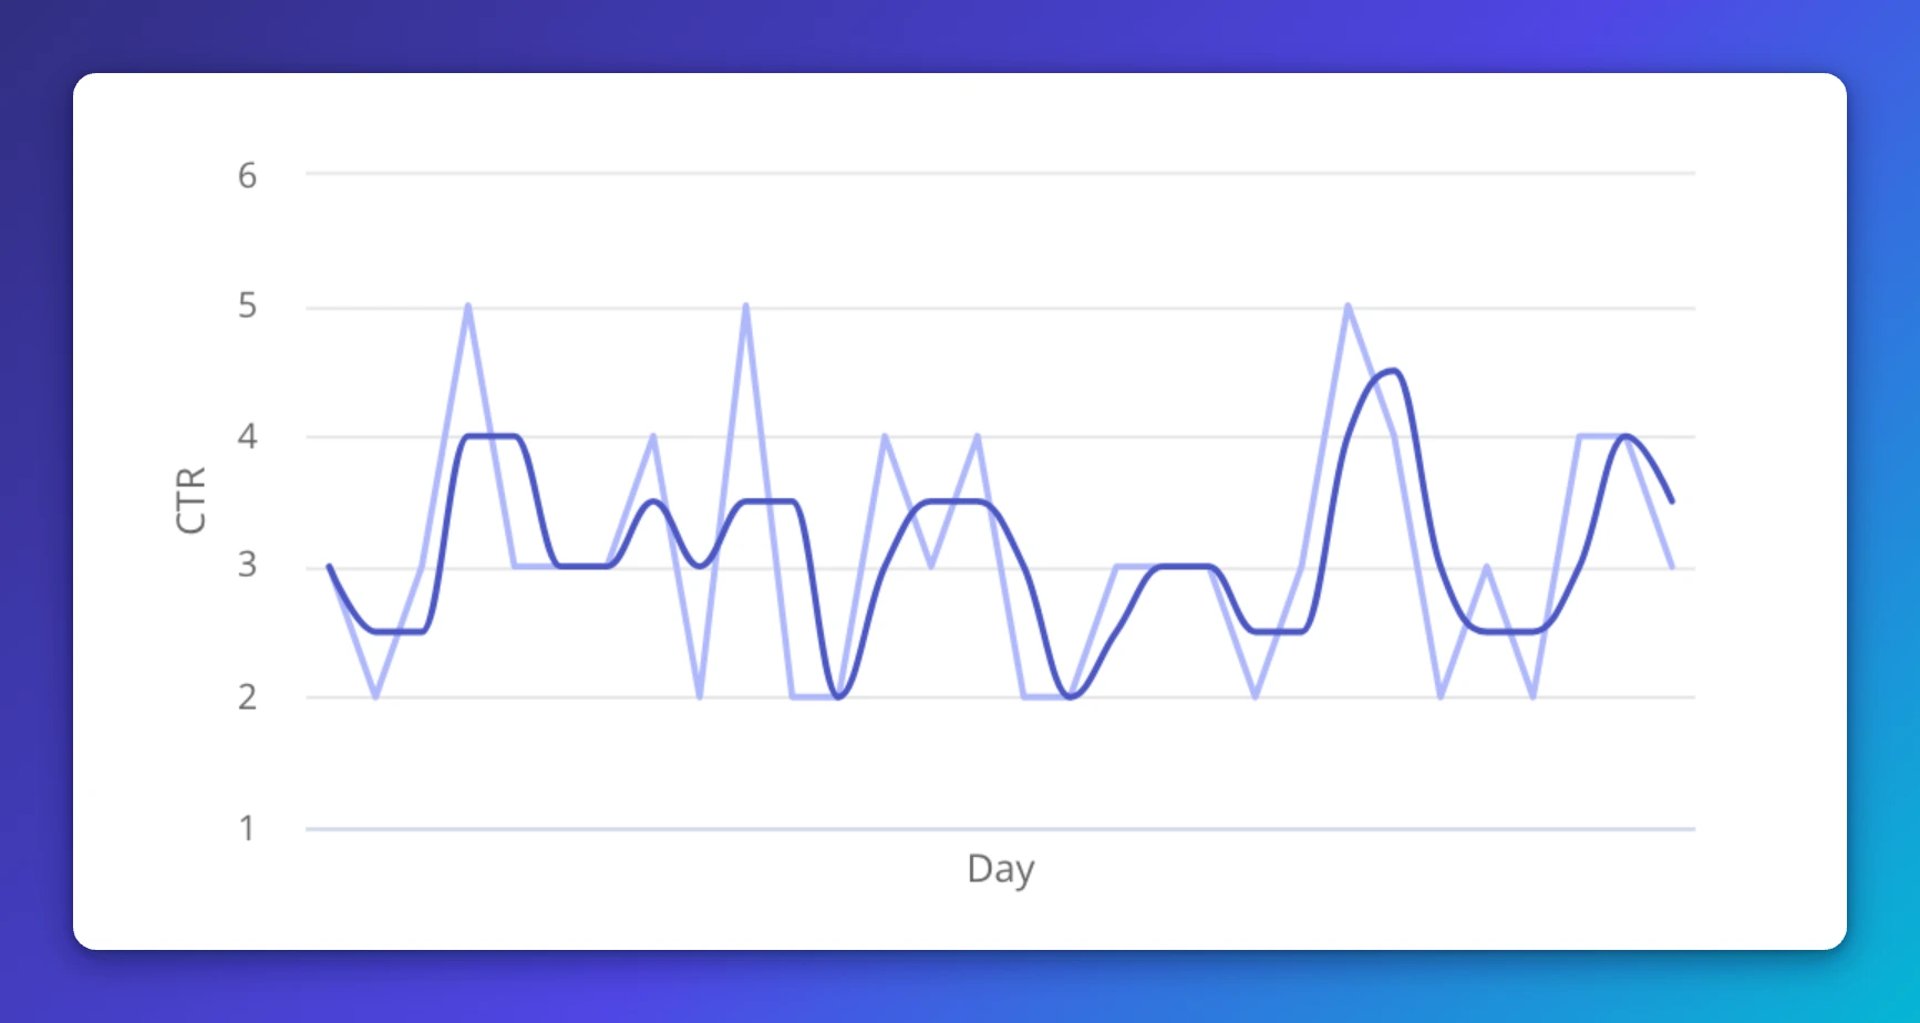
Click-through rate is the percentage of people who see your ad and click it. While clicks tell you volume, CTR reveals quality: how compelling your ad is relative to the impressions it earns.
CTR is tracked per ad, making it a reliable diagnostic. Use it to identify which ads or keywords perform well and where you need to improve. According to WordStream, the average CTR across all industries is 3.17% for search and 0.46% for display. If your CTR lags those benchmarks, test new ad copy, keywords, or targeting before pasting numbers into a spreadsheet and guessing at the cause.
5. Conversions
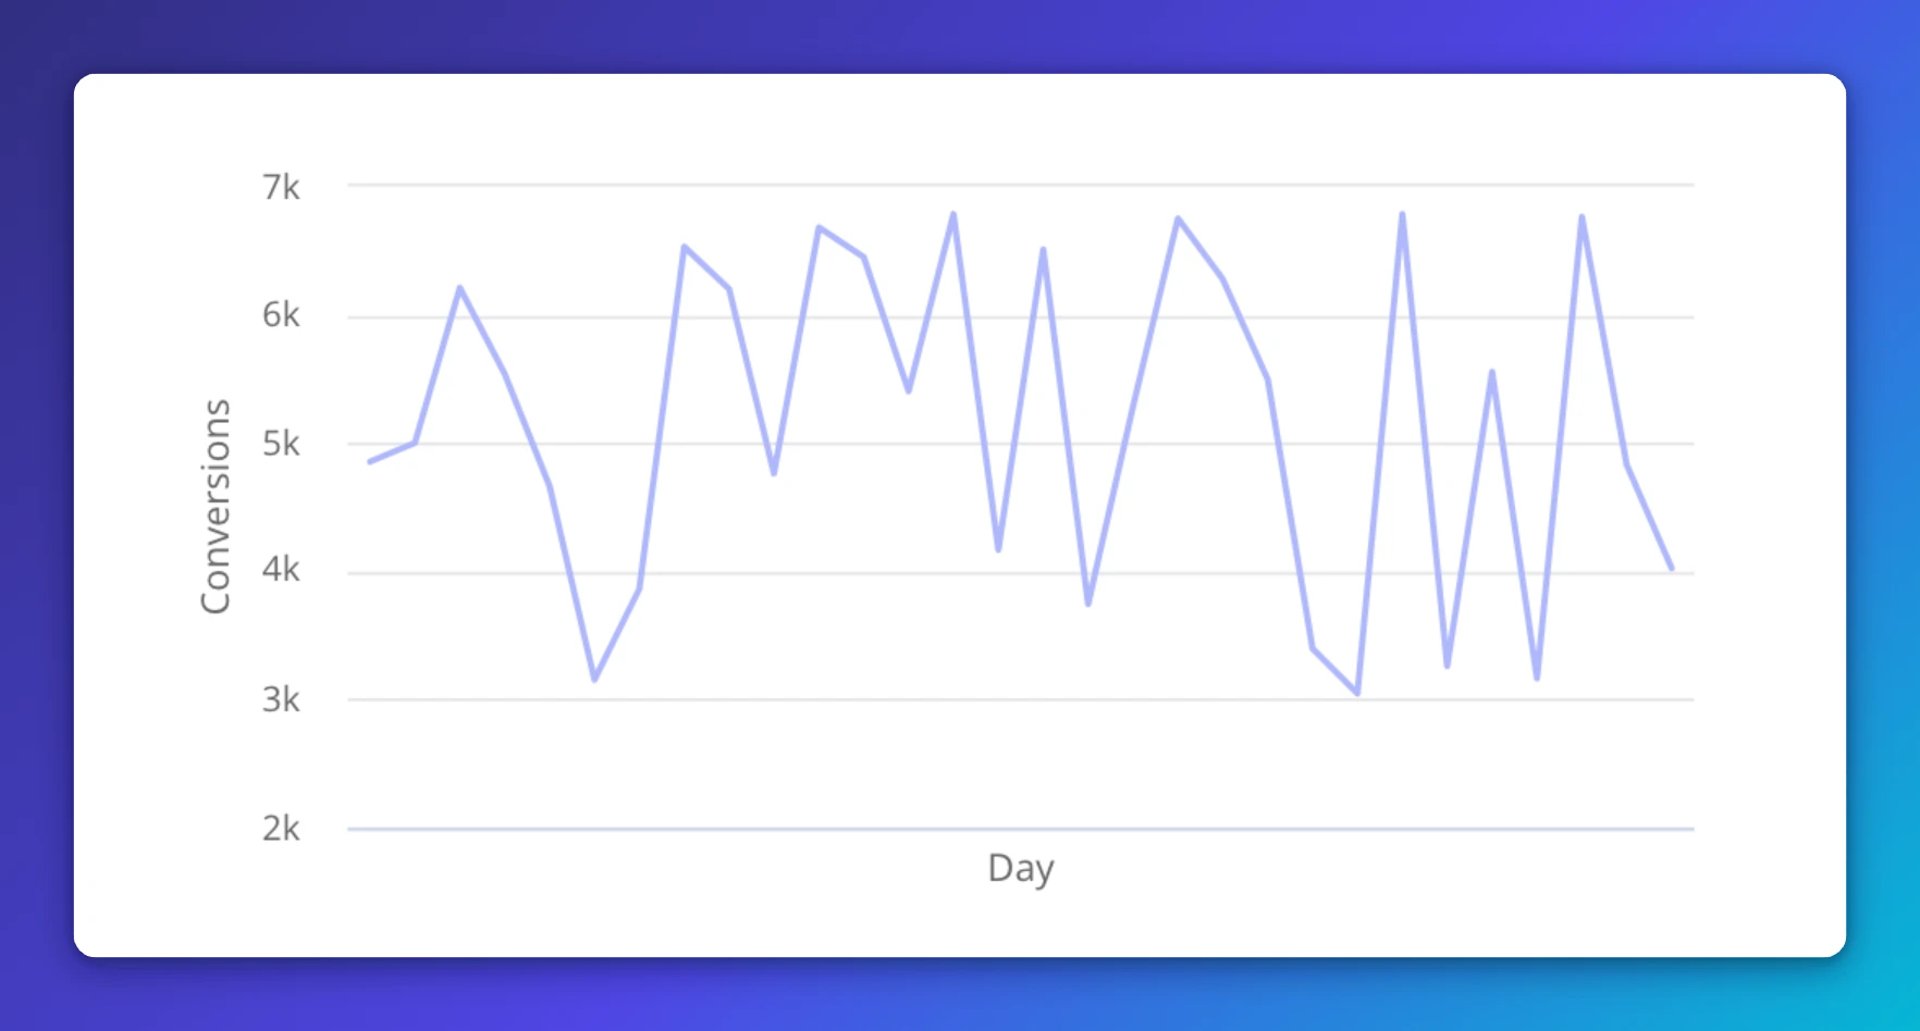
Conversions answer the question that matters most: are users taking the action you want? Whether that's a purchase, trial signup, or form completion, conversions are the clearest signal of campaign success.
Google Ads conversion tracking shows what happens after a user interacts with your ad. Segment performance by keyword, ad, ad group, or campaign, then put more budget behind what's working. According to WordStream, the average conversion rate is 3.75% for search and 0.77% for display. Since conversions drive revenue, make sure your tracking is properly configured so you're acting on accurate data, not assumptions.
Bonus metric: Return on ad spend (ROAS)
Return on ad spend quantifies the revenue generated for every dollar spent on advertising. ROAS shows which ads deliver the best return and which ones need budget reallocation or pausing. It ties spending directly to revenue, which makes it the most useful metric for deciding where to invest next.
Create custom dashboards for you and your team.
Get started with KlipsTrack all your Google Ads metrics in one dashboard
Monitoring five metrics across multiple campaigns inside Google Ads alone is time-consuming and easy to get wrong. A Klips dashboard centralizes all your Google Ads data in one place, updating automatically so you always have current numbers when you need to make a call.
Instead of toggling between reports or explaining your campaign structure to a tool that doesn't know your business, build a dashboard that shows impressions, clicks, CPC, CTR, and conversions side by side. Add filters by campaign, date range, or network type. Share it with your team so everyone is working from the same numbers. Automated refresh means the data stays current without anyone having to pull it manually.
The result: smarter spending, faster decisions, and a small team that operates like a much bigger one.
Updated 2026-08-28
More in Google Ads
How a digital ad agency automated client ROAS reporting with dashboard software

Top metrics to monitor for digital ad campaigns
The top 10 Facebook metrics to track for paid ad success
Facebook KPIs: What to track and why it matters

13 marketing metrics you need to track

10 KPIs To Monitor Your Digital Marketing Performance
Most recent
- SEP 25What SOC 2 taught a small team about trust
- SEP 15The AI race: progress, humanity, and trust
- SEP 9The good advisor
- AUG 11Beyond simple sign-ups: how True Trials and Activation predict growth
- JUL 7Why business leaders miss important trends in their dashboards
- JUN 19The best chart for the job: Visualizing data for non-technical users