Executive Dashboards
Modern executives use KPI dashboards to report and track corporate performance.
What is an executive dashboard?
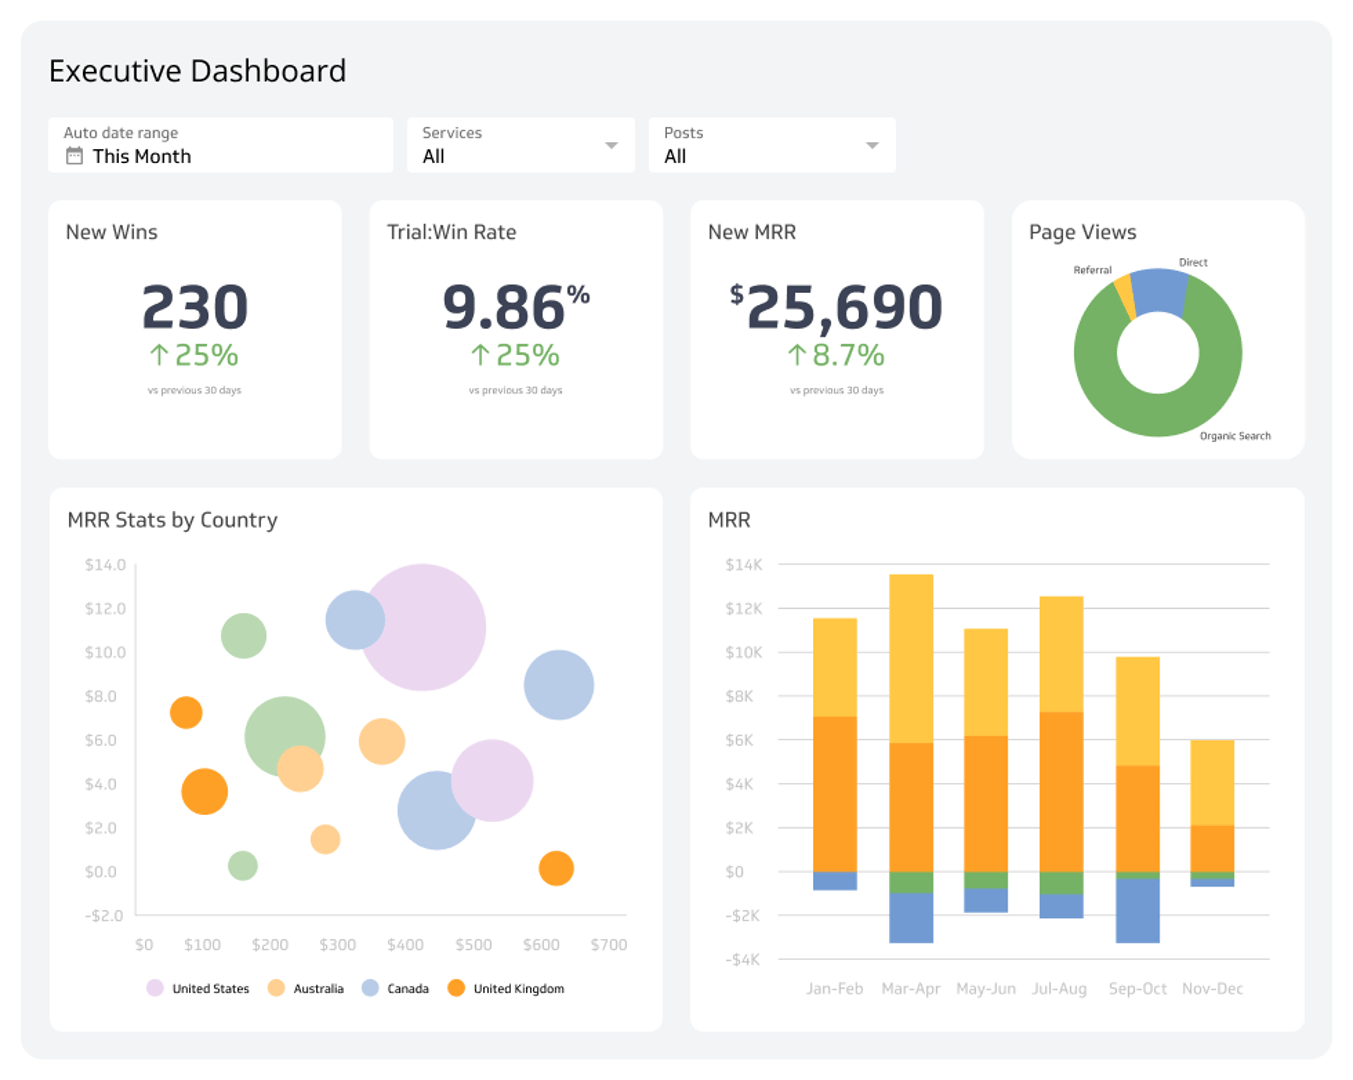
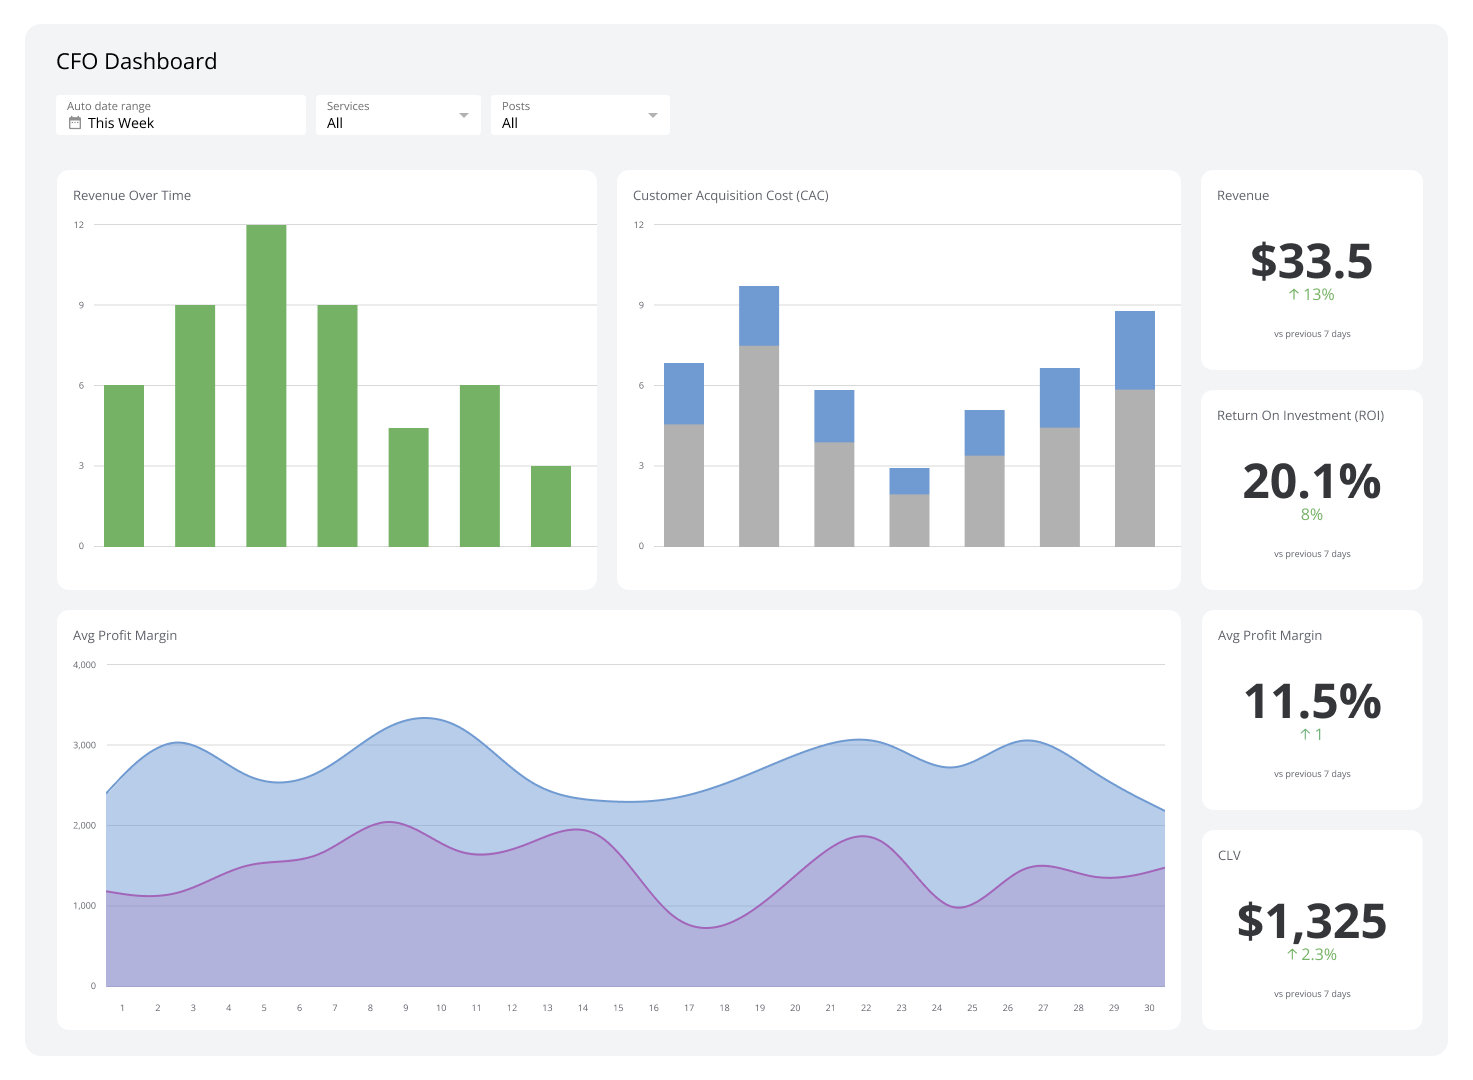
An executive dashboard is a powerful tool that aggregates and visualizes key performance indicators (KPIs) from various aspects of a business in a single, easily accessible location.
Designed specifically for corporate leaders, executive dashboards enable swift, informed decision-making by highlighting critical data points that influence productivity, enhance revenue growth, and mitigate risks.
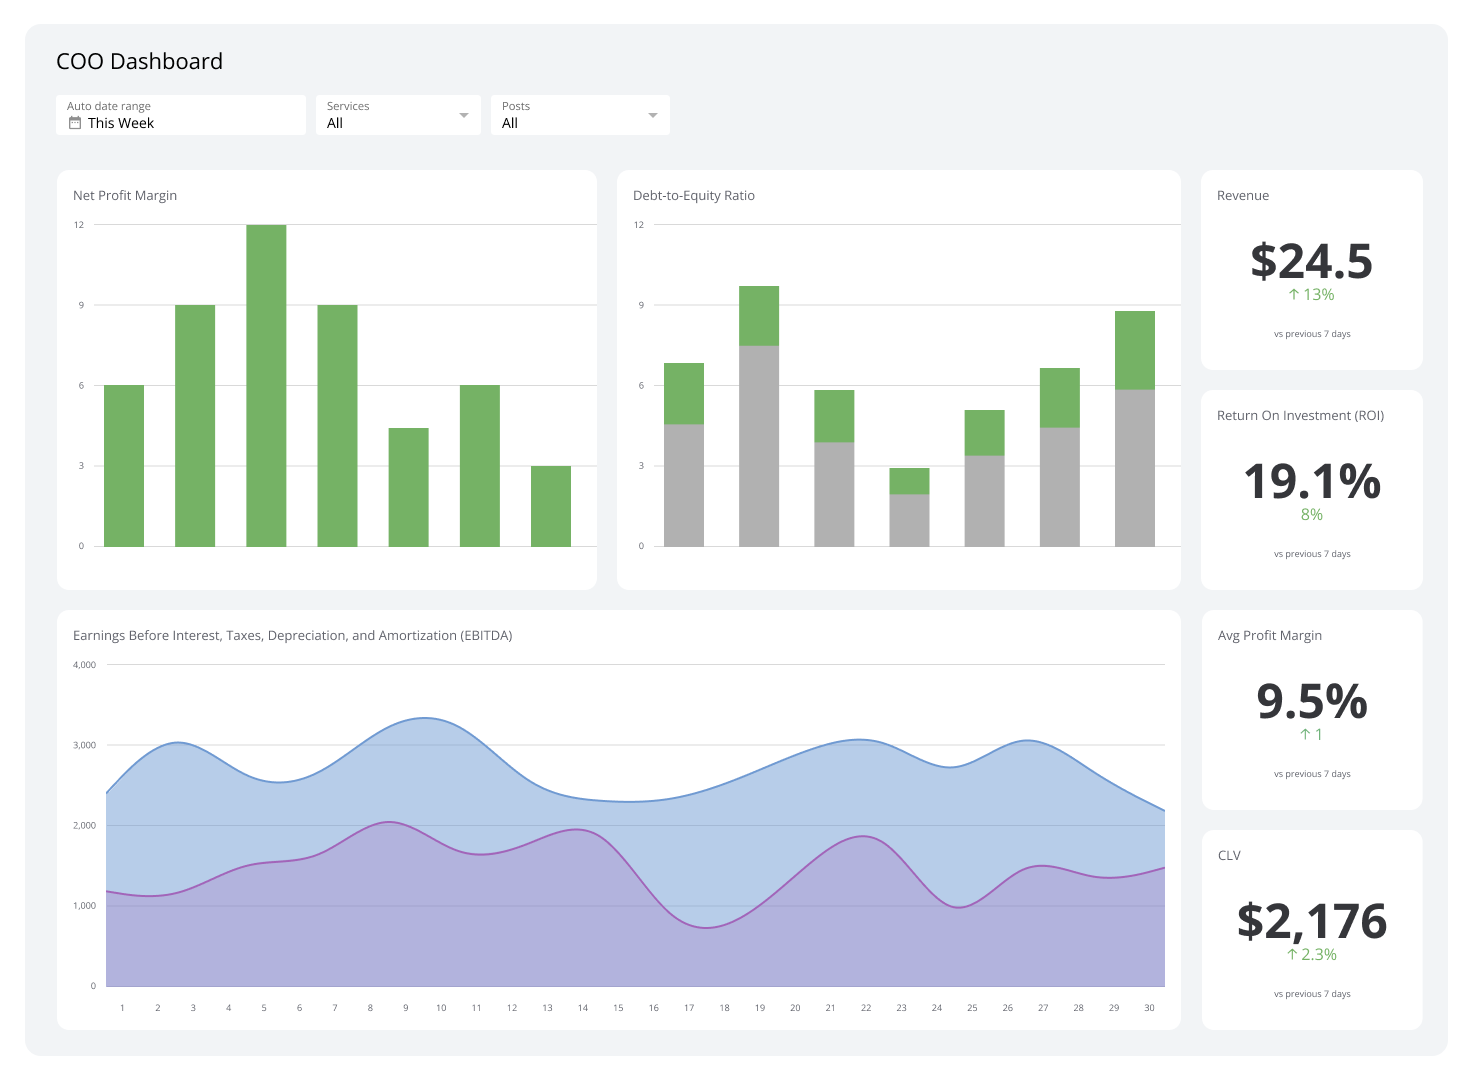
By offering real-time insights, these dashboards assist executives in navigating complex business environments, ensuring that strategic decisions are data-driven and aligned with corporate objectives.
Executive Dashboard Examples
View all dashboard examples- Executive
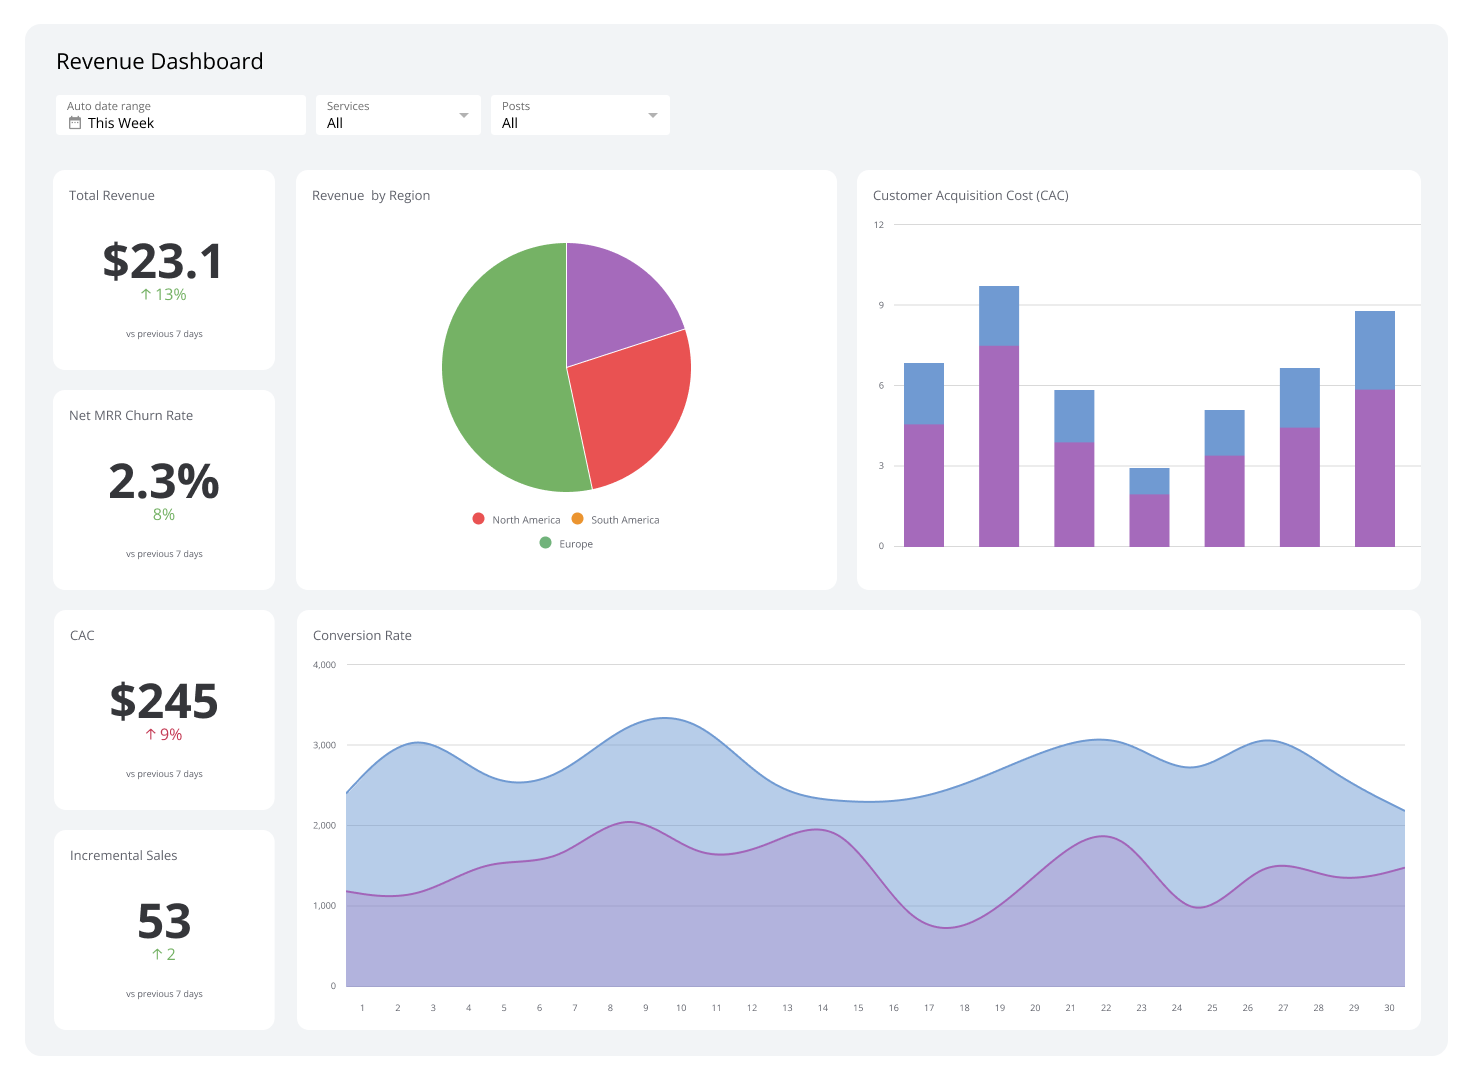
Revenue Dashboard
Your sales data is scattered across spreadsheets and different tools. Sound familiar? This guide cuts through the chaos, breaking down 17 essential revenue dashboards that centralize information, monitor team performance, and get everyone aligned. Discover the right dashboards to make smarter, faster decisions with trusted data.

How do you build an executive dashboard?
To build an effective executive dashboard, you need to consider your audience and consult with them about their dashboard and reporting needs. Each executive on your team will use different KPIs to monitor their business performance – it's essential to understand these KPIs.
Here's a simple process to follow when building executive dashboards.
- Consult with your executive team
- Define your KPIs and key metrics
- Decide on what dashboard you want to build (e.g. financial dashboard, strategic dashboard, CEO dashboard, marketing performance dashboard, etc.)
- Create a basic mockup of your dashboard and any key features tailored to unique needs of your executives
- Select your executive dashboard software
- Connect to data sources
- Create visualizations
- Get feedback
- Deploy and continue to get feedback
What should be on an executive dashboard?
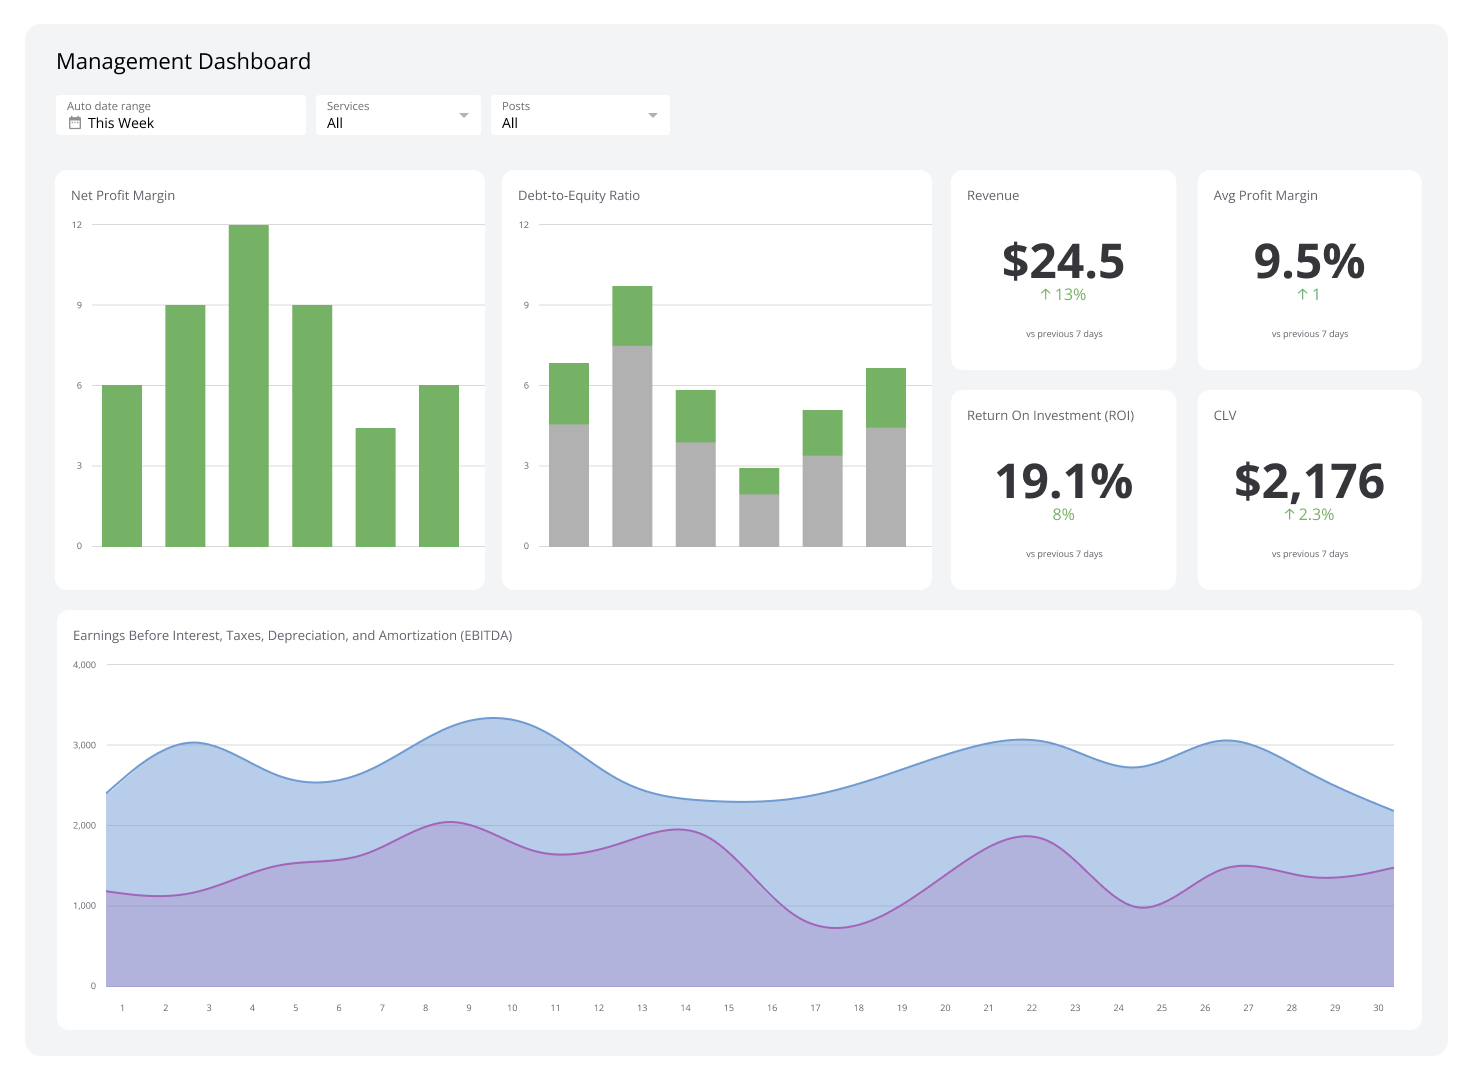
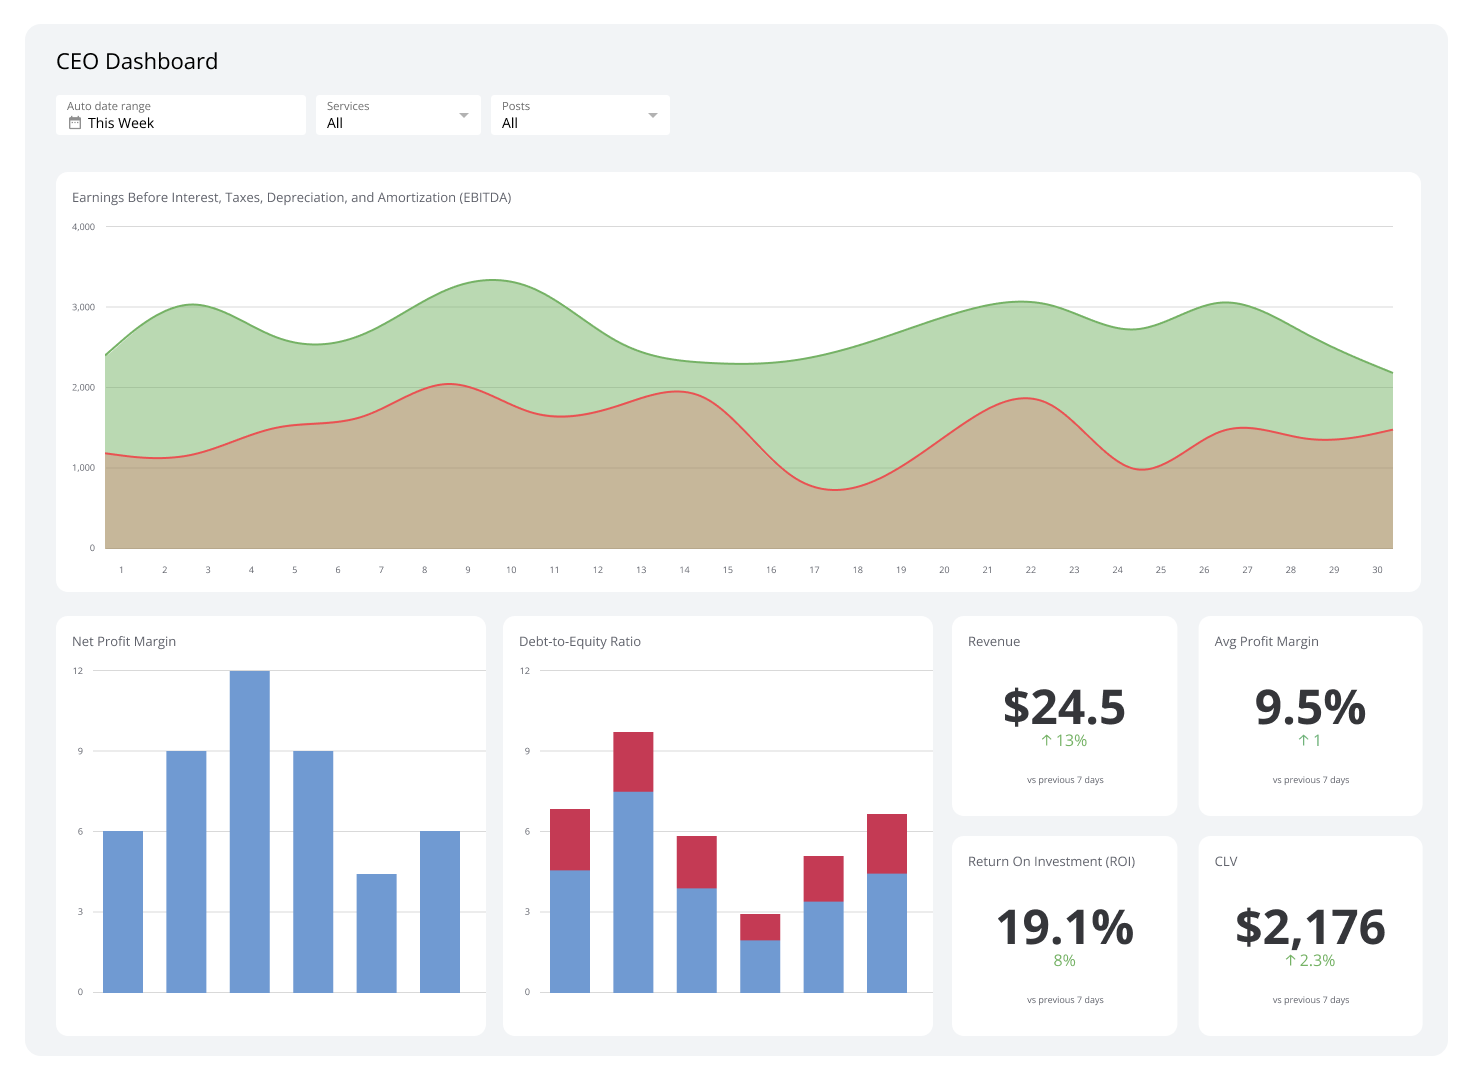
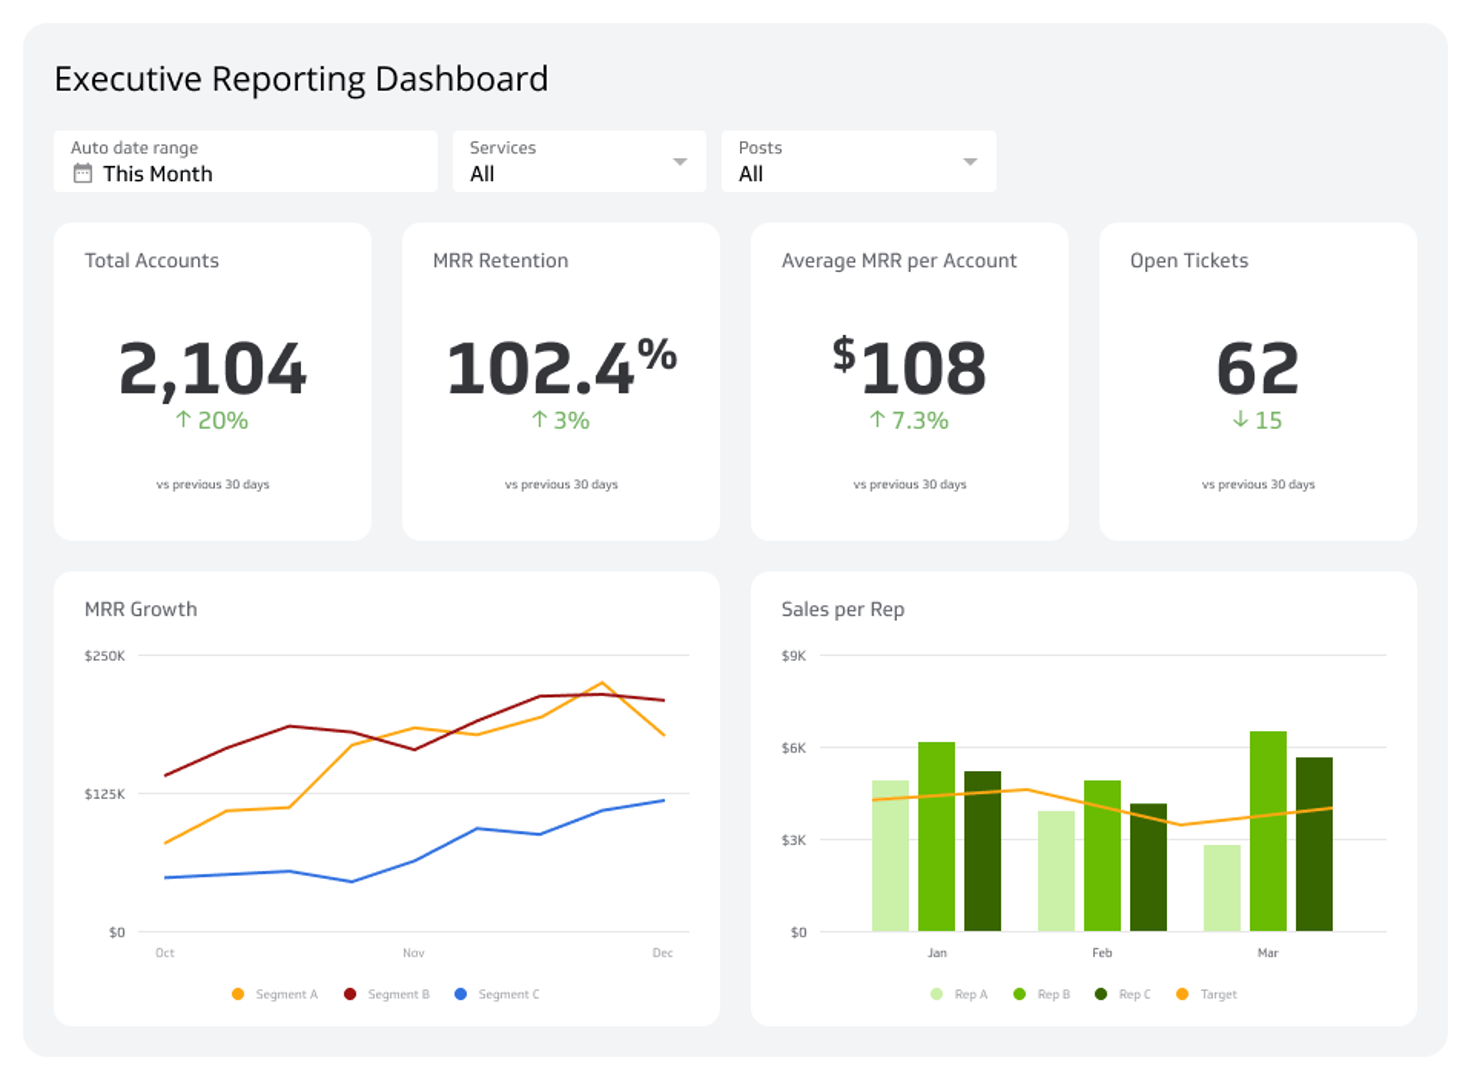
An executive dashboard should be composed of company-level KPIs that allow for a quick review of performance. Each executive in your company will benefit from a customized dashboard with departmental KPIs. As an example, however, a CEO dashboard may display KPIs from each department.
Here's an example of what to include in a CEO dashboard to monitor a software company's performance.
| Department | KPIs |
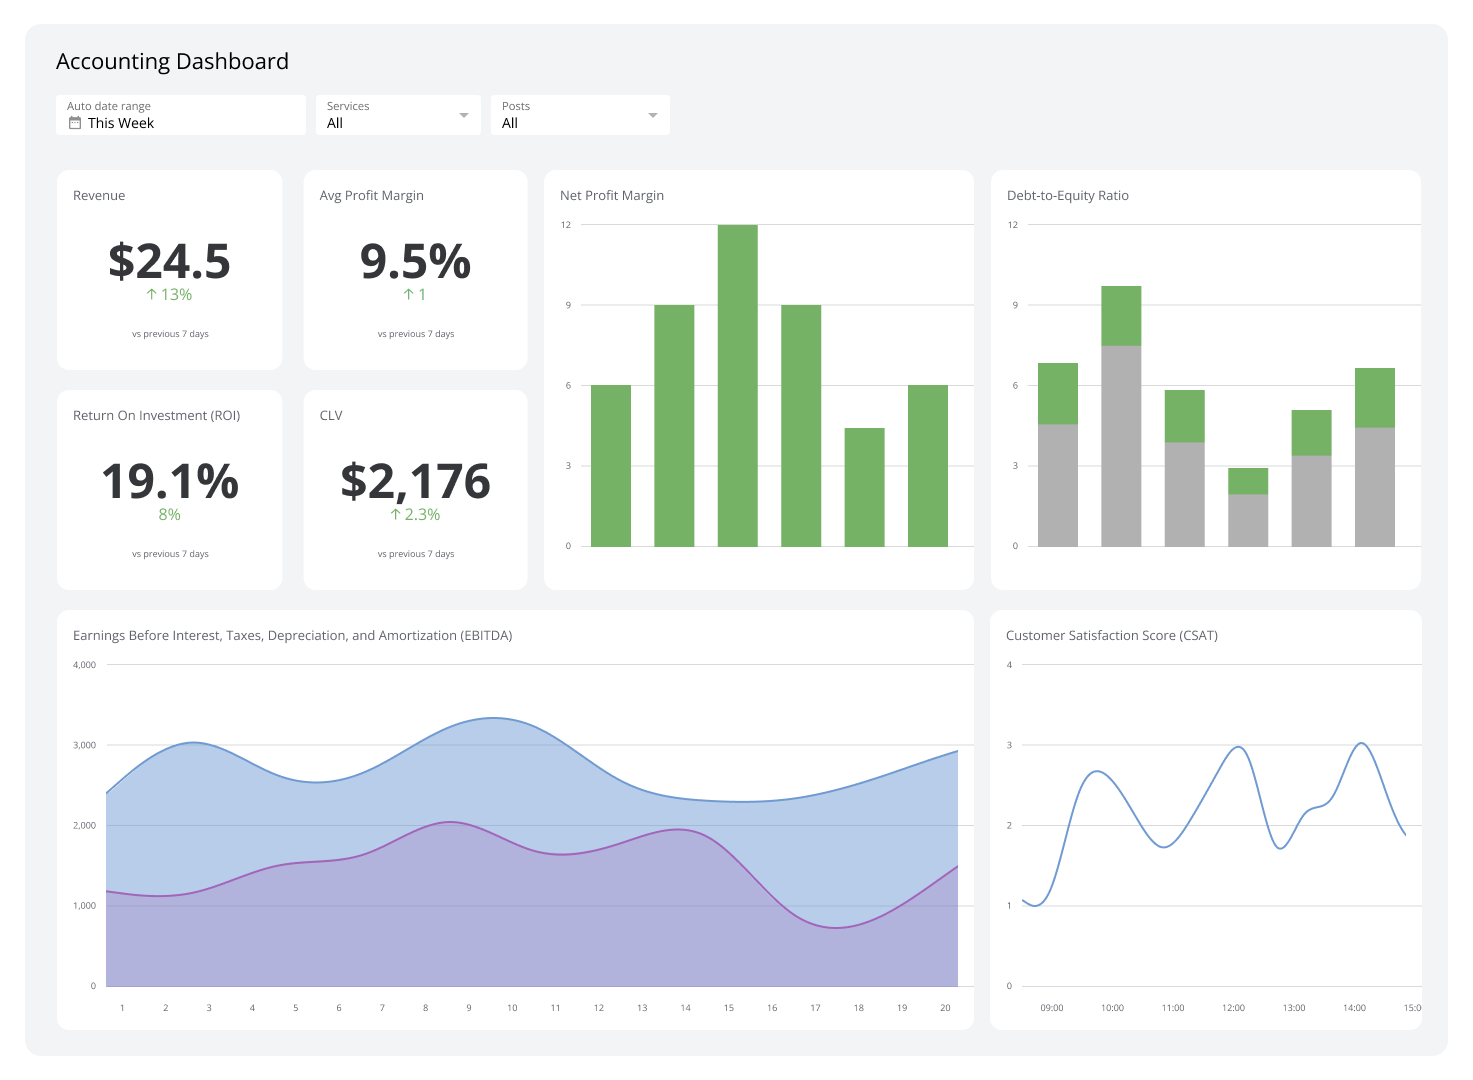
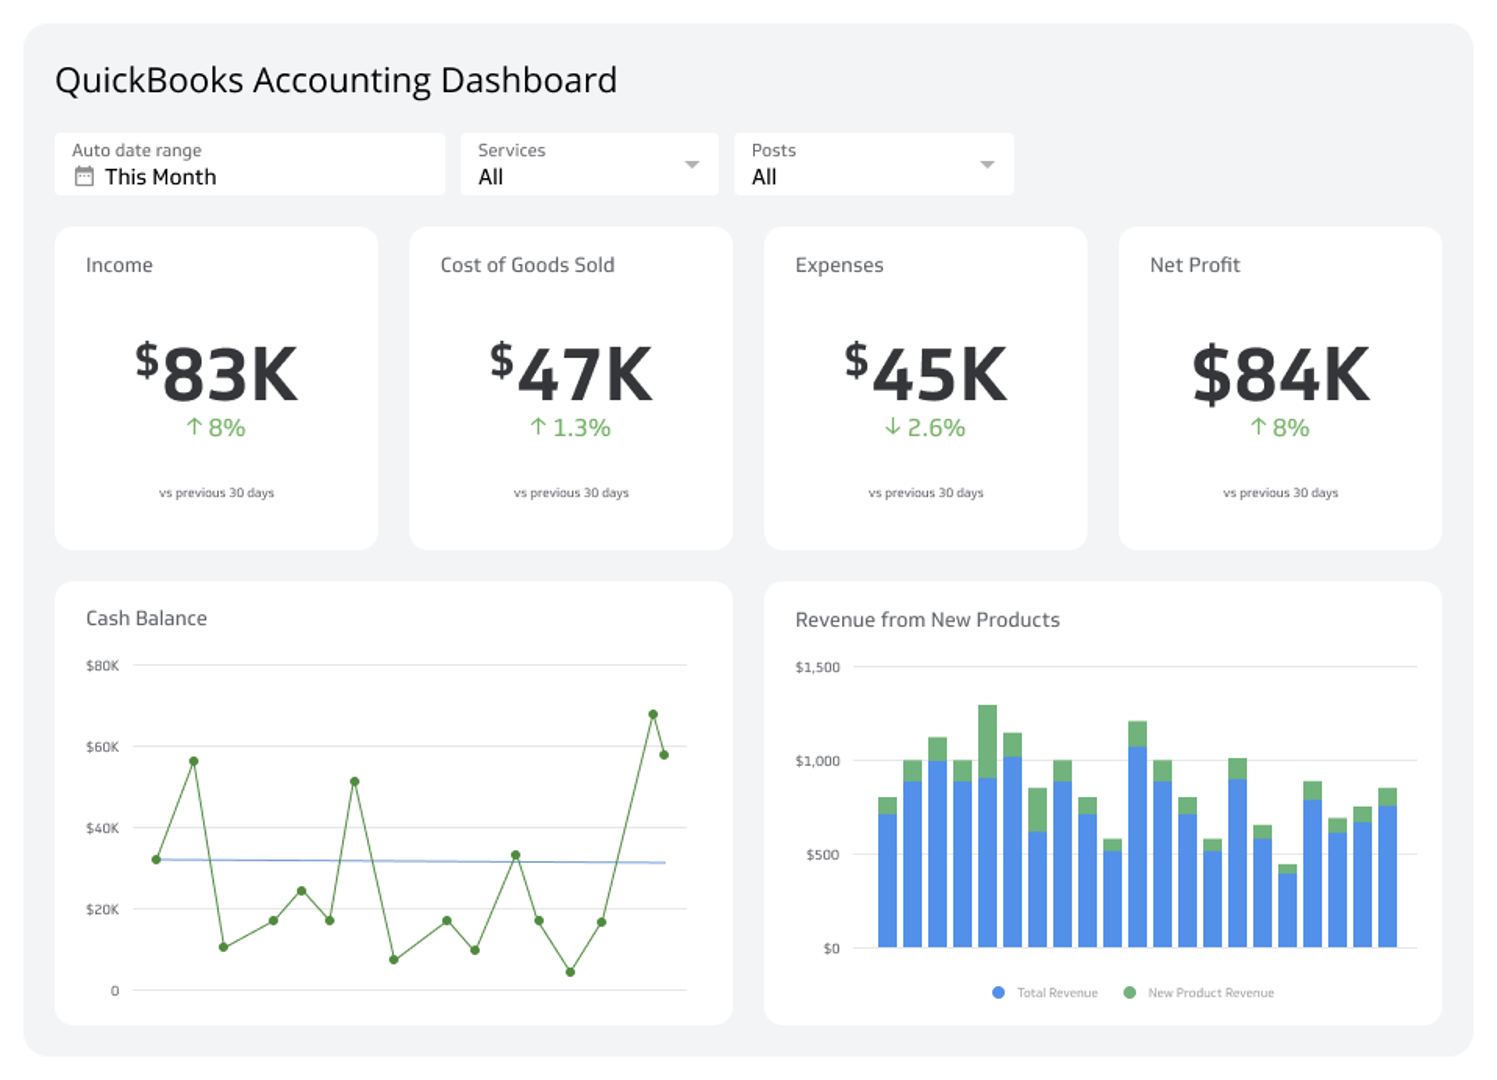
| Finance | Gross Profit Margin EBITDA Accounts Receivable Accounts Payable |
| Sales | Revenue Opportunity Pipeline |
| Marketing | MQLs Web Sessions |
| Support | Ticket Volume Average Resolution Time |
| Development | Lead Time Cycle Time |
Why have an executive dashboard?
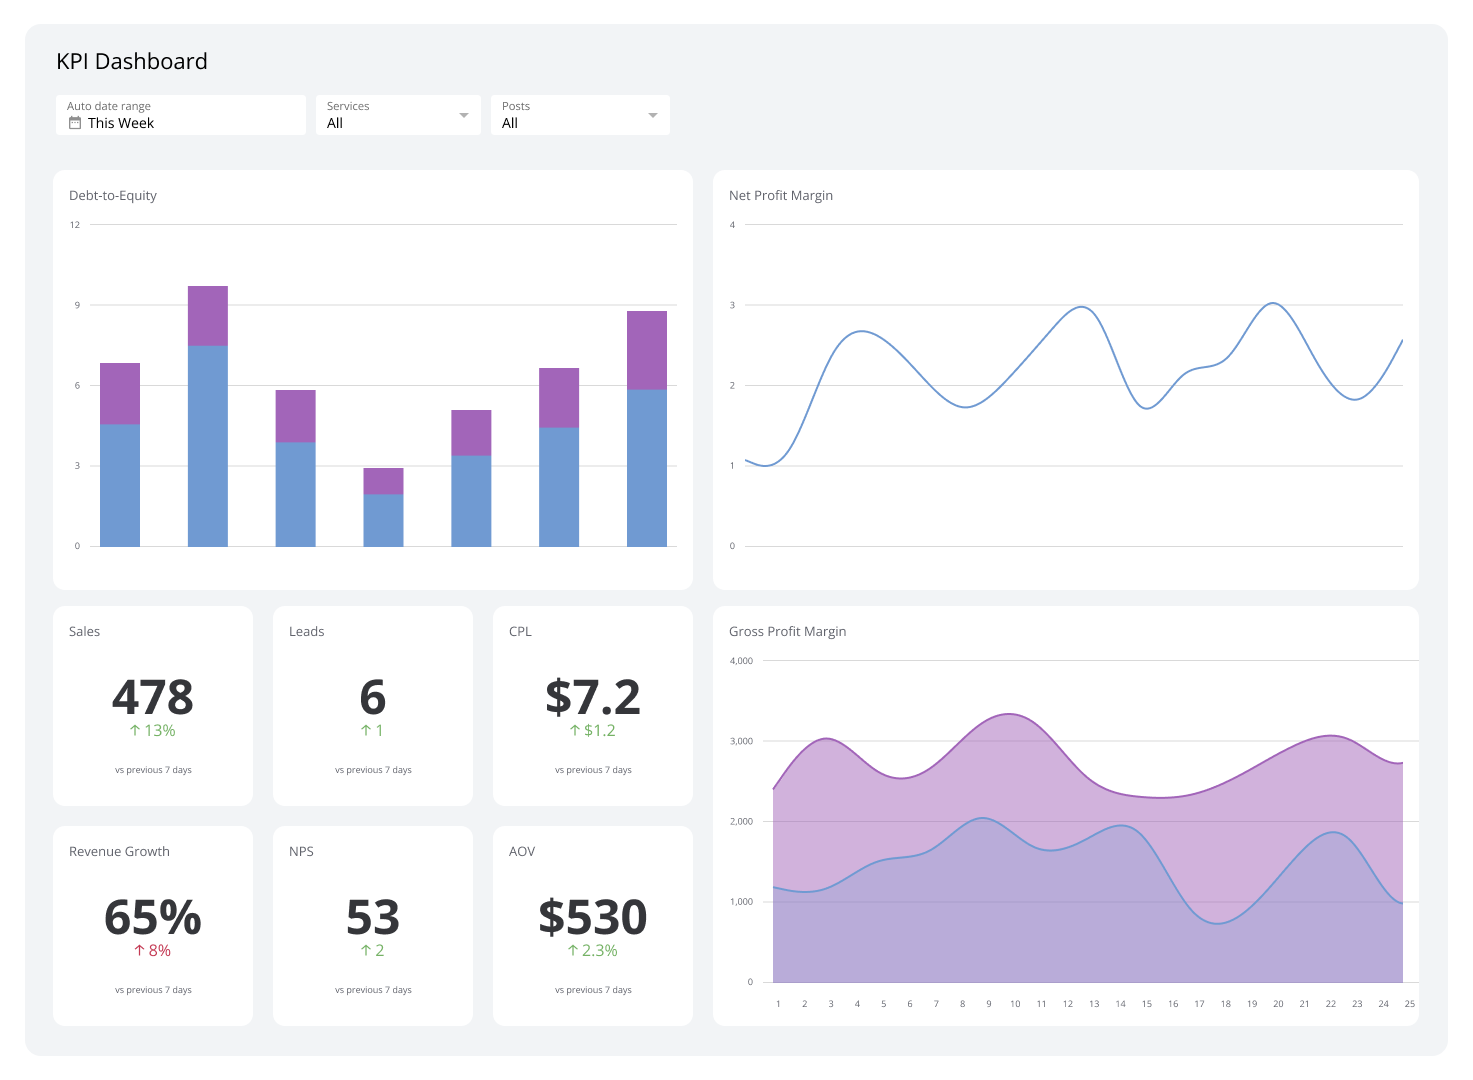
An executive dashboard helps leaders make smart choices for company growth. It effectively presents data and shows a summary of key numbers and KPIs, helping teams see trends and fix problems. This leads to better teamwork, focusing on goals, and using resources well.
Main benefits of executive dashboards
- Saves time: Executive dashboards collect and analyze data from many sources (e.g. financial data, etc.), so leaders spend less time on data work and more on decision-making.
- More openness: By showing real-time company data, a dashboard makes things clear and open across the organization.
- Better communication: A good KPI dashboard helps leaders and departments talk, creating a culture of data-driven decisions and teamwork.
- Smarter decisions: With up-to-date, correct real-time data, leaders can make better choices that fit company goals and plans.
How to make a good dashboard
To keep your dashboard useful, follow these tips:
- Keep it simple: Focus on the most important key performance indicators (KPIs) for each leader, avoiding too much information that can slow them down.
- Check data accuracy: Make sure the data sources are right and reliable to keep trust in the dashboard.
- Update often: Review the dashboard with leaders to ensure it meets their needs and goals. Adjust it as needed for changes in business or company targets.
- Get people to use it: Encourage use of the dashboard in your organization and ask for feedback to make improvements.
In short, good executive dashboards help leaders (e.g. Chief Executive Officer (CEO), Chief Financial Officer (CFO), etc.) make data-driven decisions and determine company's financial health. By understanding each leader's needs and KPIs, making an easy-to-use interface, and focusing on improvement, you can create a reporting dashboard that helps your company succeed.
