Cash Flow Dashboard
Timing differences between income and expenditure can influence immediate cash availability. A cash flow dashboard monitors your company's immediate spending power and cash position.

What is a cash flow dashboard?
A cash flow dashboard monitors your company's immediate spending power and cash position in real time. It tracks the movement of money in and out of your business, helping you understand when cash arrives and when it leaves—regardless of when revenue is officially recorded.
The distinction between cash flow and revenue is critical. Income and expense timing often create gaps between reported revenue and available funds. A cash flow dashboard lets you make informed decisions based on actual financial liquidity rather than revenue projections alone.
Cash flow dashboard examples
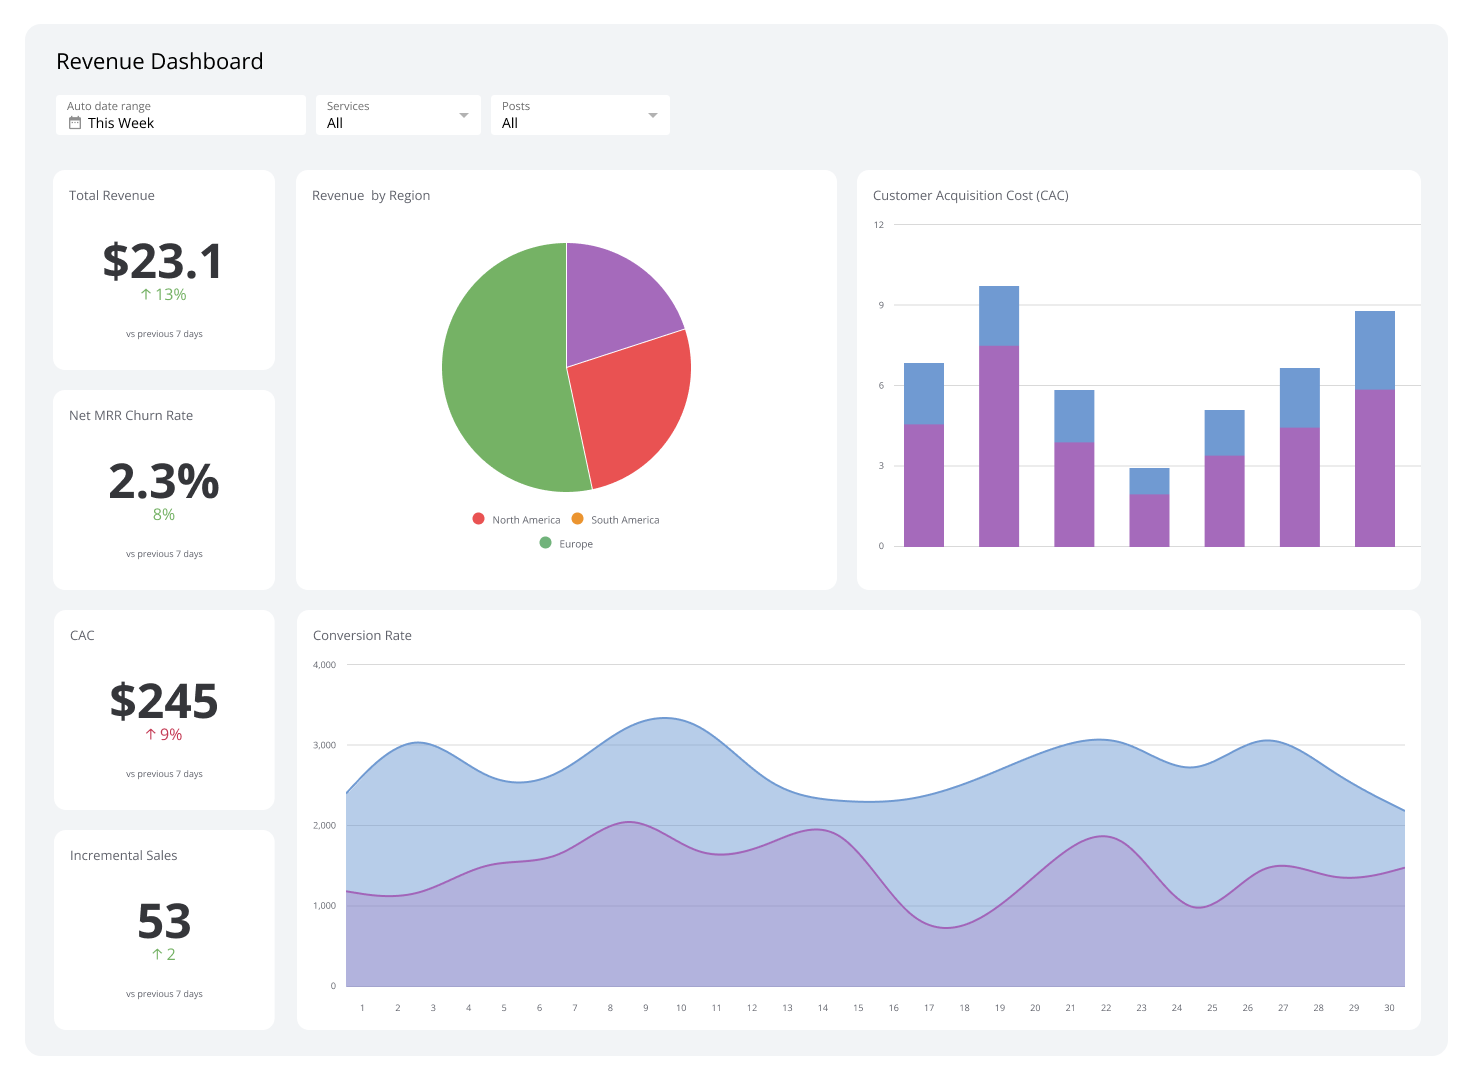
Cash walkthrough dashboard
A cash walkthrough dashboard provides a step-by-step view of how money moves through your business. Using color-coded stages, it highlights inflows and outflows, making it easy to see which activities have the biggest impact on your cash position.
By identifying what drives your cash most, you can adopt better financial practices and support sustainable company growth.
| Who's it for | Chief financial officers (CFOs), financial controllers, treasurers, business owners, financial analysts, c-level executives |
|---|---|
| How often it's needed | Monthly, quarterly, yearly |
| Covered KPIs | Opening cash balance, cash inflows, cash outflows, net cash flow, closing cash balance, cash flow by category, cash conversion cycle (CCC), working capital, free cash flow, cash flow forecast accuracy |
Variance and actual vs. forecast analysis dashboard
Variance dashboards highlight critical differences between forecasted and actual financial data. By focusing on discrepancies, they help leaders understand why forecasts diverged and refine predictions over time. This proactive approach supports better financial planning and risk management.
| Who's it for | C-level executives, financial managers, department heads, budget analysts, investors, board members |
|---|---|
| How often it's needed | Monthly, quarterly, yearly |
| Covered KPIs | Revenue variance, expense variance, profit margin variance, cash flow variance, sales forecast accuracy, budget vs. actual spending, operating expense ratio, return on investment (ROI) variance, earnings before interest, taxes, depreciation, and amortization (EBITDA) variance, working capital variance |
Cash flow projections dashboard
A cash flow projections dashboard forecasts future cash positions based on historical trends and planned activities. It transforms past data into forward-looking insights, helping finance teams plan expenses more effectively, identify potential shortfalls, and optimize working capital. This proactive approach supports competitive decision-making.
| Who's it for | CFOs, finance directors, financial planners, financial analysts, treasury managers, business unit leaders, executives, board members, investors, stakeholders |
|---|---|
| How often it's needed | Monthly, quarterly, yearly |
| Covered KPIs | Projected cash inflows, projected cash outflows, net cash flow forecast, cash balance projections, projected burn rate, forecasted cash runway, projected revenue growth, anticipated expense trends, working capital forecast, liquidity ratio projections |
Cash inflow from sales dashboard
A cash inflow from sales dashboard clearly shows how revenue translates into cash received. It highlights key sales metrics to pinpoint collection delays and process bottlenecks. By tracking both sales performance and cash realization, it supports revenue planning and sustainable business growth.
| Who's it for | Sales managers, CFOs, CEOs, finance directors, business analysts, accounts receivable teams |
|---|---|
| How often it's needed | Daily, weekly, monthly, quarterly |
| Covered KPIs | Total sales revenue, sales growth rate, average order value (AOV), sales by product/service, sales by region, customer acquisition cost (CAC), customer lifetime value, accounts receivable turnover, days sales outstanding (DSO), cash conversion cycle |
Cash inflow from investments dashboard
A cash inflow from investments dashboard outlines revenue generated from your business's investment activities. It tracks incoming money from diverse assets and investments while distinguishing between realized and unrealized gains. This enables you to assess the effectiveness of your investment strategies and make informed decisions that maximize returns.
| Who's it for | CEOs, CFOs, investment managers, financial analysts, board members, shareholders |
|---|---|
| How often it's needed | Monthly, quarterly, yearly |
| Covered KPIs | Total investment revenue, return on investment (ROI), realized gains/losses, unrealized gains/losses, dividend income, interest income, asset allocation percentages, investment performance by category, cash flow from investments, investment portfolio growth rate |
Total actual and forecast available liquidity dashboard
A total actual and forecast available liquidity dashboard combines multiple cash sources—including operating cash, credit facilities, and investments—into one view. It shows both current liquidity and projected positions, helping you understand your financial flexibility and prepare for both opportunities and crises.
| Who's it for | CFOs, finance directors, risk management professionals, c-level executives, board members |
|---|---|
| How often it's needed | Daily, weekly, monthly |
| Covered KPIs | Current ratio, quick ratio, cash conversion cycle, days sales outstanding (DSO), days payable outstanding (DPO), available credit lines, undrawn revolving credit facilities, short-term investment maturities, forecasted operating cash flow, liquidity coverage ratio, net working capital, free cash flow, debt maturity profile, net burn rate, liquidity stress test results |
Net debt and covenants dashboard
A net debt and covenants dashboard monitors how changes in cash flow affect debt levels and financial flexibility. It tracks both debt obligations and earnings trends, helping you understand whether your company can meet covenant requirements and maintain strategic options.
| Who's it for | C-level executives, shareholders, investors, creditors, lenders, financial analysts |
|---|---|
| How often it's needed | Monthly, quarterly |
| Covered KPIs | Net debt, debt-to-EBITDA ratio, interest coverage ratio, current ratio, debt service coverage ratio, free cash flow, leverage ratio, liquidity ratio, covenant compliance metrics, cash flow trends |
Consolidated actual and forecast cash positions dashboard
A consolidated actual and forecast cash positions dashboard provides real-time visibility of your company's cash across all accounts and business units. This single source of truth incorporates data from multiple bank accounts and operational areas, serving as the foundation for all cash reporting and treasury decisions.
| Who's it for | Treasury teams, finance executives, CFOs, finance controllers, cash managers, board of directors |
|---|---|
| How often it's needed | Daily, weekly, monthly |
| Covered KPIs | Current cash balance, forecasted cash balance, net cash flow, cash conversion cycle, working capital, days sales outstanding (DSO), days payable outstanding (DPO), currency exposure, liquidity ratios, cash flow variance |
Finance dashboard
A finance dashboard monitors your company's key financial indicators, providing insights into overall health and spending patterns. It tracks receivables status to mitigate risks from overdue invoices and includes exchange rates for international business decisions.
| Who's it for | CFOs, finance directors, treasury managers, financial controllers, accounting teams, business unit leaders, c-level executives, board members |
|---|---|
| How often it's needed | Daily, weekly, monthly, quarterly |
| Covered KPIs | Total cash in bank, burn rate, cash runway, expense breakdown by type, receivables status, exchange rates against US Dollar, month-to-month cash flow changes, liquidity ratios, accounts receivable turnover, working capital |
Expense management dashboard
An expense management dashboard offers visibility into company spending across all categories, enabling strategic cost optimization through detailed breakdowns. It simplifies trend analysis, budget monitoring, and performance comparisons, supporting effective financial management by aligning current expenses with budgetary projections.
| Who's it for | CFOs, finance managers, department heads, budget analysts, procurement managers, expense auditors |
|---|---|
| How often it's needed | Daily, weekly, monthly, quarterly |
| Covered KPIs | Total expenses, expenses by category, expense-to-revenue ratio, budget variance, cost per employee, travel and entertainment expenses, operating expense ratio, expense growth rate, ROI for major expenses, compliance rate for expense policies |
Build better cash flow visibility with Klipfolio
Cash flow dashboards provide real-time insights into your company's liquid assets and spending capacity. They help you make informed decisions based on actual financial liquidity rather than revenue projections.
Klipfolio offers customizable dashboards that deliver real-time financial insights, enabling efficient monitoring of critical metrics and progress tracking. Identify areas for improvement quickly and enhance your financial management.
Start your free trial to experience the benefits firsthand.
At a glance
Focus Area
Cash flow tracking and forecasting
Metrics List
Cash balance, cash inflows, cash outflows, net cash flow, free cash flow, cash conversion cycle, working capital, liquidity ratios
Reference Rate
Daily to monthly depending on dashboard type and role
Watch: Cash Flow Dashboard Overview
Related Dashboards
View all dashboards