Gross Margin vs. Gross Profit
Gross Margin and Gross Profit are two financial metrics that reveal how much money a company keeps after covering the direct cost of what it sells. Knowing the difference tells you whether a number is a dollar amount or a percentage, and why that distinction matters for the decisions you make.
Gross Margin vs. Gross Profit
Gross Margin and Gross Profit are two financial metrics that reveal how much money a company keeps after covering the direct cost of what it sells. Knowing the difference tells you whether a number is a dollar amount or a percentage, and why that distinction matters for the decisions you make.
What is Gross Profit?
Gross profit is the revenue left after subtracting the cost of goods sold (COGS). It is an absolute dollar figure, not a ratio.
COGS covers the direct expenses tied to producing or acquiring what you sell: raw materials, direct labour, and manufacturing overhead. Everything else, including operating expenses, taxes, and interest payments, comes later.
The formula:
Gross Profit = Total Revenue - Cost of Goods Sold
What is Gross Margin?
Gross margin is Gross Profit expressed as a percentage of revenue. It answers a different question than Gross Profit: not "how many dollars did we keep?" but "what share of each revenue dollar did we keep?"
The formula:
Gross Margin = (Gross Profit / Total Revenue) × 100
A higher Gross Margin means more of each dollar survives after covering direct costs, leaving more room to cover overhead, invest in growth, or absorb a pricing shift.
Gross Profit vs. Gross Margin: key differences
Both metrics measure profitability at the same stage of the income statement. What they tell you is different.
| Gross Profit | Gross Margin | |
|---|---|---|
| Format | Dollar amount | Percentage |
| Question answered | How much did we keep? | What share did we keep? |
| Best for | Tracking absolute earnings growth | Comparing efficiency across time or competitors |
| Affected by revenue scale | Yes, grows with revenue | No, holds steady if efficiency is constant |
Gross Profit grows as revenue grows, even if nothing about the business improves. Gross Margin stays flat unless the underlying economics change. That is why Gross Margin is the more useful number when comparing two companies of different sizes, or tracking whether a price change actually improved profitability.
How to calculate both metrics
Take a company with $500,000 in revenue and $250,000 in COGS.
Gross Profit:
Gross Profit = $500,000 - $250,000
Gross Profit = $250,000
Gross Margin:
Gross Margin = ($250,000 / $500,000) × 100
Gross Margin = 50%
The company keeps 50 cents of every revenue dollar after covering direct costs. That 50% figure is what you would compare against a competitor or against last quarter, regardless of how large or small each company is.
Why these metrics matter for decision-making
Gross Profit and Gross Margin are early-warning signals. They show whether the core business model is working before operating costs, taxes, and interest enter the picture. For any leader accountable for a result, these two numbers tell you whether the foundation is sound before you look anywhere else.
A few ways leaders use them:
Pricing decisions: A shrinking Gross Margin often means pricing has not kept pace with rising input costs. Spotting that early gives you time to adjust before it hits net profit margin.
Cost management: If Gross Profit is growing but Gross Margin is falling, revenue is scaling faster than efficiency. That is a cost structure problem worth addressing.
Competitive benchmarking: Gross Margin normalizes for size, making it the right metric when comparing your business to others in the same industry.
Investment signals: A consistently high Gross Margin suggests pricing power or operational efficiency. A low or declining one may signal competitive pressure or cost problems worth acting on now.
How Gross Profit connects to net profit
Gross Profit is the starting point for net profit. Once you subtract operating expenses, interest, and taxes from Gross Profit, what remains is the bottom line.
A company can have strong Gross Profit and still post a net loss if overhead is high. Conversely, a lean operation with modest Gross Profit can be quite profitable if it keeps operating costs under control. Neither metric alone tells the full story, but Gross Profit and Gross Margin tell you whether the foundation is sound.
What affects Gross Margin and Gross Profit
Several factors move these numbers:
COGS changes: Rising material or labour costs compress both metrics directly.
Pricing strategy: Discounting to win market share reduces Gross Margin even if Gross Profit holds steady in absolute terms.
Product or service mix: Selling more of a high-margin product improves Gross Margin without any operational change.
Industry structure: Software companies typically carry higher gross margins than retailers because their cost of delivery is lower. Comparing across industries without that context is misleading.
Industry context matters
Gross Margin benchmarks vary widely by sector. A 50% Gross Margin might be average in one industry and exceptional in another. Tracking your own trend over time is as important as any external comparison. A declining Gross Margin, even one that still looks healthy in absolute terms, often signals rising costs or pricing pressure that deserves attention before it compounds.
Tracking Gross Margin and Gross Profit
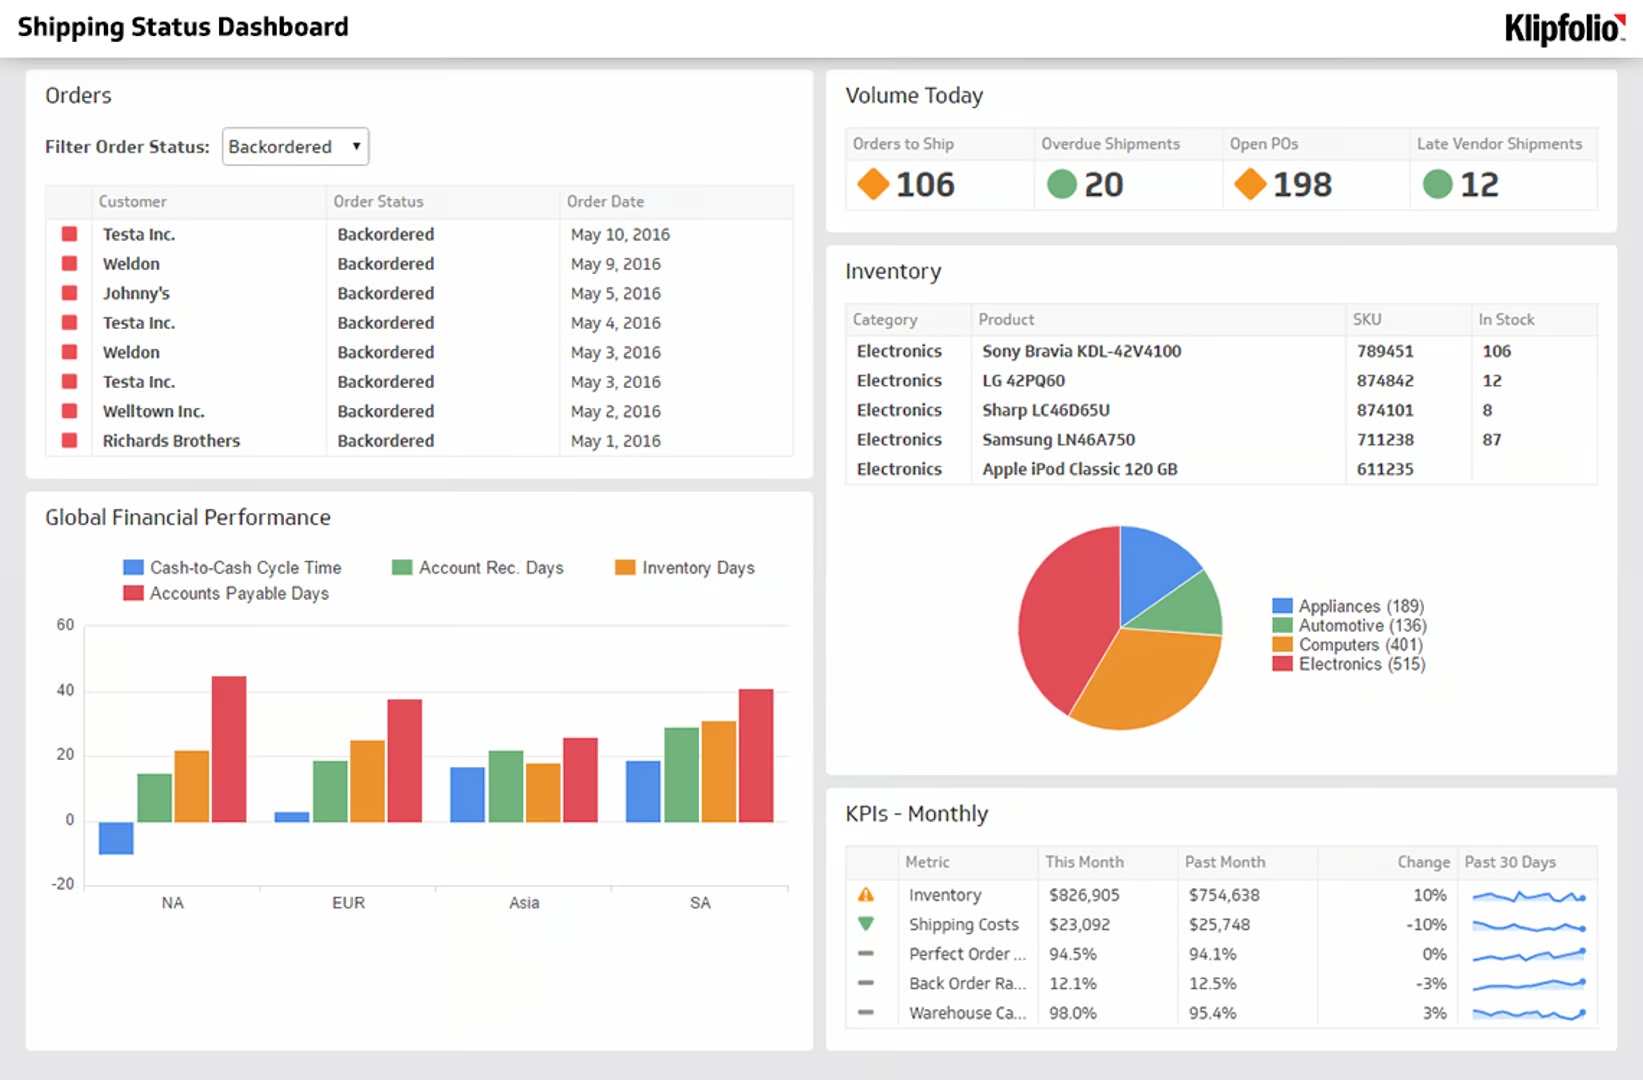
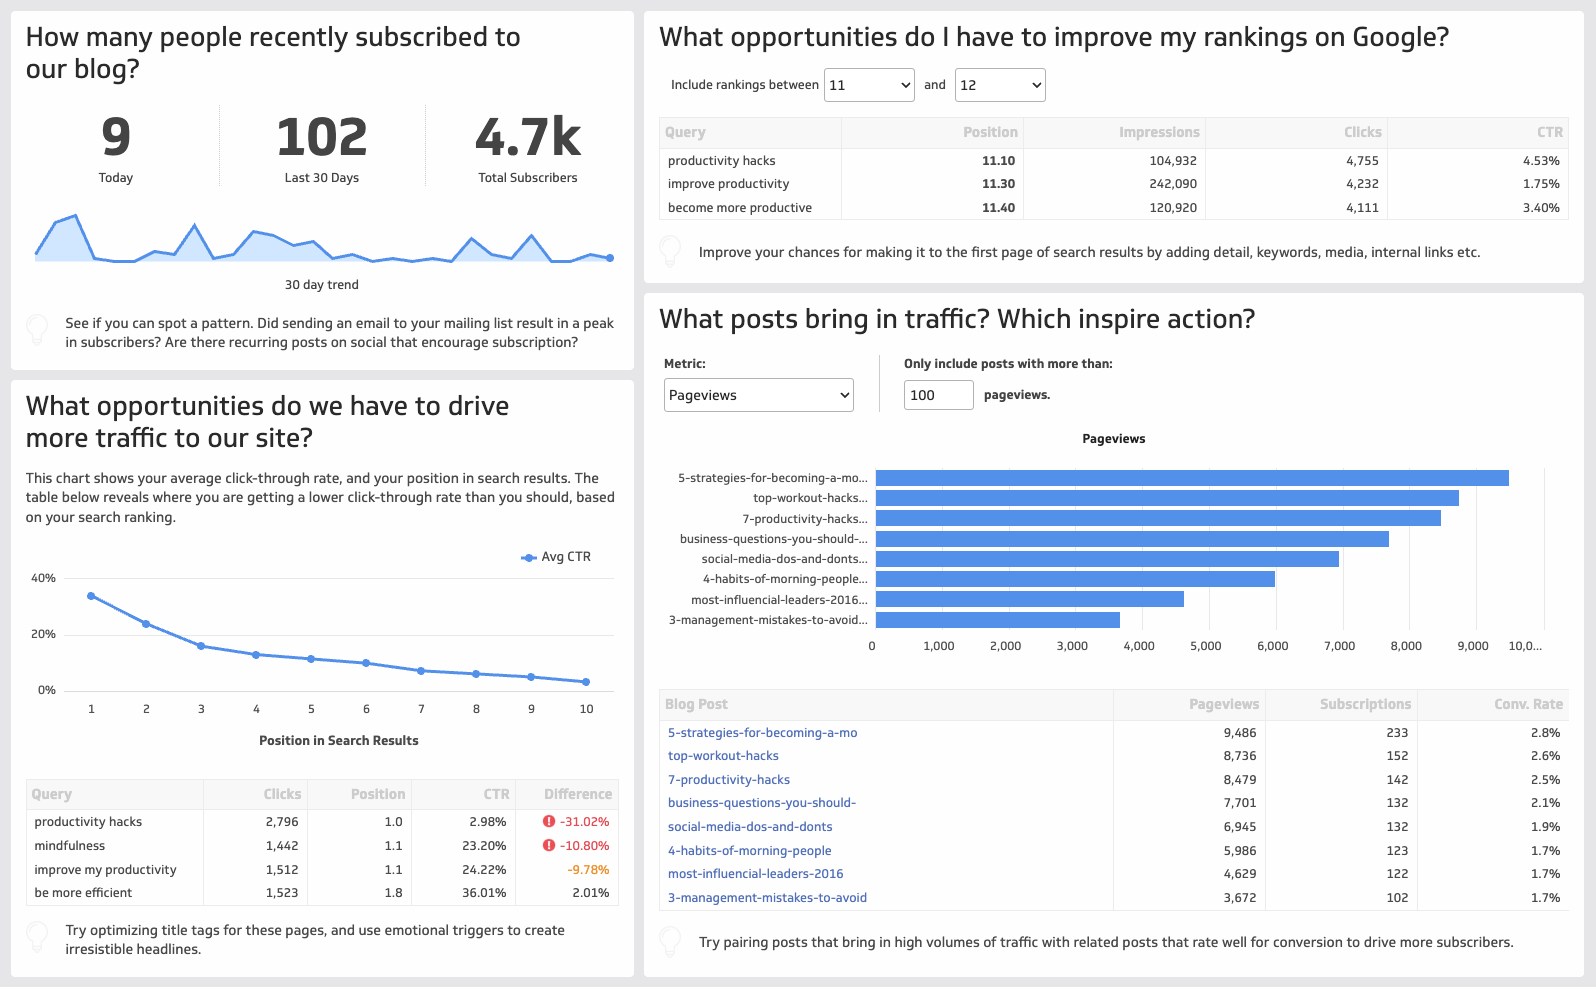
Calculating these metrics once is straightforward. Knowing whether they are moving in the right direction, and catching a shift early, requires consistent tracking over time. A financial dashboard that pulls revenue and COGS data automatically surfaces changes without anyone having to pull a report or paste numbers into a spreadsheet. Klipfolio connects to the sources where that data lives and keeps the numbers current, so you know where you stand without having to check.
Create custom dashboards for you and your team.
Get started with Klips