Agency Reporting: Achieving More Together

Published 2023-10-08
Summary - Here's how agency reporting software makes that chaos more manageable. Check out the metrics each team member should consider contributing.
Would you agree that working in an agency is an organized, creative, fun chaos? That a regular part of your job is drowning in customer requests and figuring out how to stay afloat?
We feel you.
On top of your day-to-day mayhem, you need to prioritize reporting. On the one hand, you’re accountable for reporting to your core team and executives with performance updates, and on the other, you’re who your clients rely on for killer campaigns, market insights, and data analysis.
I think we can agree that although it may seem as though you are juggling a million different things, the best approach is the harmonization between agency and client reporting.
We know reporting isn’t the most enjoyable part of your job.
Reporting is usually tedious and time-consuming, taking you away from the creative projects you do best. In fact, you’ve probably wished that you could just skip your reporting altogether.
Here at Klipfolio, we work with hundreds of agencies who report on a regular basis to their clients… and surprisingly enough, that feeling of dread that arises on a monthly basis around reporting time has disappeared for them.
The truth is, your reports can really make you shine when it comes to your client relationships.
By being transparent with your performance data, you give your clients more confidence and position yourself as a trusted advisor. Take the time to nail down your reporting processes, which not only saves you time and money but provides you the opportunity to showcase your creative flair. How? By building a dynamic dashboard.
One thing that is so important for agencies to understand is that reporting should be a collaborative effort, one that takes into account the strengths of all of your team members. By working alongside all departments, with everyone inputting their own metrics and klips, you can create a dashboard report that gives your clients a full view of their data and business processes, allowing them to make better, more informed decisions.
And you look like a rockstar.
Not only do you look good in the eyes of your clientele, you now have a deeper understanding of your clients, giving you a full-picture view of their business and objectives. Simply put, you can now do better work. Your boss will probably appreciate this too!
“Great things in business are never done by one person” - Steve Jobs
What your team should be tracking
Without a doubt, each member of your agency has individual responsibilities, so naturally, they should each contribute different metrics making building the dashboard a joint effort. The final product will display a full picture for the client, proving that teamwork makes the dream work.
Most of these metrics are pretty popular, and as such, we've built them out for you! Click on each of the suggested metrics to explore further and see if you'd like to add it directly to a dashboard!
Account Coordinator
An Account Coordinator is all about the organization. They are responsible for support and overall day-to-day customer service in order to ensure the client’s objectives are being accomplished through the creative projects and work done by your agency. This includes administration tasks, project tracking, budgets, and research. Some metrics they should consider in the dashboard reporting include:
- Clients Won
- Account by Type
- Revenue and Wins by Type
- Hours Spent on Projects
- Client Balance Summary
- Quickbooks Income and Expenses
- Accounts Receivable and Payable
Director of Marketing
The Director of Marketing is all about innovation and imagination. They are responsible for the development and implementation of marketing strategy. This includes overseeing campaigns, digital marketing, and communications. Some metrics they should consider including in the dashboard reporting process include:
- Return on Marketing Investment
- Incremental Sales
- Cost per Lead
- Keyword Performance
- Customer Lifetime Value
- Customer Acquisition Cost
- Click-Through Rate
- Net Promoter Score
- Social Traffic and Conversion
- Social Visits and Leads
- Traffic by Device
- Referred Traffic
Content Creator
The content creator creates. Simple right? But what isn’t as simple as ensuring that they are creating the right stuff. And that it is performing for the client by engaging potential customers and generating leads. From a content perspective, the metrics that could be included in their reporting include:
- Number of Blogs Written
- Backlinks and External Mentions
- Bounce Rate
- Content Downloads
- Content ROI
- Customer Acquisition Cost
- Email Click-Through and Open Rates
- Keywords by Ranking
UX Specialist/Web Developer
This is the tech-savvy specialist at your agency who designs and evaluates the way in which end users interact with websites and applications. The bottom line, they create an online interactive experience for you and your clients. Metrics that they could add to the dashboard include:
- Number of Fixed Bugs
- Latency
- Net Promoter Score/Happiness
- Task Success Rate
- Error Rate
- Connect to Response Start
- Average Engaged Time
- Number of Improvements to Design System Backlog
Social Media Manager
Your social butterfly is on top of all of the latest social trends. They always know what’s up in the news and the business world. The social media manager is responsible for managing social channels and interacting with customers online. To monitor the success of their social efforts, they should include the following metrics:
- Social Interactions
- Social Traffic and Conversions
- Number of Followers and Subscribers
- Number of Page Likes
- Number of Social Posts
- Average Time on Page
- Number of Visits and Time Since Last Visit
- Total Page Views
- Unique Visitors
- Traffic Sessions from Social Media
Be a Data-Driven Rockstar
As we said, dashboarding is easy when it’s a collaborative effort done by the entire team. From a dashboard software standpoint, you can set up a team approach by doing the following with us:
- Sign up for Klipfolio
- Get one of our friendly success team members to turn on Client Management for you
- Add your team as users so everyone can contribute
- Add your client accounts
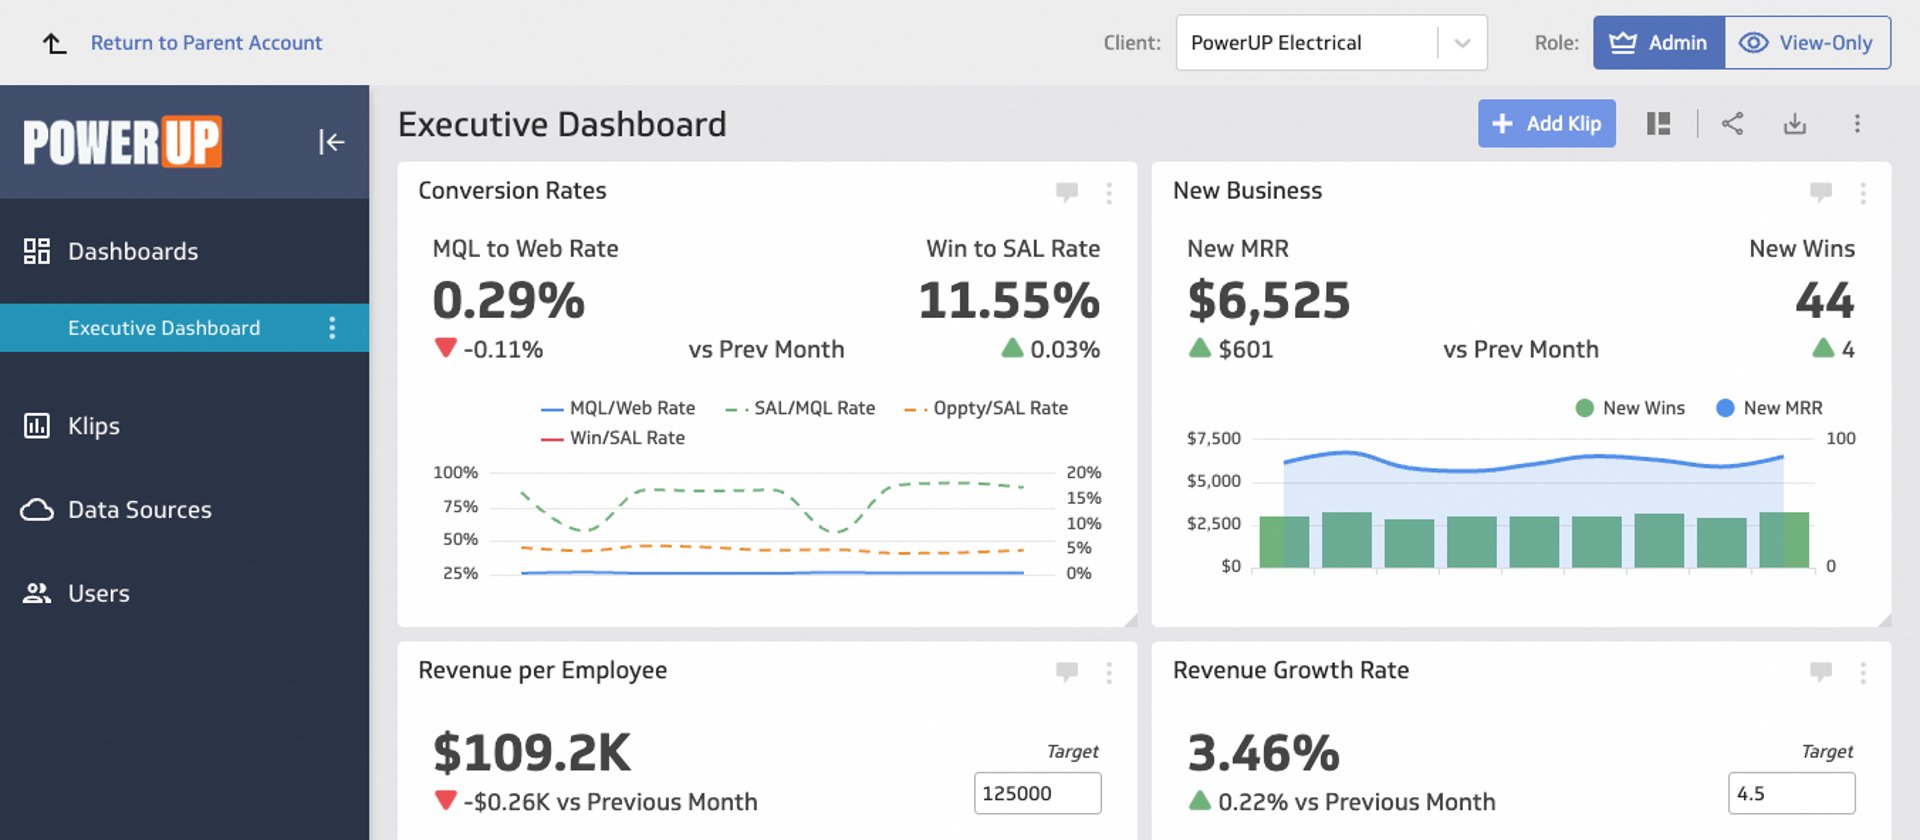
- Create a dashboard for your agency and dashboards for your clients
a. Connect your data
b. Build your Klips
c. Customize
d. Track, monitor, and re-evaluate
By creating harmony between agency and client reporting, you can focus on the work that you do best. By building client dashboards, you’re not only saving valuable time but enhancing your client service experience and, in turn, improving the impression your clients have of your agency. Building dashboards for yourself also saves you time and provides you and your team with quick real-time glances at all of the data you need to know in order to make faster, smarter decisions instantly - it’s a win-win situation.
So, enjoy the organized chaos and happy dashboarding!
Let’s be friends.
Kick-start your data-driven journey.
Request a Klipfolio Consultation
Chat with one of our team members to find out how Klipfolio can add value to your business
Find a partner
Check our our Klipfolio Partner Directory to find the perfect fit for your specific requirements
Related Articles

Klipfolio Partner How-To #1: Duplicating dashboards across client accounts
By Stef Reid — November 27th, 2025
Client management in 5 steps
By Jonathan Taylor — November 26th, 2025
Klipfolio Partner How-To #2: Company Properties can simplify client set-up
By Stef Reid — November 26th, 2025

