Status Dashboard
A clear guide to tracking your team's most important metrics in one place.
What is a status dashboard?
Is your team constantly switching between different apps and spreadsheets just to see what's going on? A status dashboard is a visual display that provides real-time updates on your most important KPIs and other vital data, all in one place.
Crafted for clarity, a status dashboard lets stakeholders quickly understand the current situation and make informed decisions without getting lost in the details. From IT operations to marketing campaigns, status dashboards are used across all types of businesses to improve efficiency and team alignment.
Key components of a status dashboard
A great status dashboard is more than a collection of charts. It's a carefully designed combination of data, visuals, and technology. Here are its primary components:
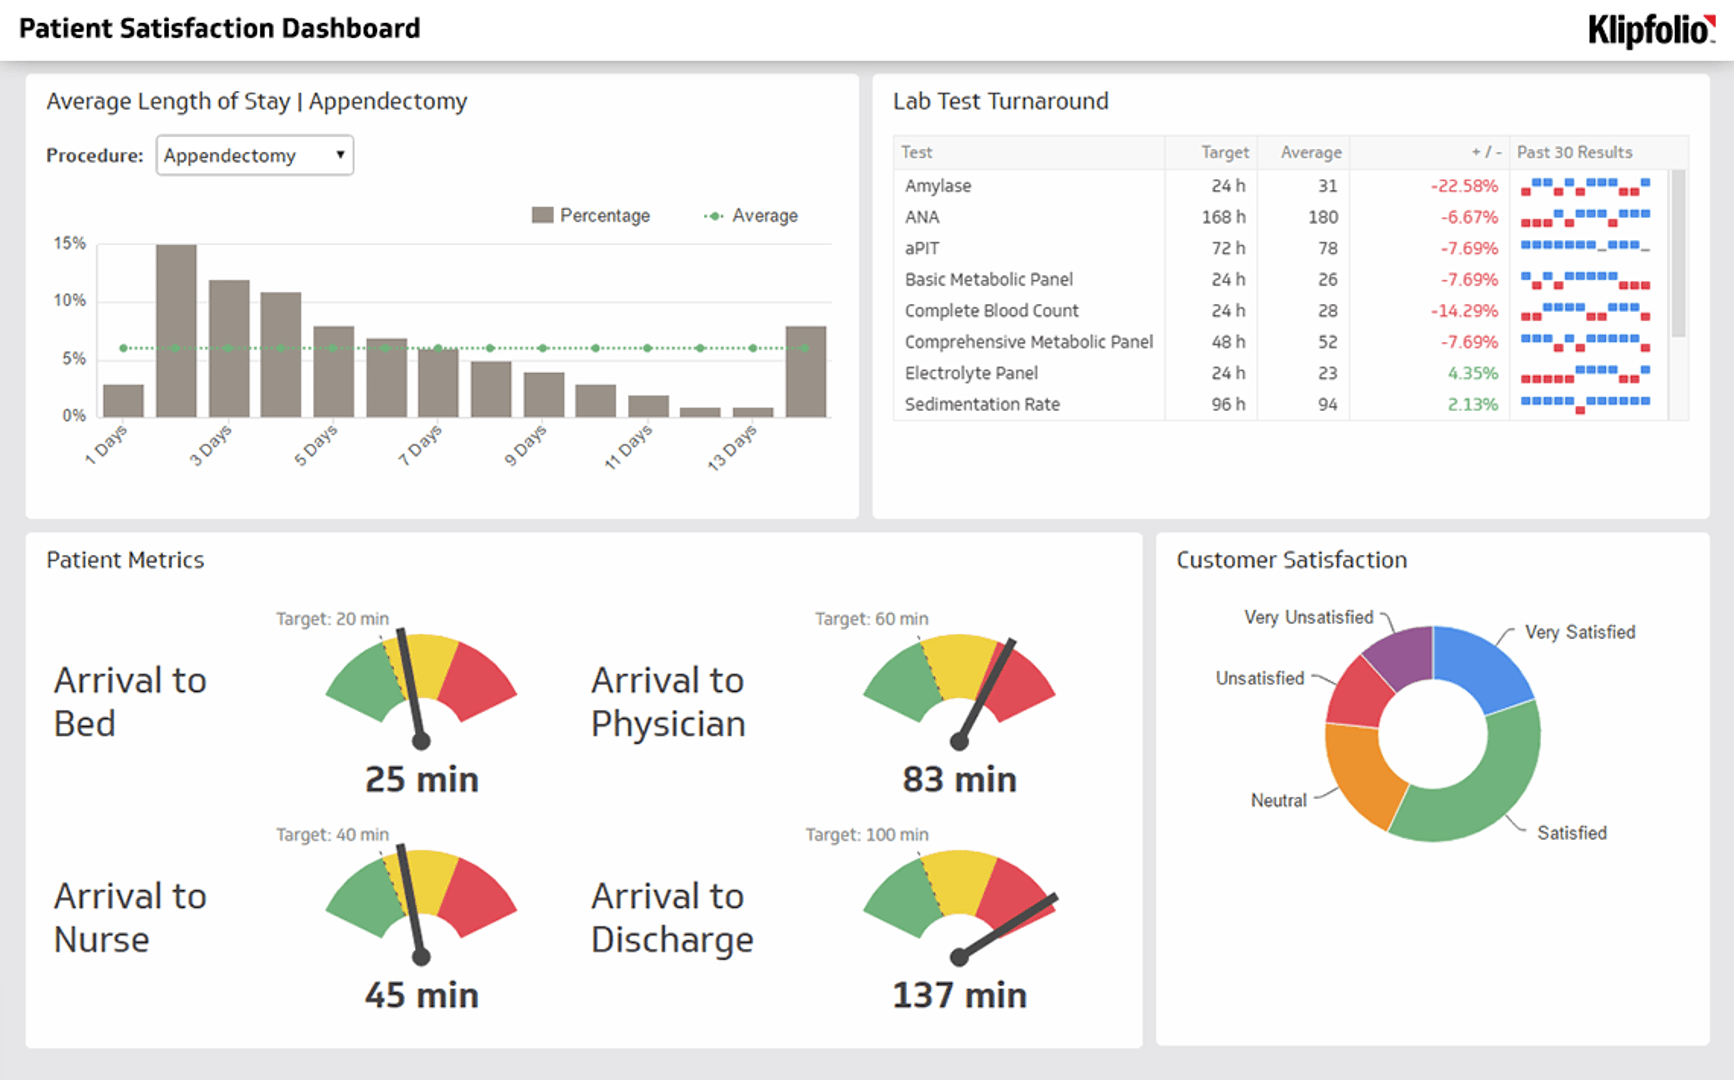
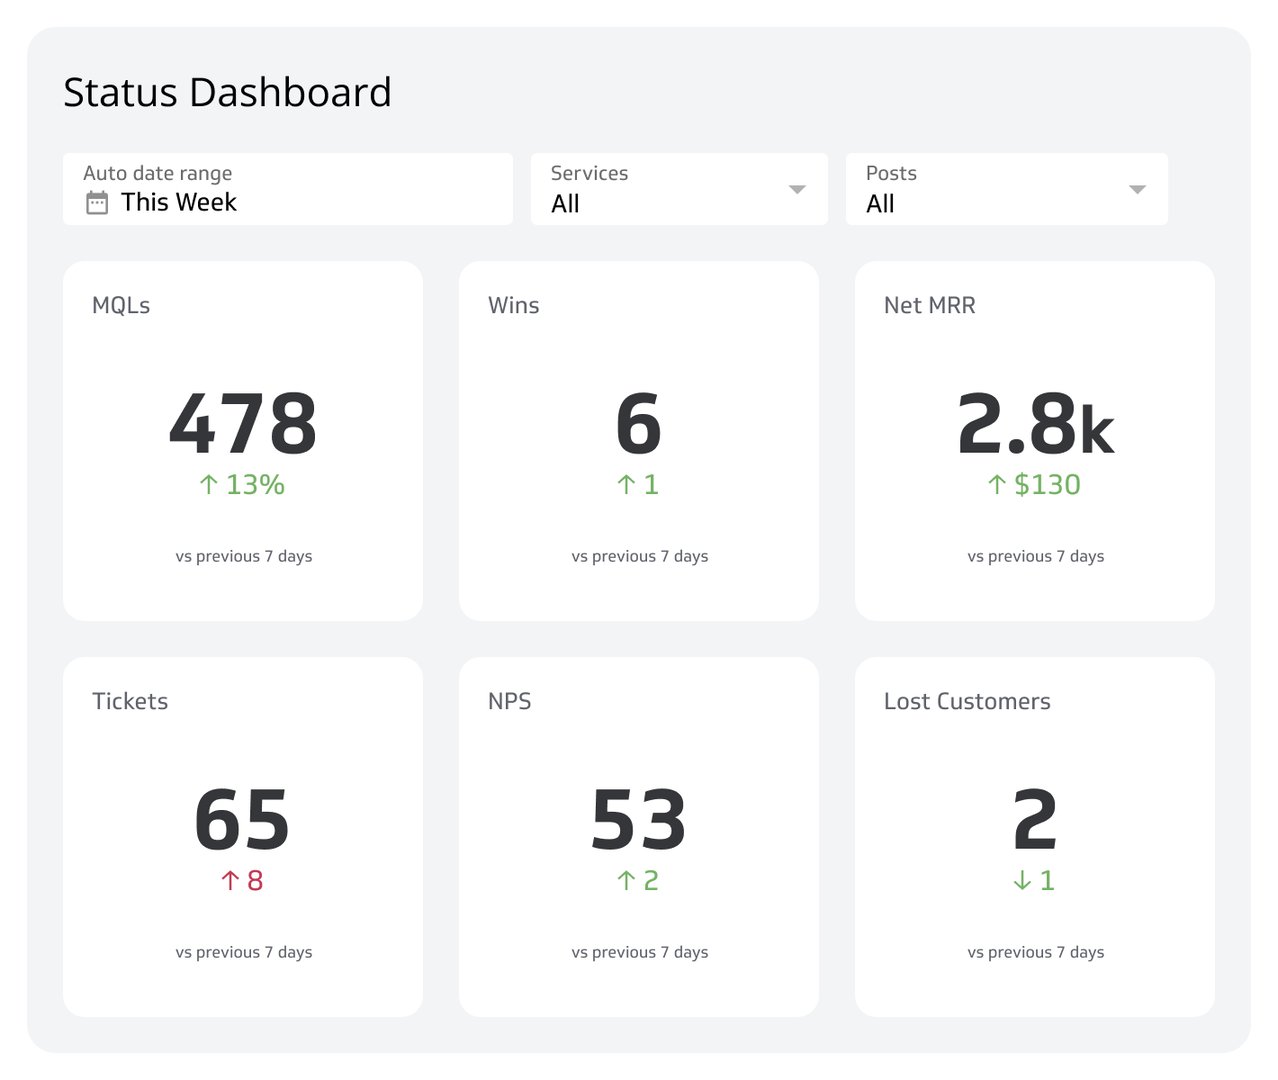
Key Performance Indicators (KPIs): The quantifiable measures you use to track progress toward your goals. A status dashboard displays KPIs in an easily digestible format, like gauges or simple number callouts.
Real-time data: Status dashboards connect directly to your data sources and update automatically, giving you the most current snapshot of your operations.
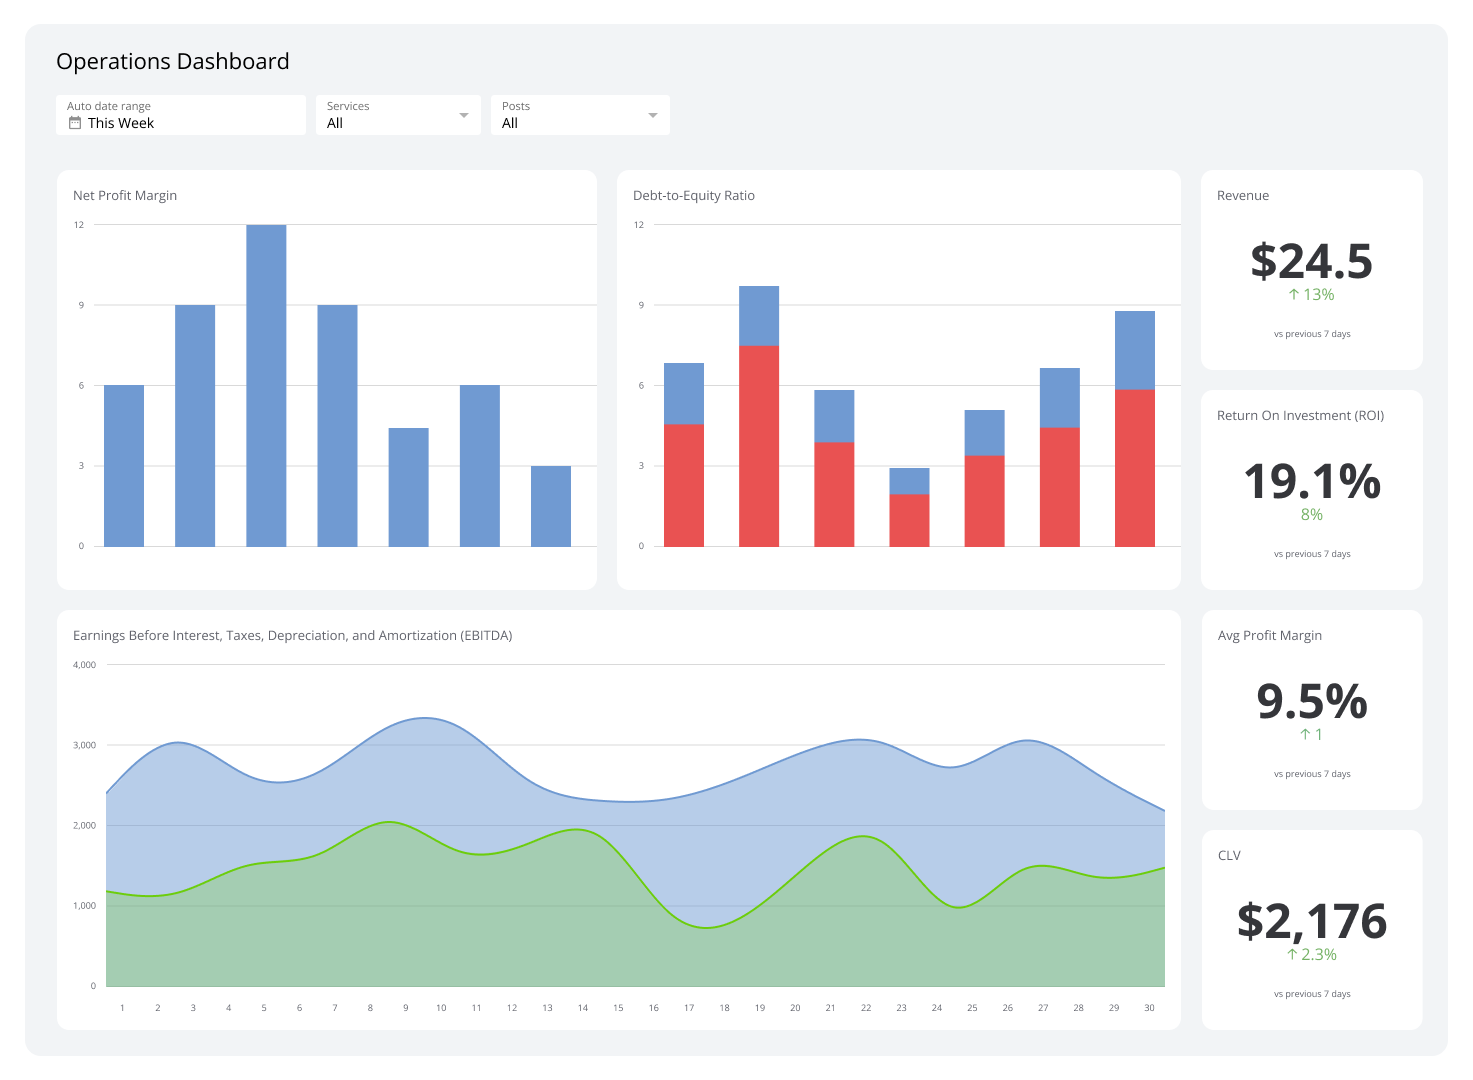
Visual elements: Charts, graphs, and tables make complex data understandable at a glance. The goal is to tell a story with your data, not just present numbers.
User-friendly interface: The design focuses on usability, enabling team members of all technical levels to navigate and interpret information easily.
Why are status dashboards important?
When data is scattered across tools and inboxes, decisions slow down and teams fall out of sync. A status dashboard solves that by consolidating everything into a single, always-current view. Here's what that delivers:
Faster, smarter decisions: By converting raw data into actionable insights, status dashboards empower your team to act with confidence and speed.
Improved efficiency: A consolidated view of multiple data sources eliminates the manual effort of collecting and combining data in spreadsheets.
Transparency and alignment: Real-time data that's accessible to everyone builds trust and gets the entire team on the same page.
Effective goal tracking: Continuous monitoring of progress toward strategic objectives keeps you on track before small issues become big ones.
Common applications for status dashboards
Status dashboards are versatile enough to serve nearly any department or industry. Here are some of the areas where they have the most impact:
IT operations: Monitor network health, server uptime, and system performance for rapid issue detection and resolution.
Marketing: Track campaign performance, website traffic, lead generation, and return on marketing investment (ROI) to sharpen strategy in real time.
Sales: Monitor sales figures, track sales opportunities, and analyze sales funnel performance to keep revenue on target.
Customer support: Track ticket resolution times, customer satisfaction scores (CSAT), and support team performance to maintain service quality.
Project management: Monitor project progress against timelines, manage resources, and keep stakeholders informed without a single status meeting.
How to build a status dashboard
Building an effective status dashboard starts with knowing what you need to track. Follow these four steps:
Define your goals. Identify the decisions the dashboard needs to support. Start with the questions your team asks most often.
Choose your metrics. Select KPIs that directly reflect progress toward those goals. Limit the dashboard to what's actionable — more metrics rarely means more clarity.
Connect your data sources. Pull data from your existing tools — CRMs, marketing platforms, support systems, cloud storage, or databases — into a single view.
Design for your audience. Tailor the layout and level of detail to whoever will use the dashboard. An executive dashboard looks different from an operations dashboard.
Klipfolio Klips gives you 130+ data connectors, Excel-like formulas for data modelling, and flexible layouts to build status dashboards that update automatically and distribute to your whole team.
Relevant KPIs and metrics
- Marketing KPIs and Metrics
- Call Center KPIs and Metrics
- Sales KPIs and Metrics
- Financial KPIs and Ratios
- Supply Chain KPIs and Metrics
- Support Desk KPIs and Metrics
At a glance
Focus Area
Real-time KPI monitoring, team alignment, and operational visibility across IT, marketing, sales, support, and project management.
Metrics List
KPIs, CSAT, ROI, sales opportunities, server uptime, ticket resolution time, website traffic, lead generation.
Reference Rate
Real-time to 24-hour refresh depending on data source and dashboard configuration.
Related Dashboards
View all dashboards