Social Media Dashboards
Monitor your social media metrics on a dashboard so you can track Facebook, Twitter, Instagram, and YouTube all in one place.
What is a social media dashboard?
A social media dashboard is a centralized platform that consolidates performance metrics from various social networks like Facebook, Twitter, and YouTube. It provides insights into engagement, follower count, and audience demographics, enabling data-driven marketing decisions.
Key features of a social dashboard include a single-view display of metrics, easy sharing with team members, and customizable visualizations based on the target audience's needs. Top metrics to track include followers, content engagement, reach, impressions, likes, comments, shares, post clicks, average video watch time, retweets, and mentions.
Why should I use a social media dashboard?
A social media dashboard displays all of your key metrics in a single view. Use your social media metrics to shape your marketing strategy, engage with your audience, increase your conversion rates, and generate revenue. Social media dashboards allow you to gain insight with a single glance and share your performance with your team so you can stay on top of your social media strategies.
How do I create a social media dashboard?
Before you start building a social media marketing dashboard, ask yourself these questions.
- Who is the audience for the marketing dashboard?
- What information do they need?
- What do they already know about the marketing metrics?
- What is their level of experience with marketing data?
- What social media channels should be included?
These questions will help you narrow the scope of your dashboard and identify the top social media marketing metrics to track.
A well-designed social media dashboard template will communicate a clear message, so create your dashboard based on your intended audience (e.g. social media managers, executives, etc.). From there, choose the right visualizations and ensure your dashboard is easy to read.
What should be on a social media dashboard?
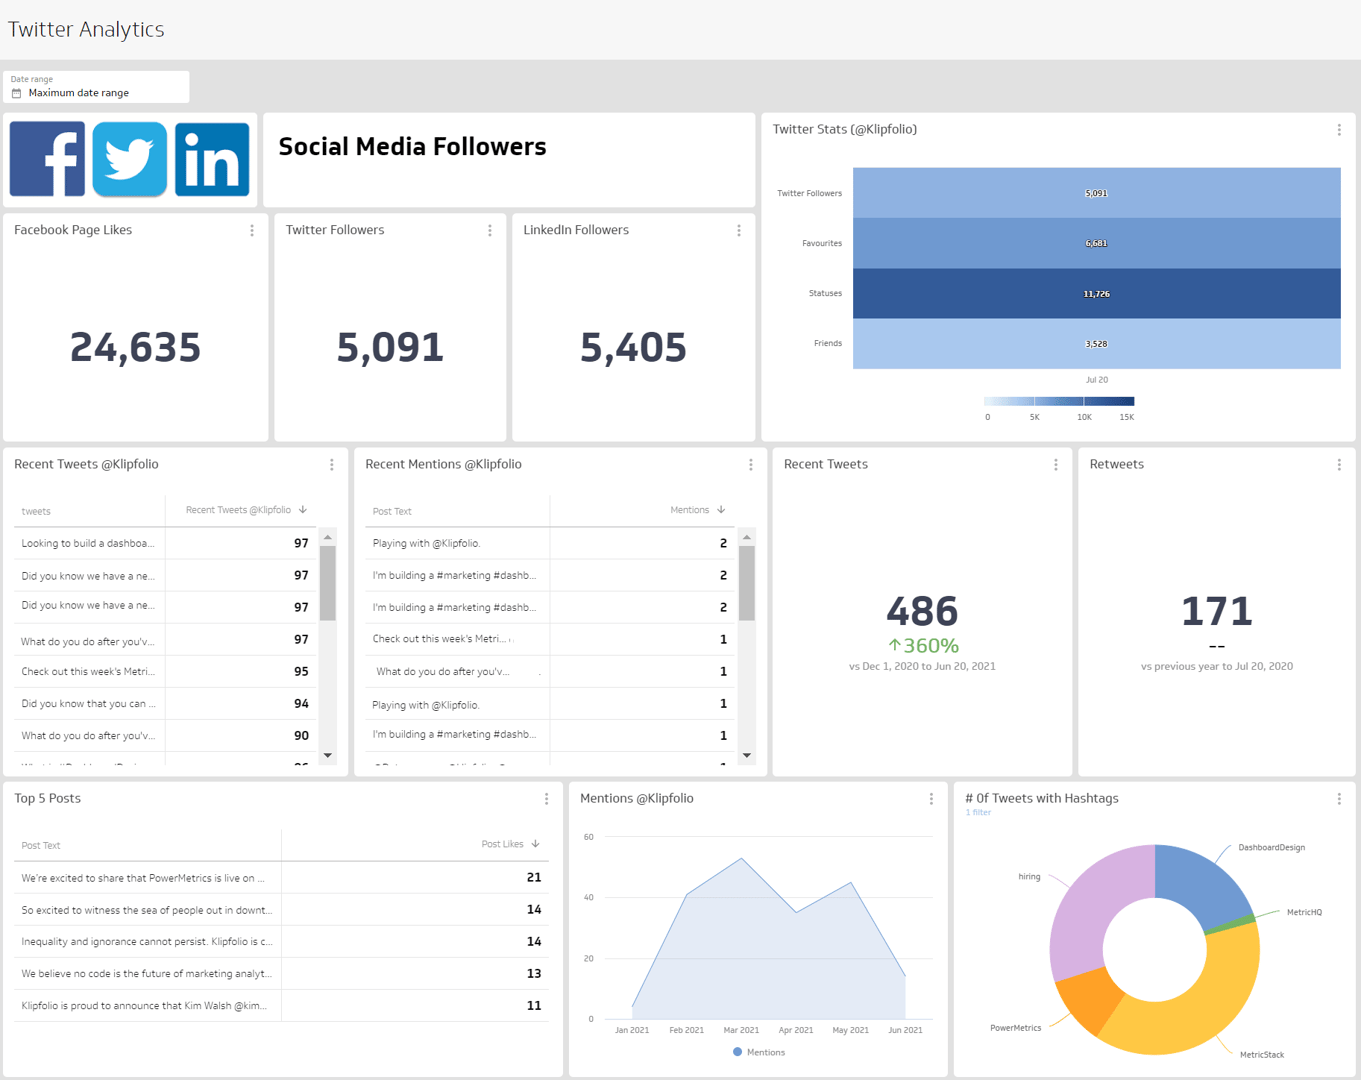
The top common social media metrics for data-driven marketers include:
- Followers
- Content Engagement
- Reach
- Impressions
- Likes, Comments, and Shares
- Post Clicks
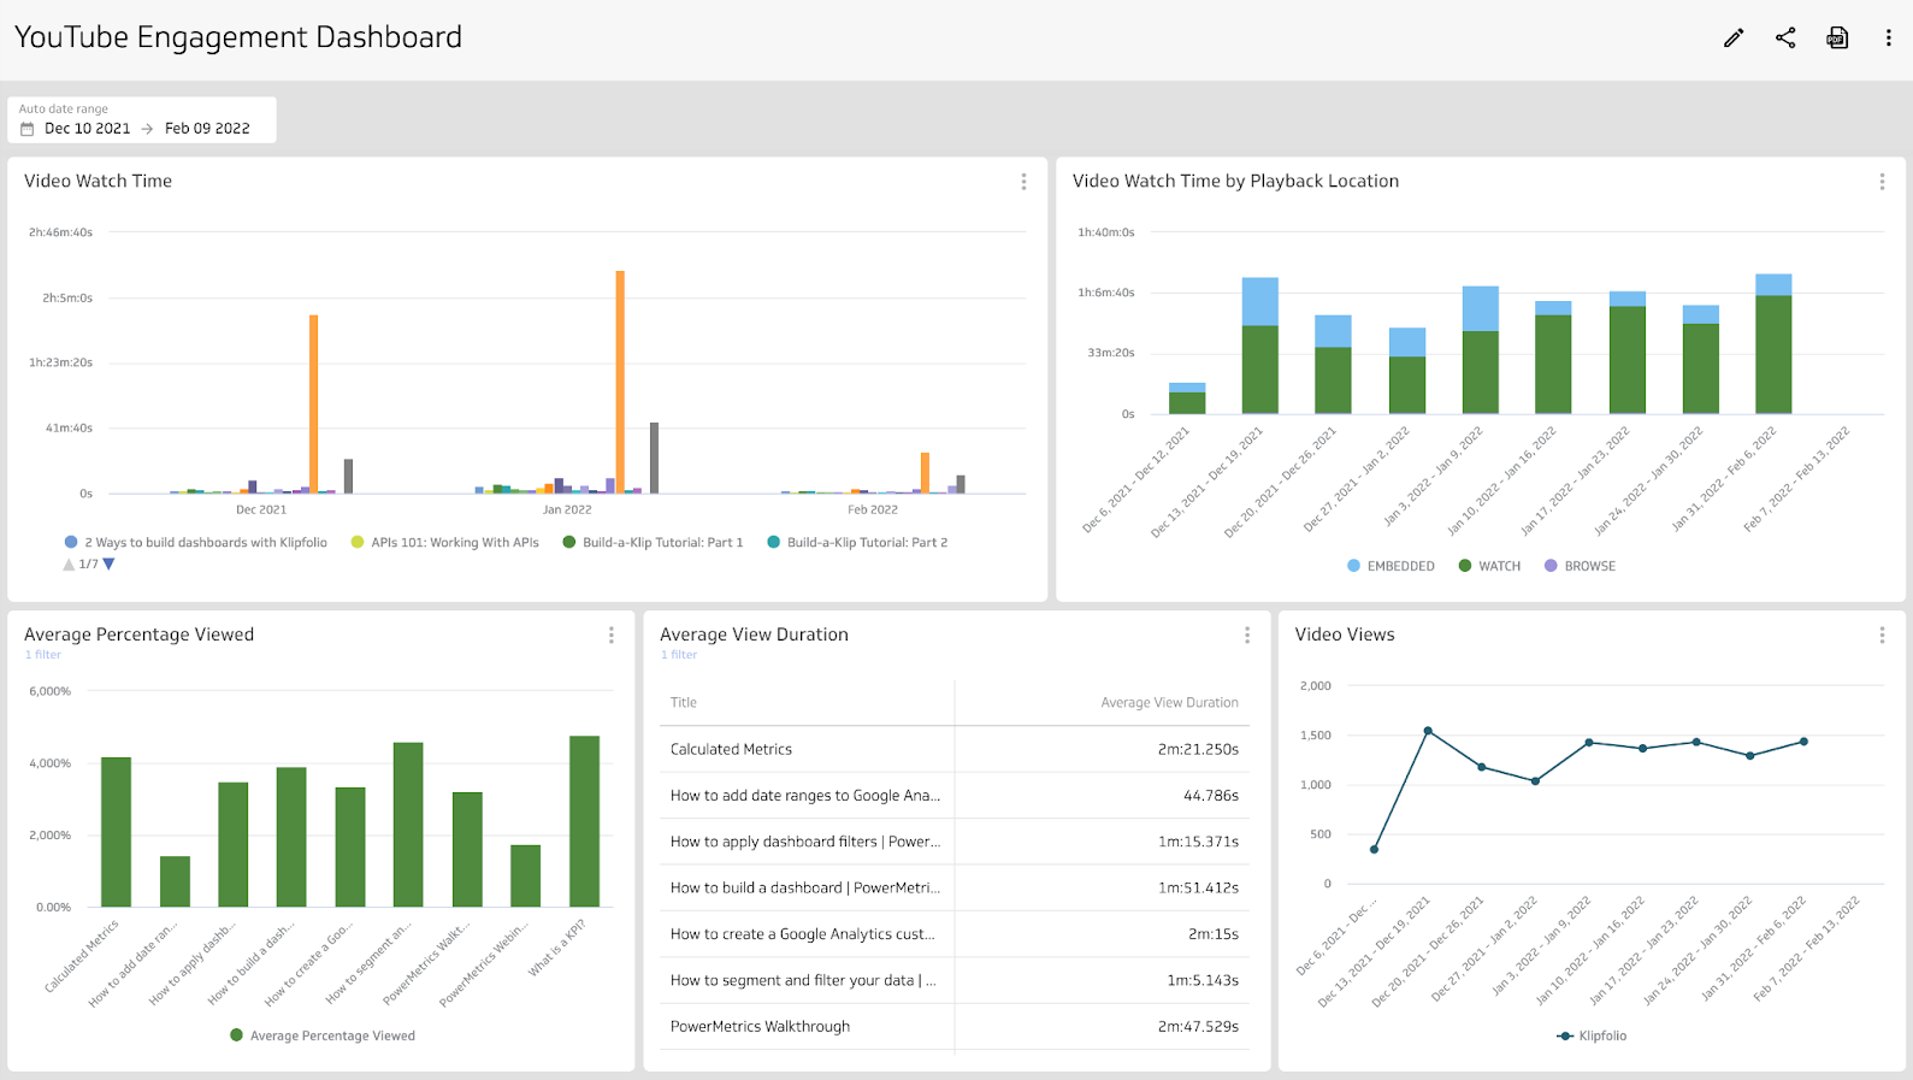
- Average Video Watch Time
- Retweets and Mentions
Make Your Dashboard Better
Add these features for a better dashboard:
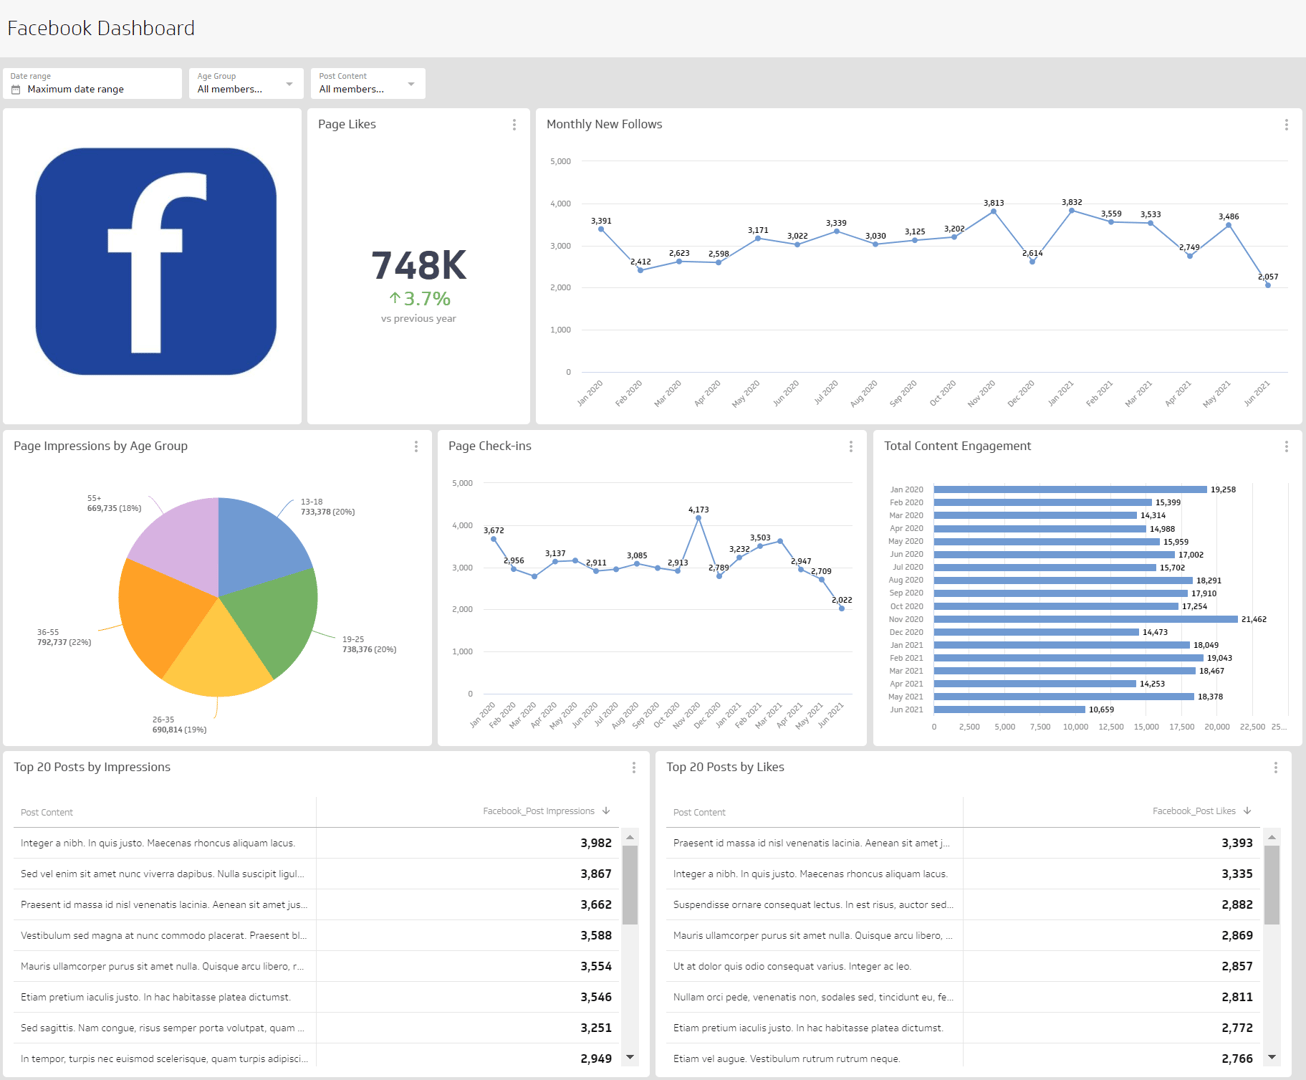
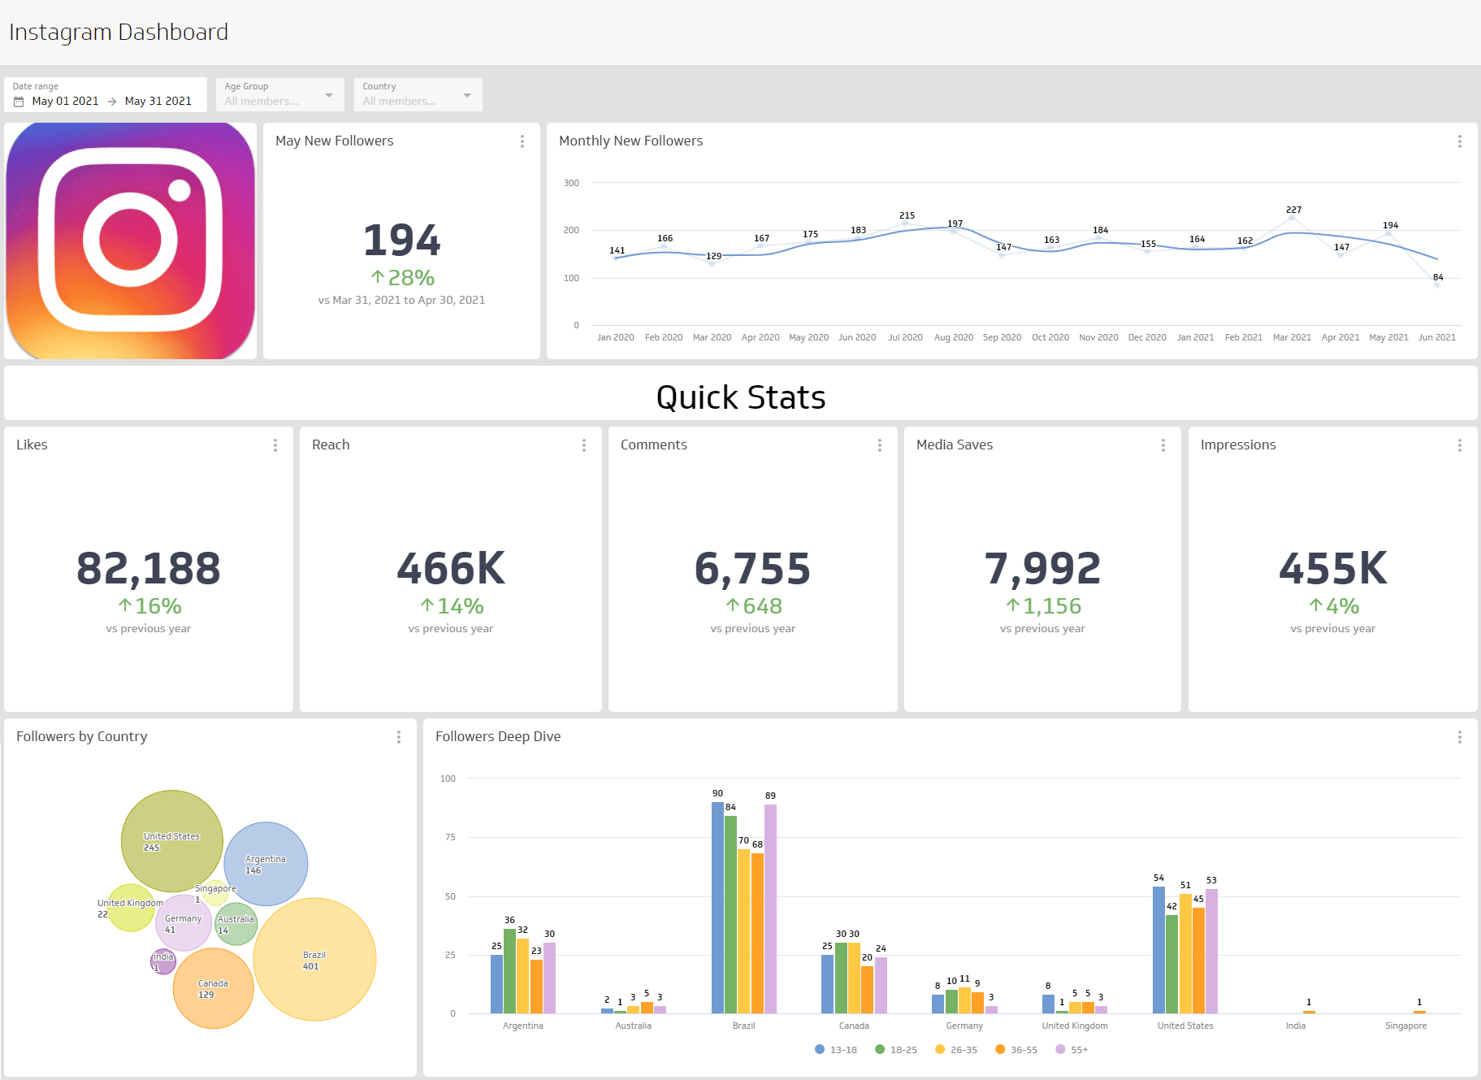
- Connect More Social Media Platforms: Link your dashboard to platforms like Instagram, LinkedIn, Pinterest, TikTok, Facebook, Twitter, YouTube, and Google Analytics data. This helps you handle all your social media data from all channels in one spot.
- Plan and Schedule Social Media Posts: Use scheduling tools and a content calendar. This helps you plan and share content easily. A content calendar shows when you'll post, keeping your audience interested and managing campaigns better.
- Watch Social Media and Feelings: Use tools to analyze data, listen to online chats and find trends. This helps you learn what people think, track your brand, and answer customers fast. It can make your brand look better and make customers happy.
- Look at Competitors: Watch your competitors' social media accounts. This helps you find trends, compare your results, and plan to do better than your competition.
- Make and Share Reports: Create custom reports and share them. Pick formats like PDF, CSV, or PowerPoint to help your audience understand and use the information.
- Work as a Team: Add communication and project tools to your dashboard. This helps your social media team work together, share tasks, and track progress, making sure your social media campaigns run well.
In short, a good dashboard should give you helpful data and features to manage content, watch online chats, and look at competitors. By adding these features, you'll make smarter choices and boost your social media performance plan.
Social Media Dashboard Examples
View all dashboard examples- Social Media
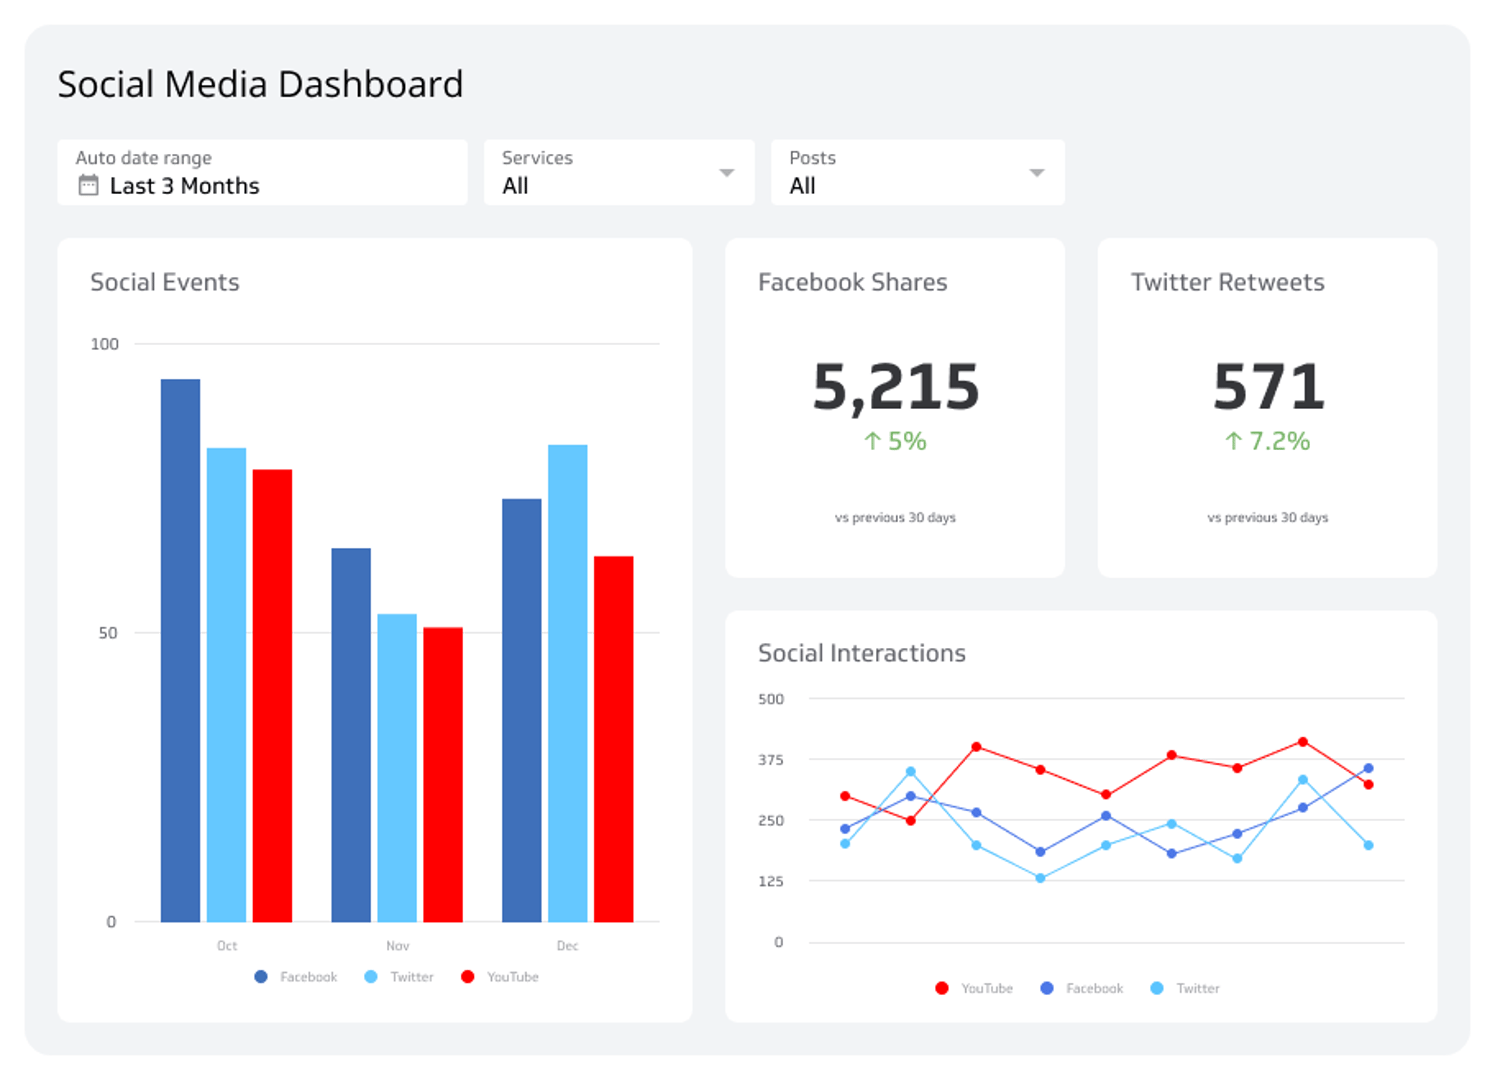
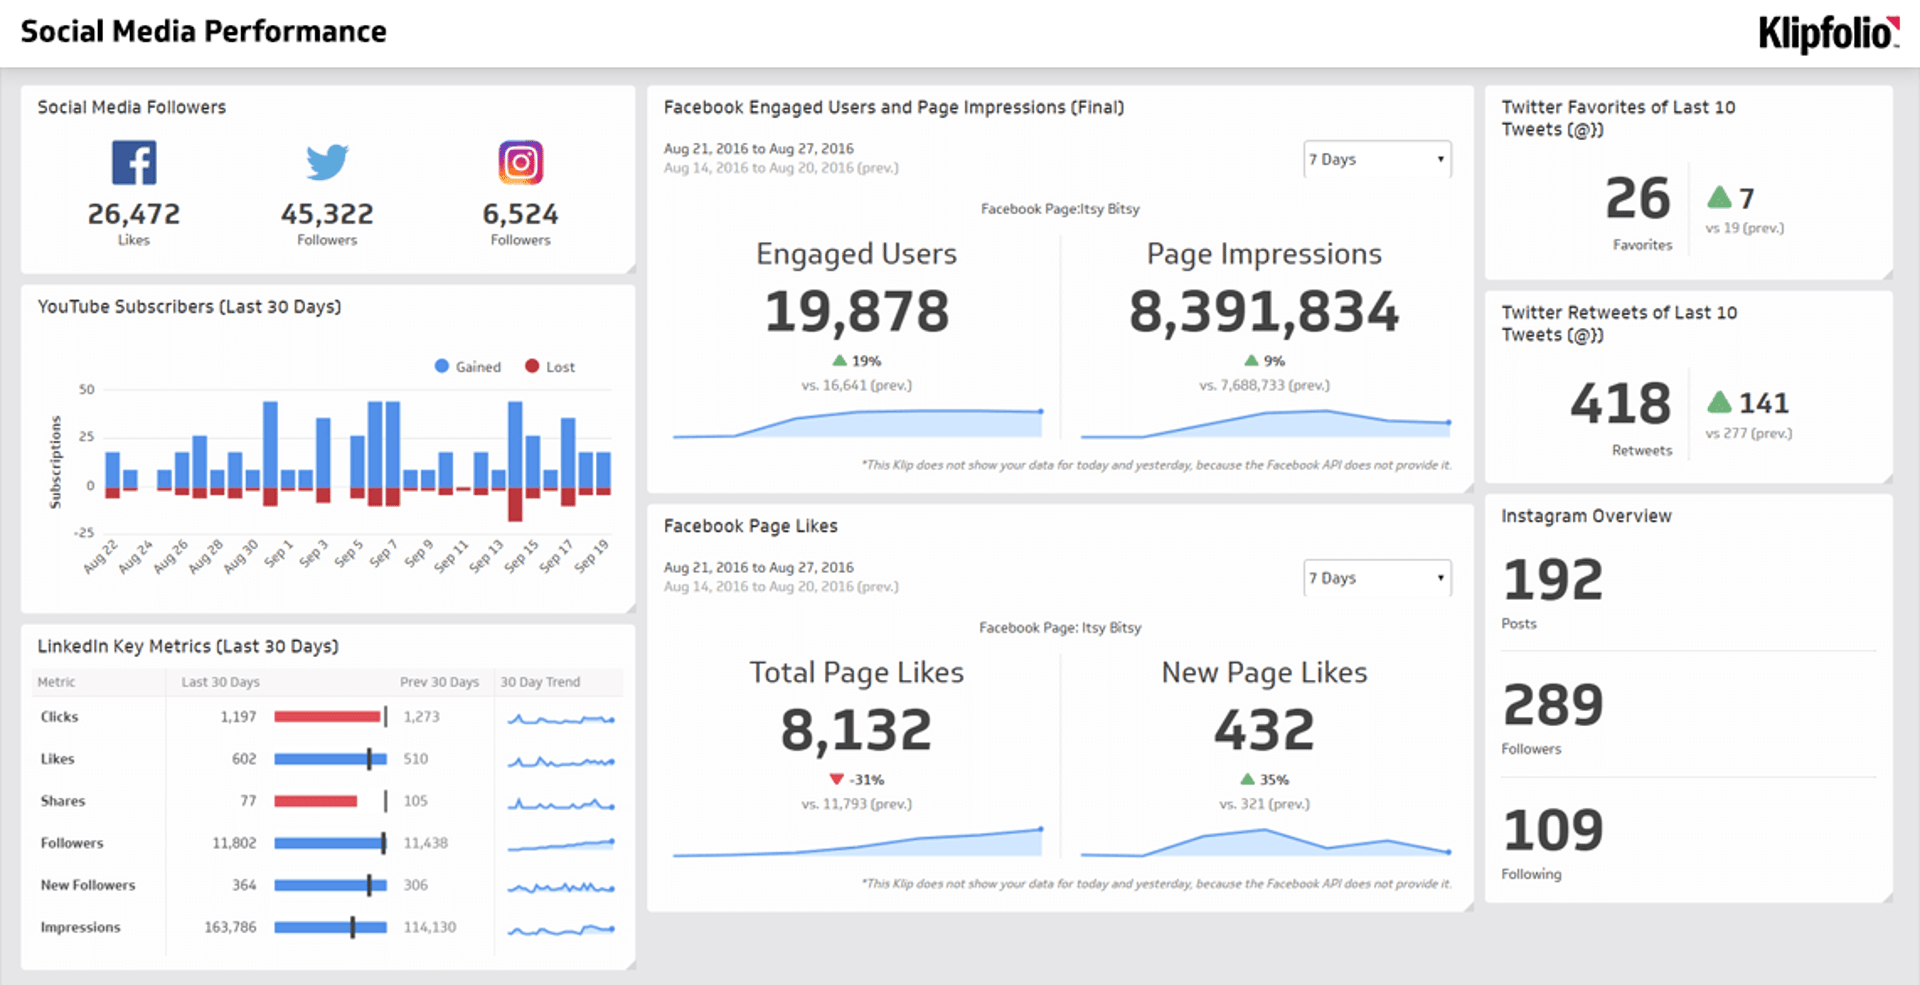
Social Media Performance Dashboard
Tired of juggling data from Facebook, X, LinkedIn, and Instagram? A social media performance dashboard centralizes all your key metrics in one real-time view. This guide covers which KPIs to track, how to build your dashboard, and what to include so you can make faster, more confident marketing decisions.
- Social Media
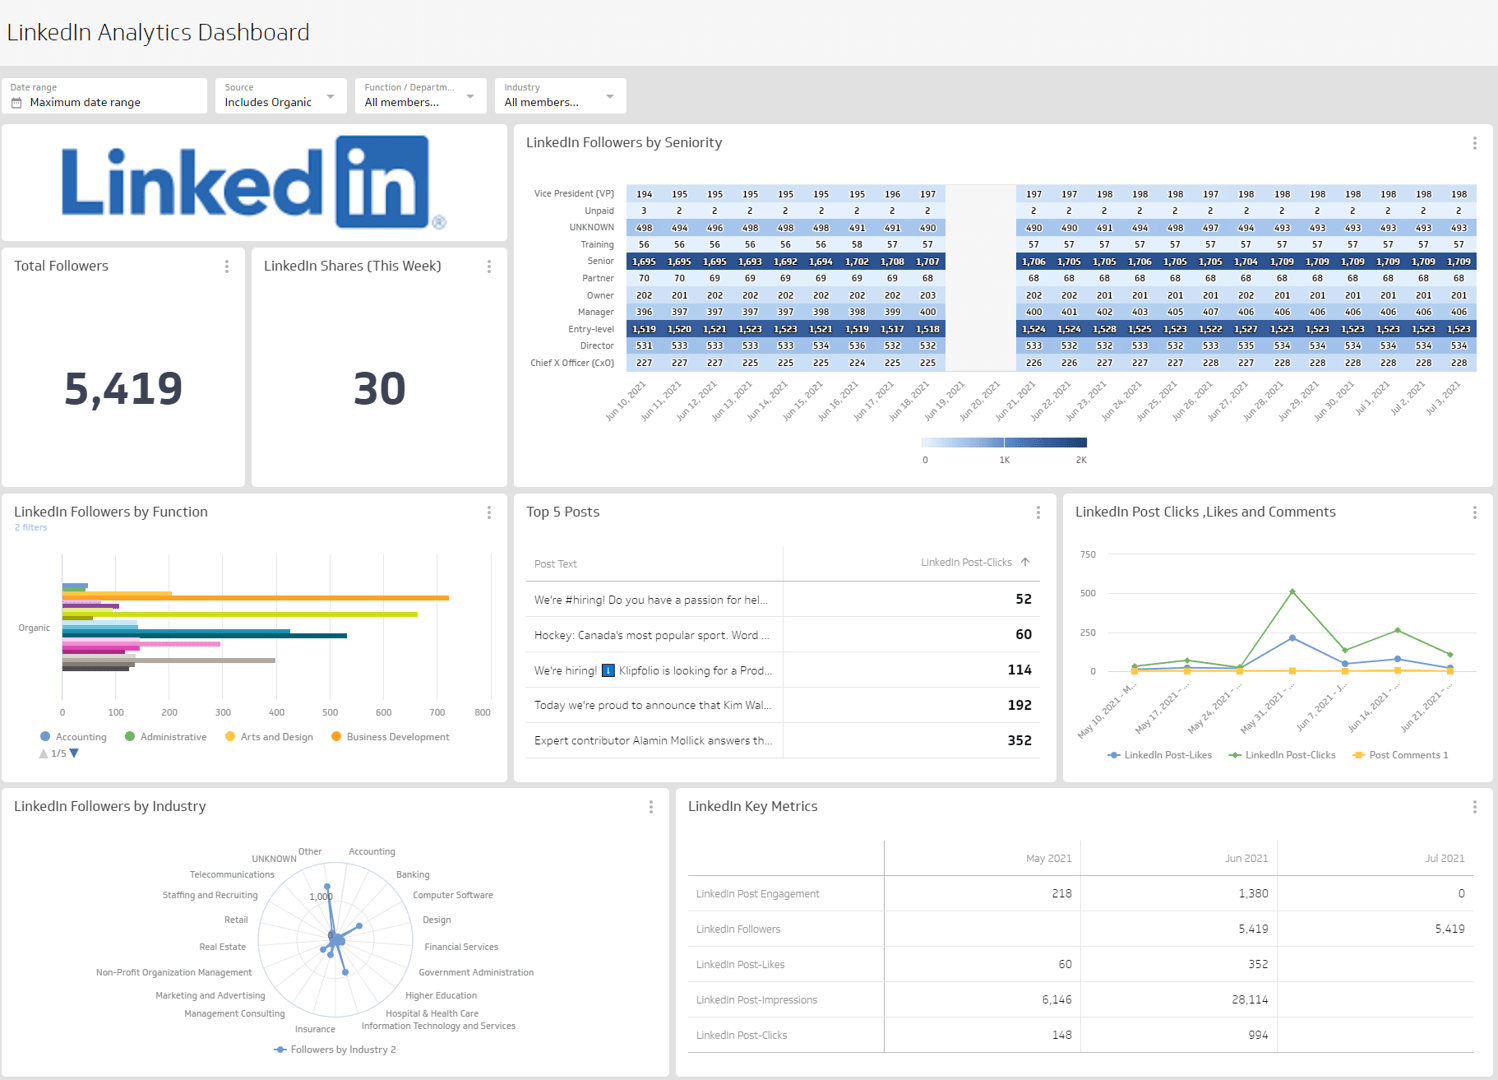
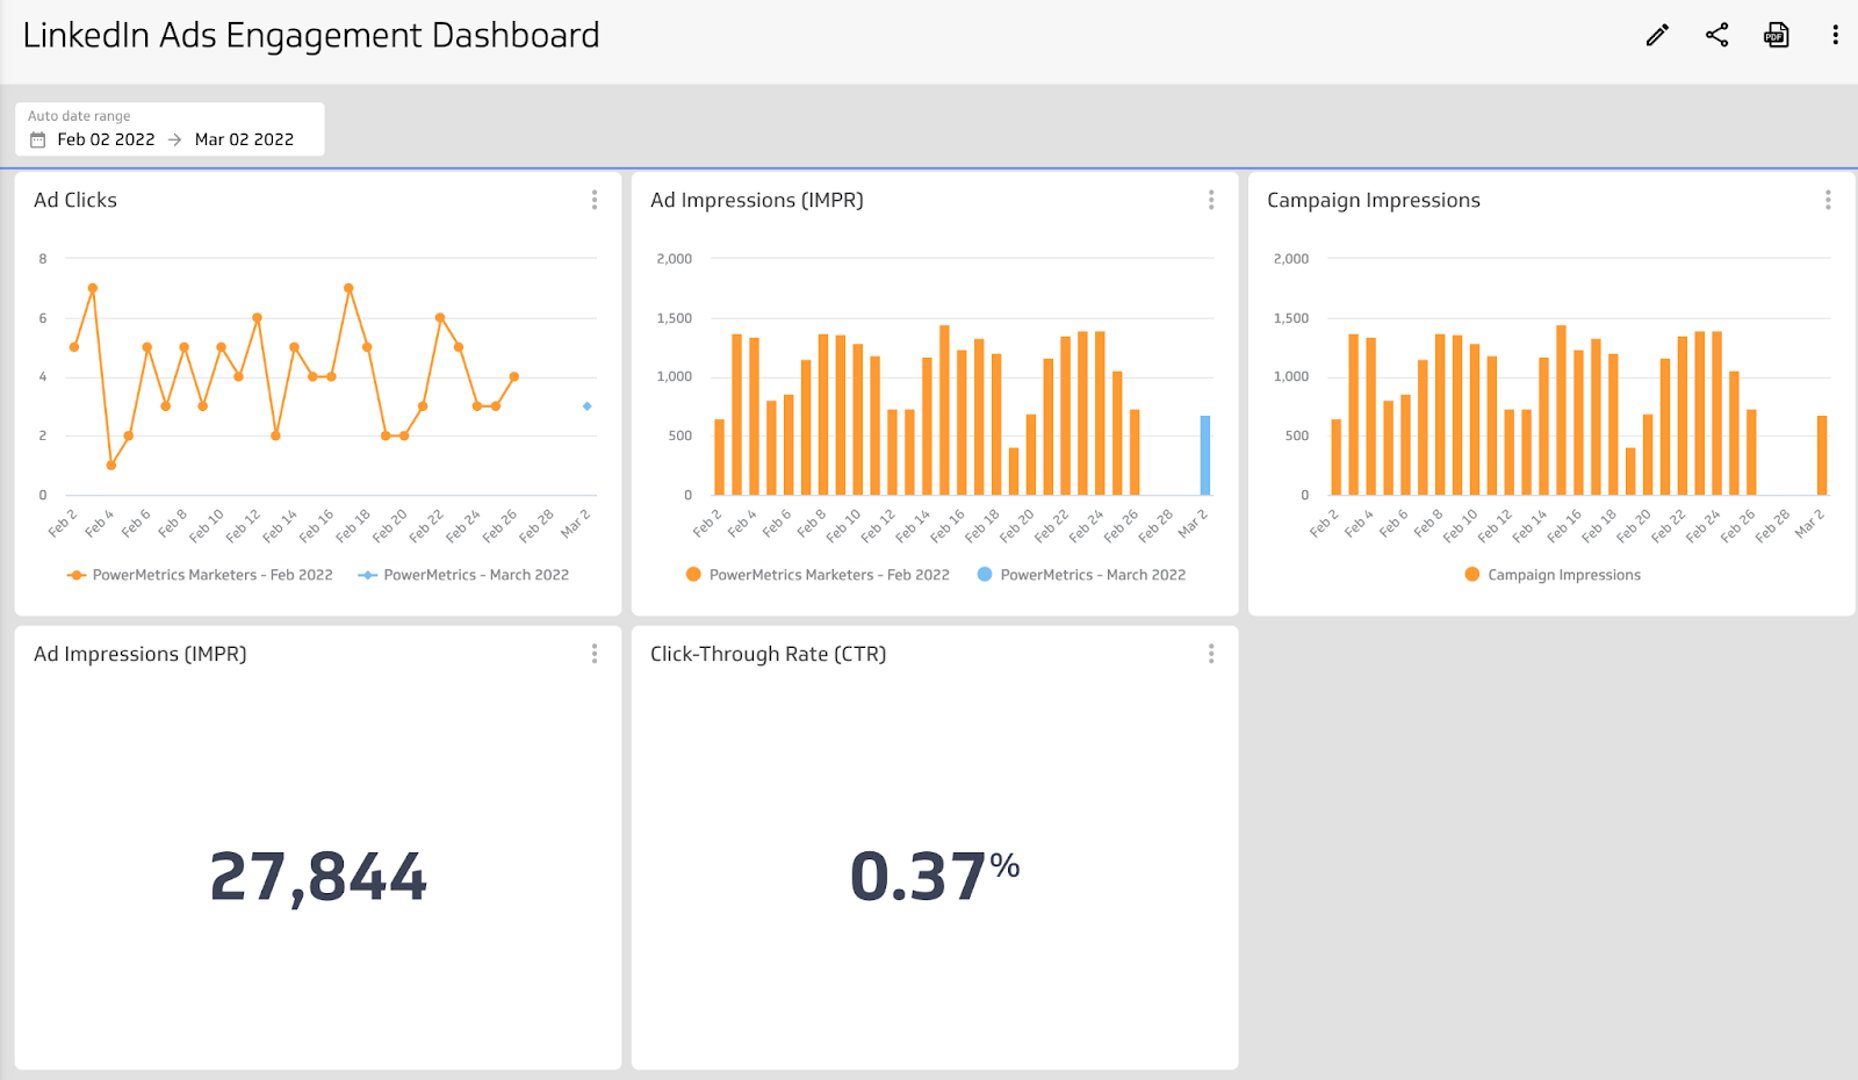
LinkedIn Ads Dashboard
A LinkedIn Ads dashboard brings your key paid social metrics into one view. This guide covers the top KPIs to track, the best visualizations to use, and dashboard examples for performance, budget, and engagement — so you can make smarter decisions about your ad spend.
- Social Media
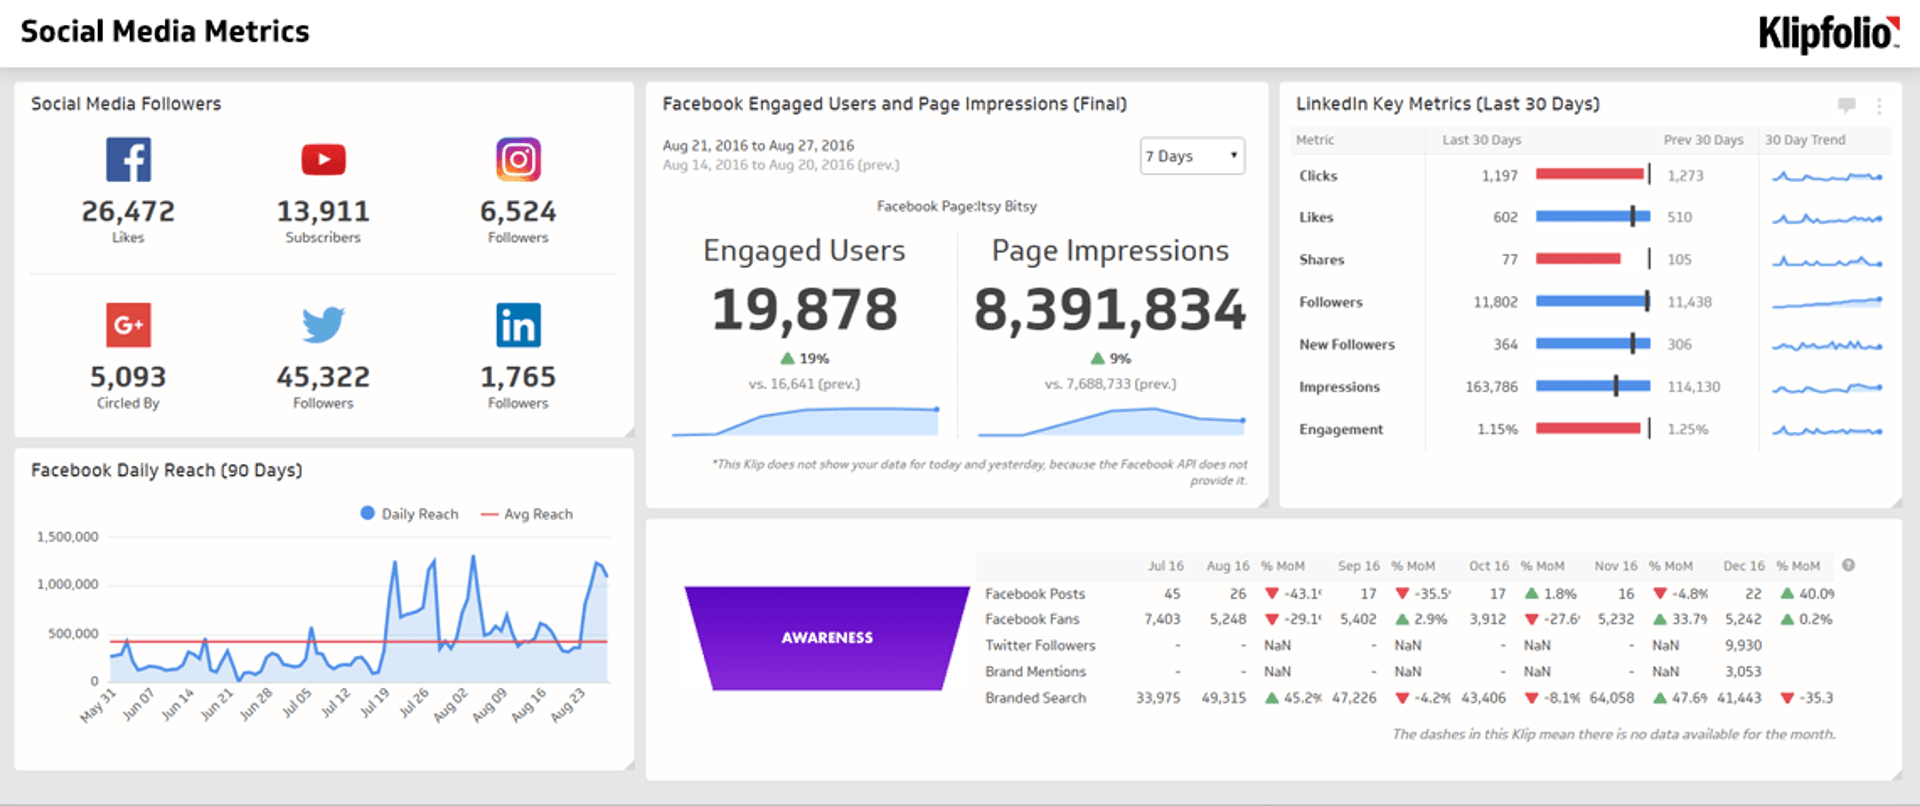
Social Media Metrics Dashboard
Manually pulling reports from every social platform wastes time. A social media metrics dashboard unifies all your metrics into one central view so you can compare performance across channels, analyze user demographics to sharpen your targeting, and track social media ROI — without logging into each platform separately.
- Social Media
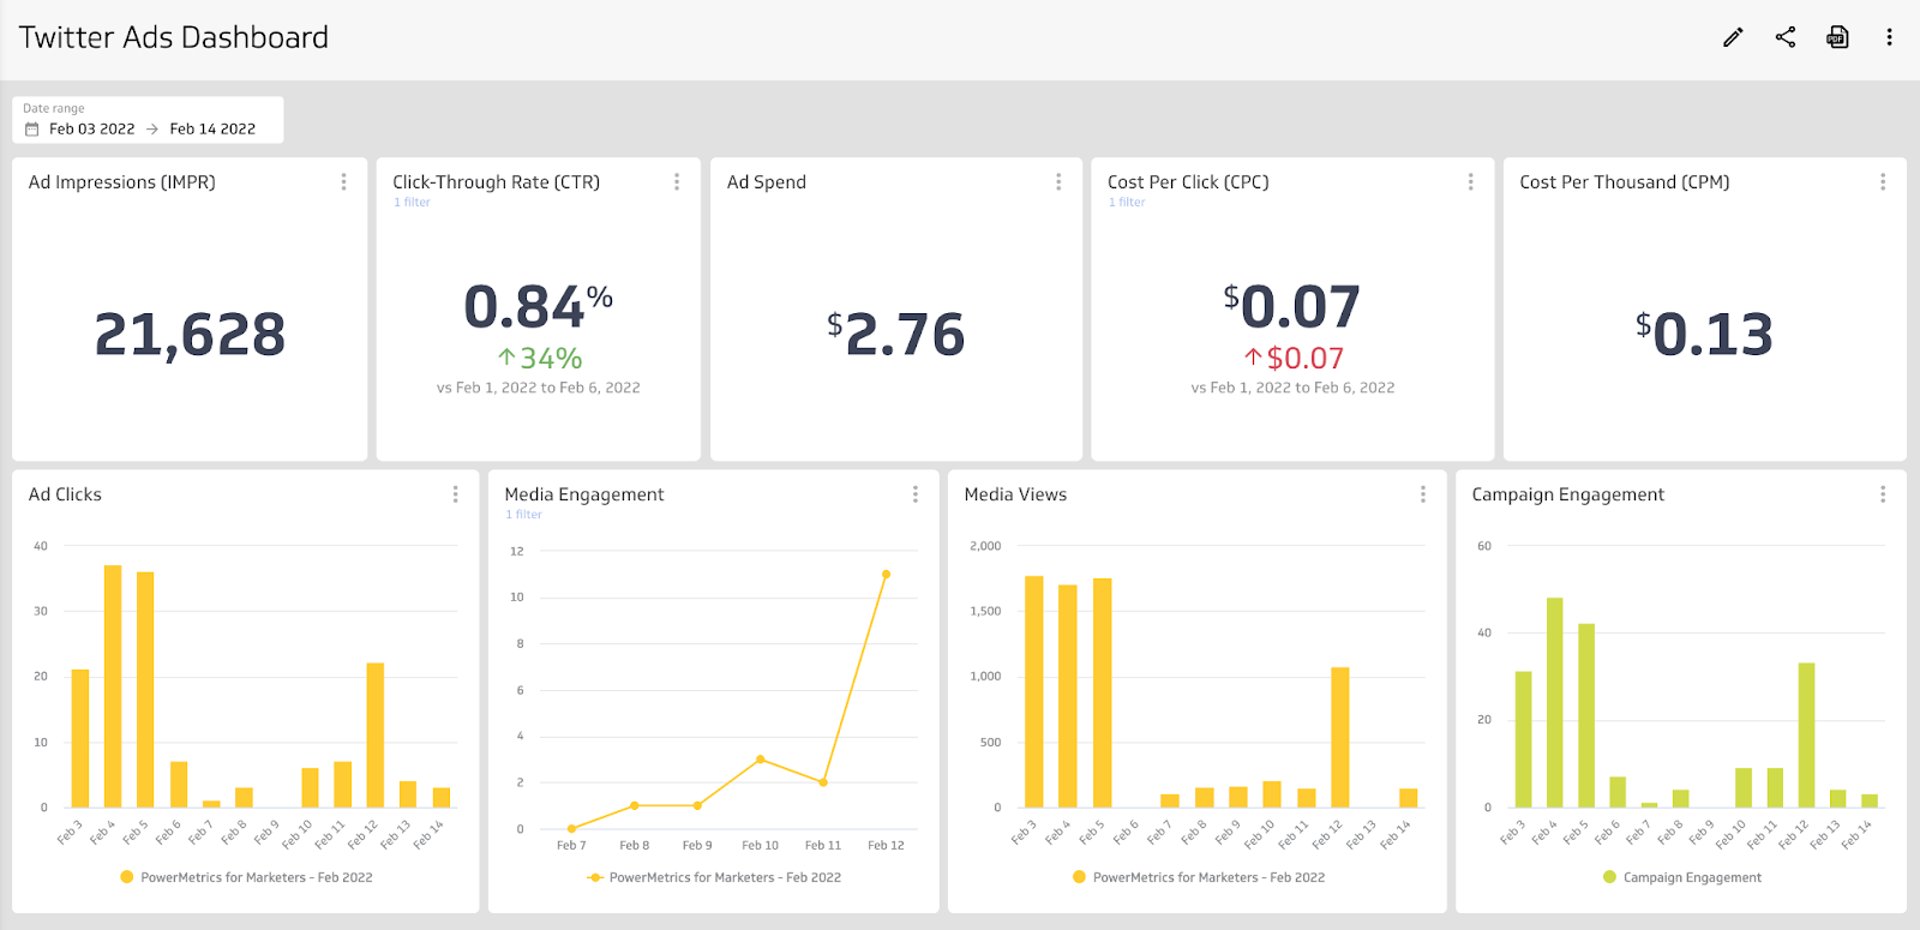
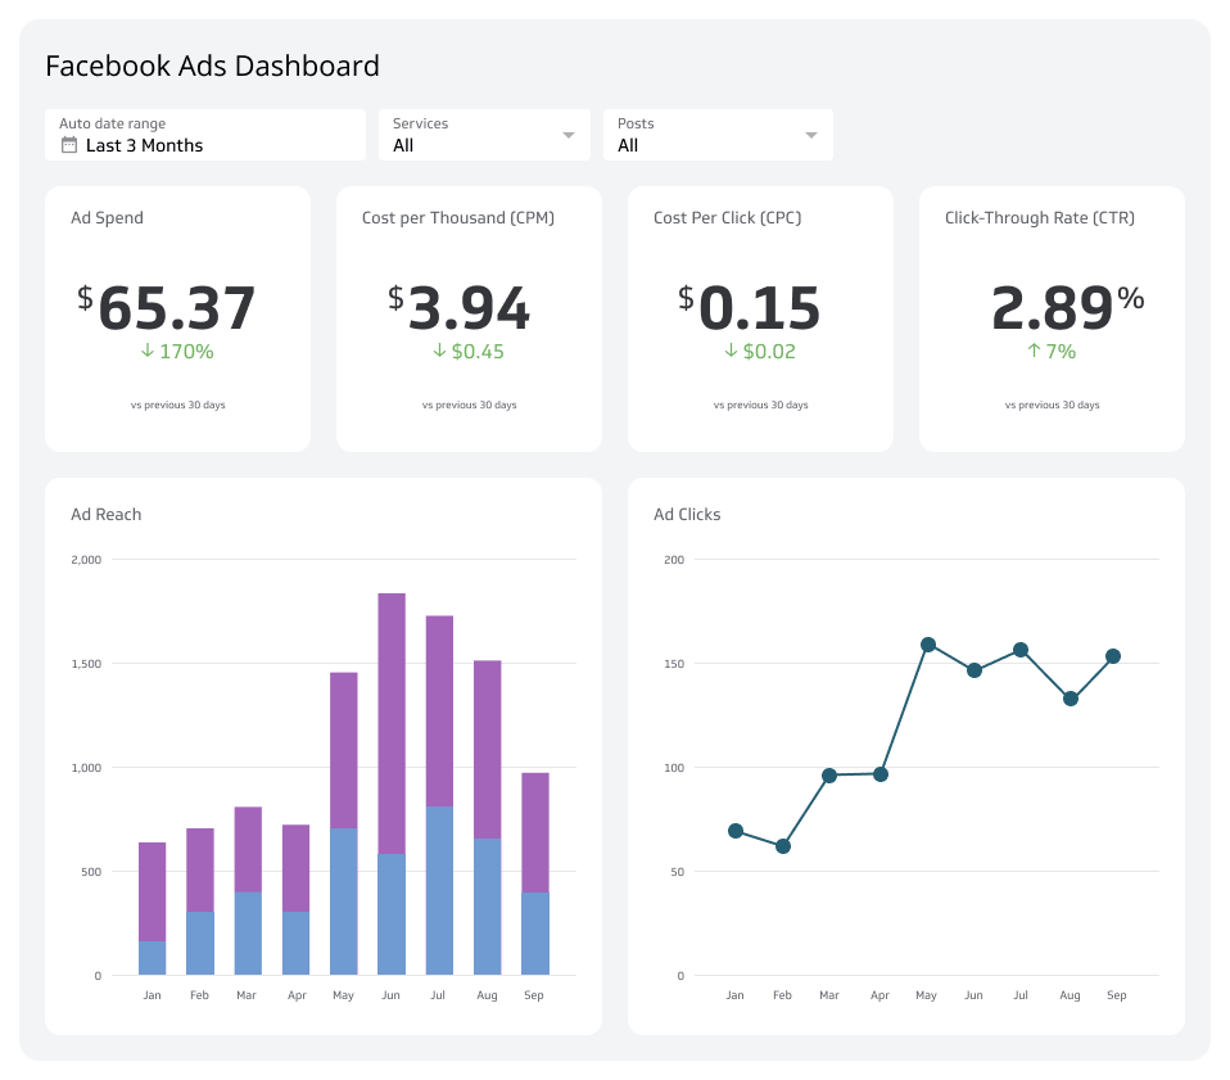
X (Twitter) Ads Dashboard
Stop guessing about your paid social media ROI. This article explains which X Ads KPIs — like Ad Spend, CTR, and CPM — are essential for your dashboard. Learn how to visualize your data to track performance, monitor engagement, and keep your ad budget on target, ensuring your entire team is aligned on your strategy.