Manufacturing Dashboard
Track production, quality, and inventory with live manufacturing KPIs.
What is a Manufacturing Dashboard?
A manufacturing dashboard gives you a live view of production, quality, and inventory. It pulls data from your systems, spreadsheets, and databases, then presents it as clear charts and tables.
Use it to catch issues early, like rising scrap or unexpected downtime, and to keep lines, materials, and people in sync.
Because you can see how production rates connect to inventory levels, you can adjust schedules to meet demand without overstocking or starving key work centres.
Examples of Manufacturing Dashboards
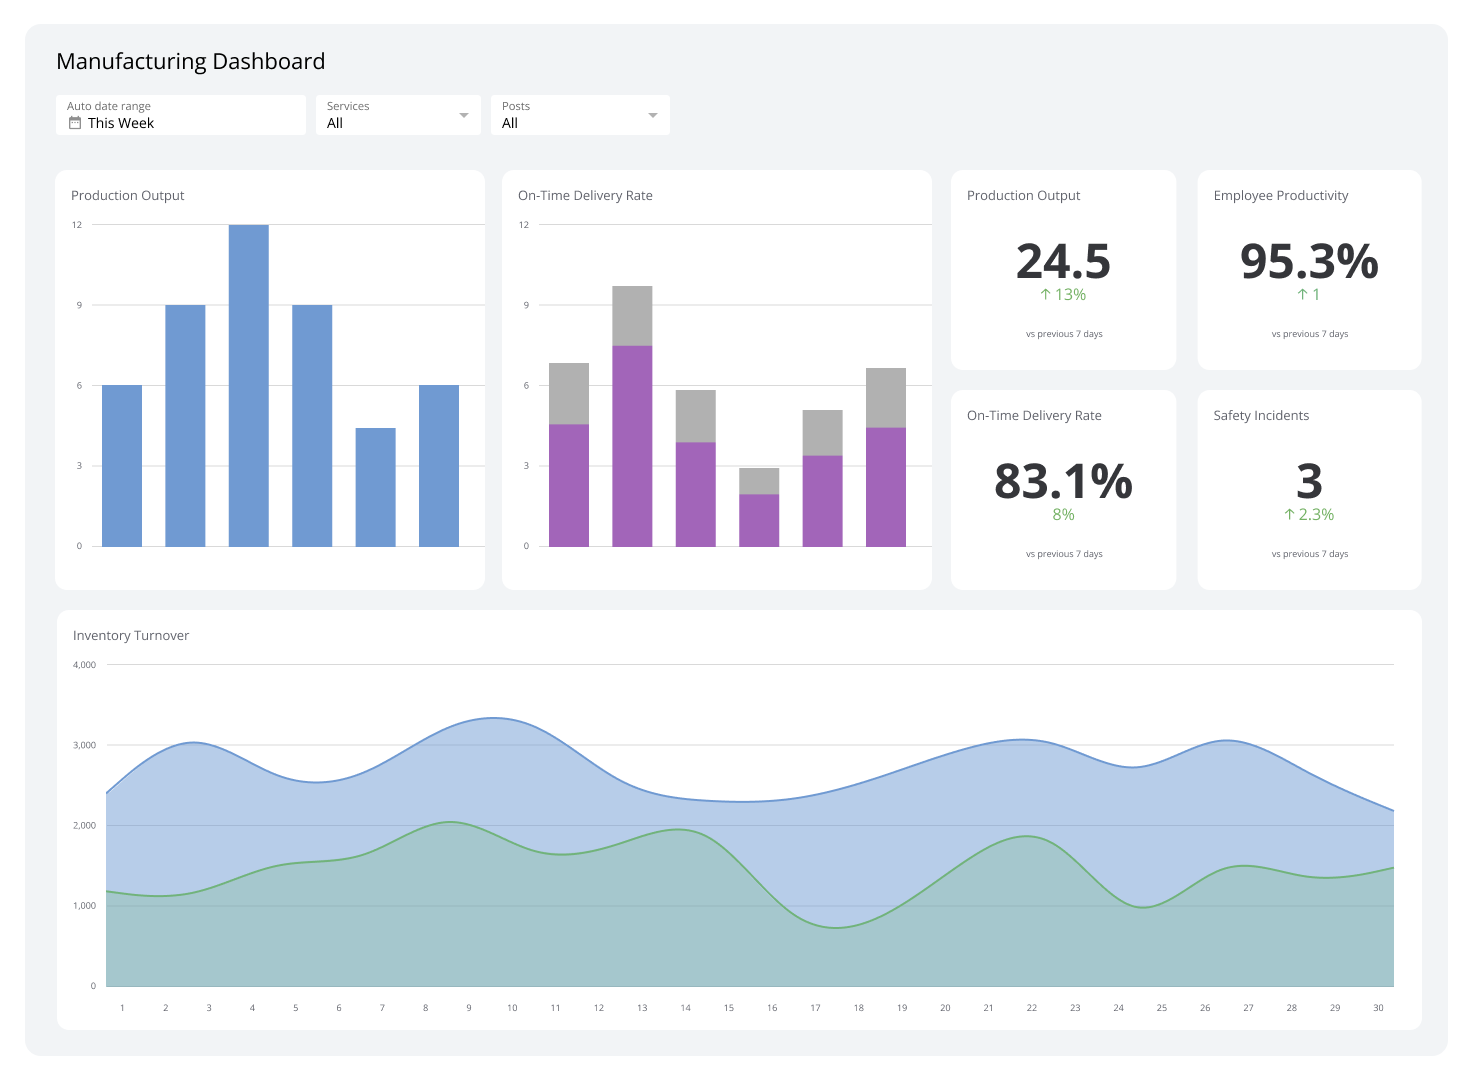
Operational Overview Dashboard
Operational overview dashboards give you a full picture of your manufacturing operations. They deliver figures on metrics like production output, inventory turnover, defect rates, and cycle times, which makes it easier to assess the health of your production.
These dashboards can also help you measure worker performance through KPIs like employee productivity scores. They help you maintain an efficient workforce that makes the most of funds, equipment, materials, and other resources.
Who’s it for | Department managers, team leaders, operations directors, project managers, supply chain managers, production supervisors, quality control managers, IT managers, customer service managers, logistics coordinators |
How often it's needed | Real-time, hourly, daily, weekly |
Covered KPIs | Production output, cycle time, on-time delivery rate, inventory turnover, equipment utilization, defect rate, employee productivity, perfect order rate, customer support ticket resolution time, average handling time, resource utilization, capacity utilization, throughput, lead time, downtime, safety incidents, process efficiency, service level agreement (SLA) compliance, mean time between failures (MTBF), mean time to repair (MTTR), first-pass yield, overall equipment effectiveness (OEE), work in progress (WIP) |
Overall Equipment Effectiveness (OEE) Dashboard
An overall equipment effectiveness (OEE) dashboard helps you evaluate equipment and process efficiency. It displays metrics related to performance, availability, and quality, the three building blocks of OEE.
For example, it can show a line with high availability but low performance so you can investigate speed or throughput issues.
Who’s it for | Production managers, plant managers, maintenance supervisors, quality control managers, continuous improvement specialists, operations directors, manufacturing engineers, lean practitioners, equipment operators, shift supervisors |
How often it's needed | Real-time, hourly, daily, weekly, monthly |
Covered KPIs | Overall OEE percentage, availability rate, performance rate, quality rate, planned production time, run time, ideal cycle time, actual production count, good parts produced, total parts produced, MTBF, MTTR, setup time, changeover time, scrap rate, rework rate, first pass yield, equipment downtime, speed losses, minor stops, idling time, production losses, quality losses, production efficiency, capacity utilization, throughput rate, yield rate |
Daily Production Dashboard
A daily production dashboard visualizes the daily output and performance of your factories. Standard metrics include daily production output, units per hour, and machine uptime.
It also shows labour efficiency metrics like labour hours per unit produced so you can assess productivity.
Who’s it for | Production supervisors, shift managers, plant managers, quality control inspectors, maintenance technicians, operations managers, production planners, team leaders, floor workers, department heads |
How often it's needed | Real-time, hourly, shift-wise, daily |
Covered KPIs | Daily production output, units produced per hour, on-time delivery rate, defect rate, scrap rate, machine uptime, downtime reasons, production line efficiency, labour productivity, WIP inventory, first pass yield, cycle time, changeover time, production schedule adherence, quality control metrics, equipment effectiveness, material consumption, energy usage, safety incidents, production line utilization, throughput rate, takt time, batch completion time, overtime hours, production backlog, machine breakdown frequency, product yield, production cost per unit, inventory turnover, production volume variance |
Room/Asset Availability Dashboard
A room or asset availability dashboard supplies live insights about the occupancy and availability of spaces and resources. Scheduling, booking, and time management become straightforward.
This dashboard typically presents a live, colour?coded view of rooms, equipment, or other assets so you can see what is available, in use, or reserved.
Who’s it for | Facility managers, operations managers, office administrators, IT managers, event coordinators, department heads, space planners, resource schedulers, maintenance staff, employees booking rooms or assets |
How often it's needed | Real-time, hourly, daily, weekly |
Covered KPIs | Room occupancy rate, asset utilization rate, booking frequency, average booking duration, peak usage times, room turnover rate, asset downtime, maintenance schedule adherence, booking lead time, no-show rate, double-booking incidents, most requested rooms/assets, least used rooms/assets, capacity vs. actual usage, energy consumption per room, cleaning/setup time between bookings, user satisfaction rating, equipment malfunction frequency, cost per use, revenue generated, advance booking percentage, last-minute cancellation rate, resource conflicts resolved, average request processing time, asset lifecycle stage, space utilization by department, booking system uptime, accessibility compliance rate |
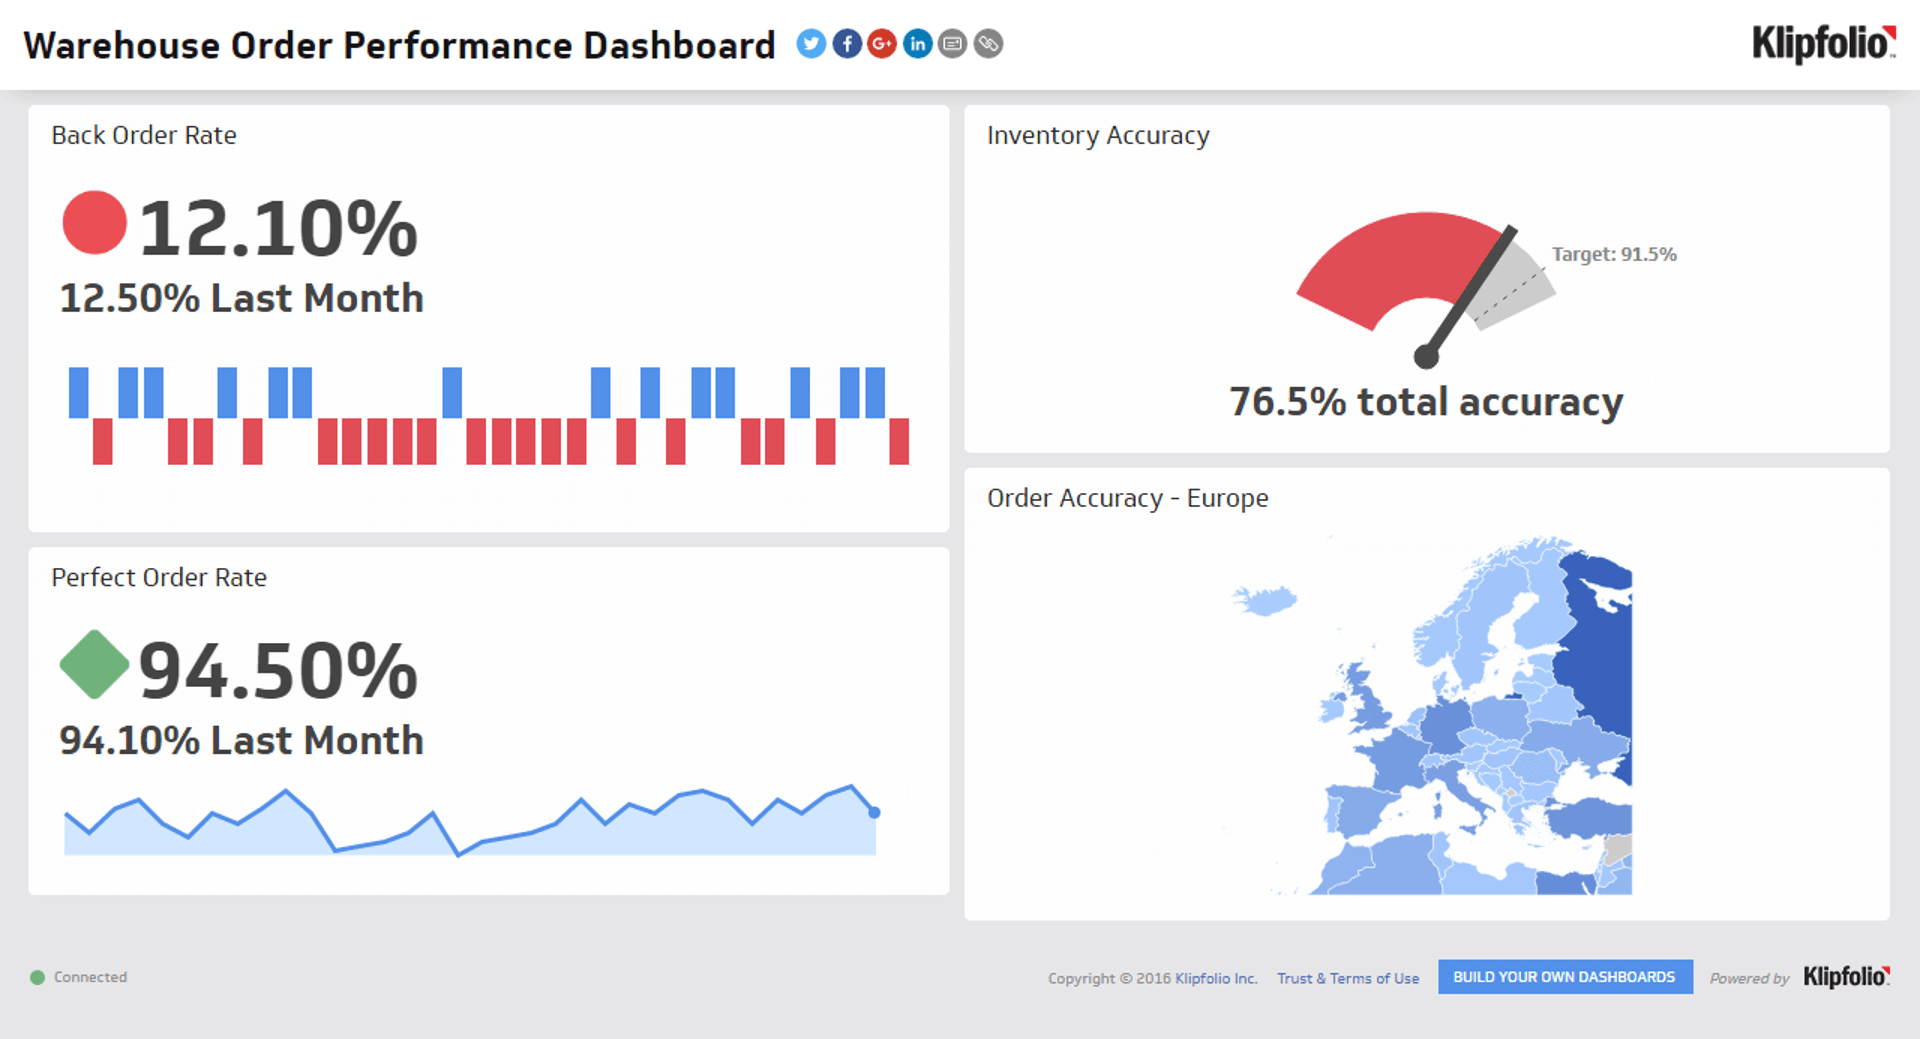
Inventory Management Dashboard
Inventory management dashboards give you a hands-on look at stock levels, storage capacity, and product movements. They usually display inventory counts, turnover rates, and reorder points for products and categories.
These dashboards highlight high and low?stock areas in your warehouses.
It also includes alerts for low stock, upcoming expiries, or slow?moving items. That helps you prevent overstocking, understocking, poor space use, and stock?outs before they become critical.
Who’s it for | Inventory managers, supply chain managers, procurement officers, warehouse managers, operations executives, finance managers, production planners, logistics coordinators, retail managers, e?commerce managers |
How often it's needed | Real-time, daily, weekly, monthly |
Covered KPIs | Inventory turnover ratio, days sales of inventory (DSI), stock?out rate, carrying cost of inventory, inventory accuracy, order fulfillment rate, supplier lead time, reorder point, economic order quantity (EOQ), inventory shrinkage, slow?moving inventory percentage, dead stock value, inventory to sales ratio, perfect order rate, average days to sell inventory, inventory write?offs, safety stock levels, cycle count accuracy, on?time delivery rate, backorder rate, inventory aging, gross margin return on investment (GMROI), inventory velocity, stockout costs, inventory forecast accuracy, supplier performance score, average inventory, inventory holding cost as a percentage of sales, inventory?to?assets ratio, inventory obsolescence rate |
Operator Performance Dashboard
Operator performance dashboards simplify monitoring individual and team productivity. They show picking speed, average handling time, units per hour, and order fulfillment time.
You can quickly identify top performers and spot bottlenecks, accuracy issues, or teams falling behind targets.
Who’s it for | Operations managers, shift supervisors, production managers, quality control managers, human resources managers, plant managers, team leaders, performance improvement specialists, training coordinators, workforce planners |
How often it's needed | Real-time, daily, weekly, monthly |
Covered KPIs | Productivity rate, efficiency ratio, quality score, goal completion rate, error rate, downtime percentage, units per hour, average handling time, first?pass yield, equipment utilization rate, safety incident rate, absenteeism rate, overtime hours, compliance score, customer satisfaction rating, cycle time, standard hours earned, rework rate, cost per unit produced, skills competency level, training completion rate, adherence to schedule, average response time, number of units processed, defect rate, machine setup time, changeover time, OEE, throughput rate, scrap rate, average time between failures, MTTR, labour cost per unit, energy efficiency ratio, material waste percentage |
Quality Control Dashboard
A quality control dashboard gives you a deeper look into product quality. It shows defect rates per batch, returns, inspection pass or fail, and time between quality incidents.
If defects spike on a line, you can investigate the cause, whether machine issues, operator error, or raw material problems.
Who’s it for | Quality control managers, production managers, operations directors, plant managers, process engineers, continuous improvement specialists, compliance officers, supply chain managers, R&D teams, customer service managers |
How often it's needed | Real-time, hourly, daily, weekly, monthly |
Covered KPIs | Defect rate, first pass yield, scrap rate, product returns, on?time delivery rate, process capability index (Cpk), OEE, MTBF, MTTR, cost of poor quality (COPQ), supplier quality rating, inspection pass rate, rework rate, compliance rate, customer satisfaction score, six sigma level, total quality costs, number of non?conformances, audit findings, corrective action efficiency, training completion rate, calibration compliance, shelf life adherence, batch release time, yield by process step, packaging quality score, raw material quality rating, in?process checks pass rate, final testing results, traceability compliance, environmental quality metrics, safety incident rate related to quality issues |
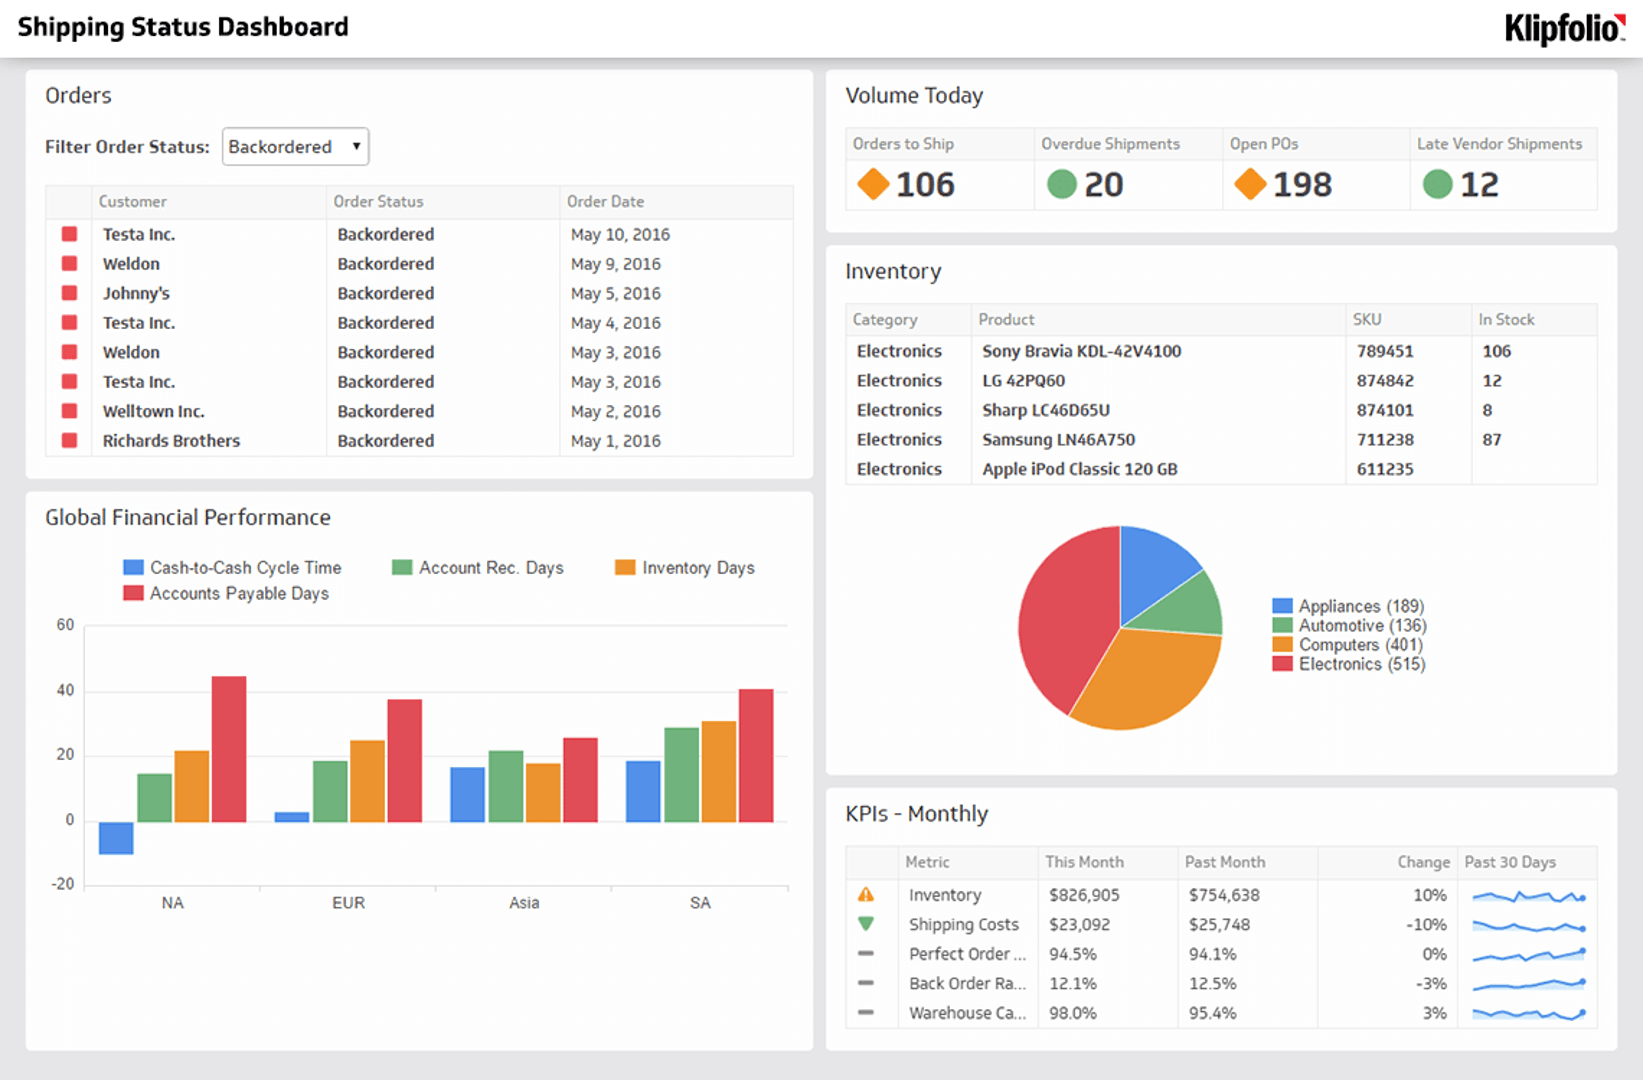
Supply Chain Dashboard
Supply chain dashboards offer a complete view of your supply chain. Using metrics like delivery rates and inventory levels, you can gauge efficiency. You can also measure supplier performance with quality ratings to address chronic lateness and improve overall speed.
Who’s it for | Supply chain managers, logistics directors, procurement officers, operations managers, inventory managers, distribution centre managers, transportation managers, production planners, chief operating officers, supply chain analysts, warehouse managers |
How often it's needed | Real-time, daily, weekly, monthly, quarterly |
Covered KPIs | On?time delivery rate, order fulfillment rate, inventory turnover ratio, days of supply, perfect order rate, supplier performance score, lead time, cost per order, inventory accuracy, forecast accuracy, cash?to?cash cycle time, return rate, backorder rate, fill rate, average days payable outstanding (DPO), transportation costs as a percentage of sales, warehouse utilization rate, inventory carrying costs, order cycle time, supply chain costs as a percentage of sales, downtime due to stock?outs, procurement cycle time, supplier defect rate, total supply chain costs, inventory to sales ratio, distribution costs per unit, on?time shipping rate, demand forecast accuracy, supply chain visibility index, asset utilization rate, average time to resolve disruptions, procurement ROI, sustainability metrics |
Safety and Compliance Dashboard
A safety and compliance dashboard shows adherence to safety regulations and industry standards. By displaying metrics like incident rates, near?miss reports, and compliance scores, you can track the effectiveness of safety protocols.
It also helps you monitor employee training completion and equipment inspection status.
Who’s it for | Safety managers, compliance officers, risk management professionals, operations managers, human resources directors, facility managers, quality assurance managers, environmental health and safety (EHS) specialists, chief operating officers, legal counsel, board members, senior executives |
How often it's needed | Real-time, daily, weekly, monthly, quarterly |
Covered KPIs | Total recordable incident rate (TRIR), lost time injury frequency rate (LTIFR), near?miss frequency rate, safety training completion rate, audit scores, personal protective equipment (PPE) compliance rate, days since last incident, average time to close safety issues, ergonomic assessment scores, hygiene compliance rate, safety observation frequency, hazard identification rate, emergency drill performance, meeting attendance rate, vehicle incident rate, environmental incident rate, compliance violation rate, inspection completion rate, suggestion implementation rate, risk assessment completion rate, safety?related downtime, workers’ compensation costs, program ROI, perception survey results, regulatory fine amounts, corrective action closure rate, contractor compliance rate, equipment maintenance compliance, incident investigation closure rate, communication effectiveness score |
Energy Consumption Dashboard
Energy dashboards show how much energy your facilities use and how efficiently they run. You can spot energy?hungry equipment, track savings initiatives, and compare locations or time periods.
Use them to detect anomalies quickly and reduce costs through better energy management.
Who’s it for | Facility managers, energy managers, sustainability officers, chief financial officers, operations managers, building engineers, environmental compliance managers, utility coordinators, property managers, corporate social responsibility (CSR) directors, plant managers, energy consultants, green building specialists |
How often it's needed | Real-time, hourly, daily, weekly, monthly, quarterly |
Covered KPIs | Total energy consumption (kWh), energy cost per square foot, energy use intensity (EUI), peak demand (kW), use by source, carbon emissions (CO2e), savings achieved, renewable percentage, efficiency ratio, HVAC efficiency, lighting energy use, equipment energy consumption, energy cost as percentage of operating expenses, building performance index, energy per unit of production, demand response performance, anomalies detected, benchmark comparisons, maintenance costs, storage performance, power factor, load factor, waste percentage, conservation measure implementation rate, audit findings closure rate, behaviour scores, data quality index, forecasting accuracy, policy compliance rate, return on investment (ROI), management system uptime, regulatory compliance score |
Production Monitoring Dashboard
Production monitoring dashboards focus on live output. You can quickly spot issues like unexpected downtime or quality problems.
It also becomes easier to oversee order status and inventory levels.
Who’s it for | Production managers, operations directors, plant managers, quality control managers, supply chain managers, lean manufacturing specialists, industrial engineers, maintenance supervisors, shift supervisors, production planners, inventory managers, CEO/COO |
How often it's needed | Real-time, hourly, daily, weekly, monthly |
Covered KPIs | OEE, production output, cycle time, throughput, downtime, scrap rate, first pass yield, production efficiency, capacity utilization, WIP, on?time delivery rate, inventory turnover, MTBF, MTTR, quality rejection rate, labour productivity, machine availability, setup time, order fulfillment rate, cost per unit, energy per unit, material waste percentage, plan attainment, changeover time, line balance efficiency, defects per million opportunities (DPMO), lead time, volume variance, machine utilization, overtime hours, schedule adherence, safety incidents, bottleneck analysis, yield by step, rework rate, backlog, forecast accuracy |
Build a manufacturing dashboard with Klips
Manufacturing dashboards bring critical KPIs into one place so you can cut downtime, protect quality, and ship on time.
With Klips, you can connect your data, choose flexible visuals, and share by TV, link, or PDF. Try Klips free. No credit card required.
Related Dashboards
View all dashboards