

Summary - What are the most important marketing metrics you can track? There are nine we’d class as important to monitor.
Tracking your digital marketing campaigns is more important than ever before. Without data to back up your campaigns, you miss out on essential insights to maximize your efforts.
For you to effectively measure the success of your digital marketing campaigns, you should know the key metrics to track. These provide valuable insights into the performance of your efforts and help you make informed decisions to optimize your marketing strategies.
So, what’s the key data you should track throughout 2024? But first, let’s take a closer look at what marketing metrics are and how they can benefit your business.
What are marketing metrics?
Marketing metrics are measurable values that show how effective digital campaigns are across a range of marketing projects. They can include:
- Email campaigns—delivered, opened, and sent
- Feed subscribers
- Followers
- Goal completions
- Lead conversion rates
- Leads
- Organic search
- Page impressions
The list goes on, but the importance of each one depends on what a business is targeting across each campaign.
For example, email marketing campaigns remain popular and have been enjoying something of a resurgence in recent years.
They seemed to be falling out of favor for a while, but businesses realized they could target existing customers and/or prospects with cheap and effective email strategies.
As a marketing team, you’ll want to know how many of your emails were opened during a campaign.
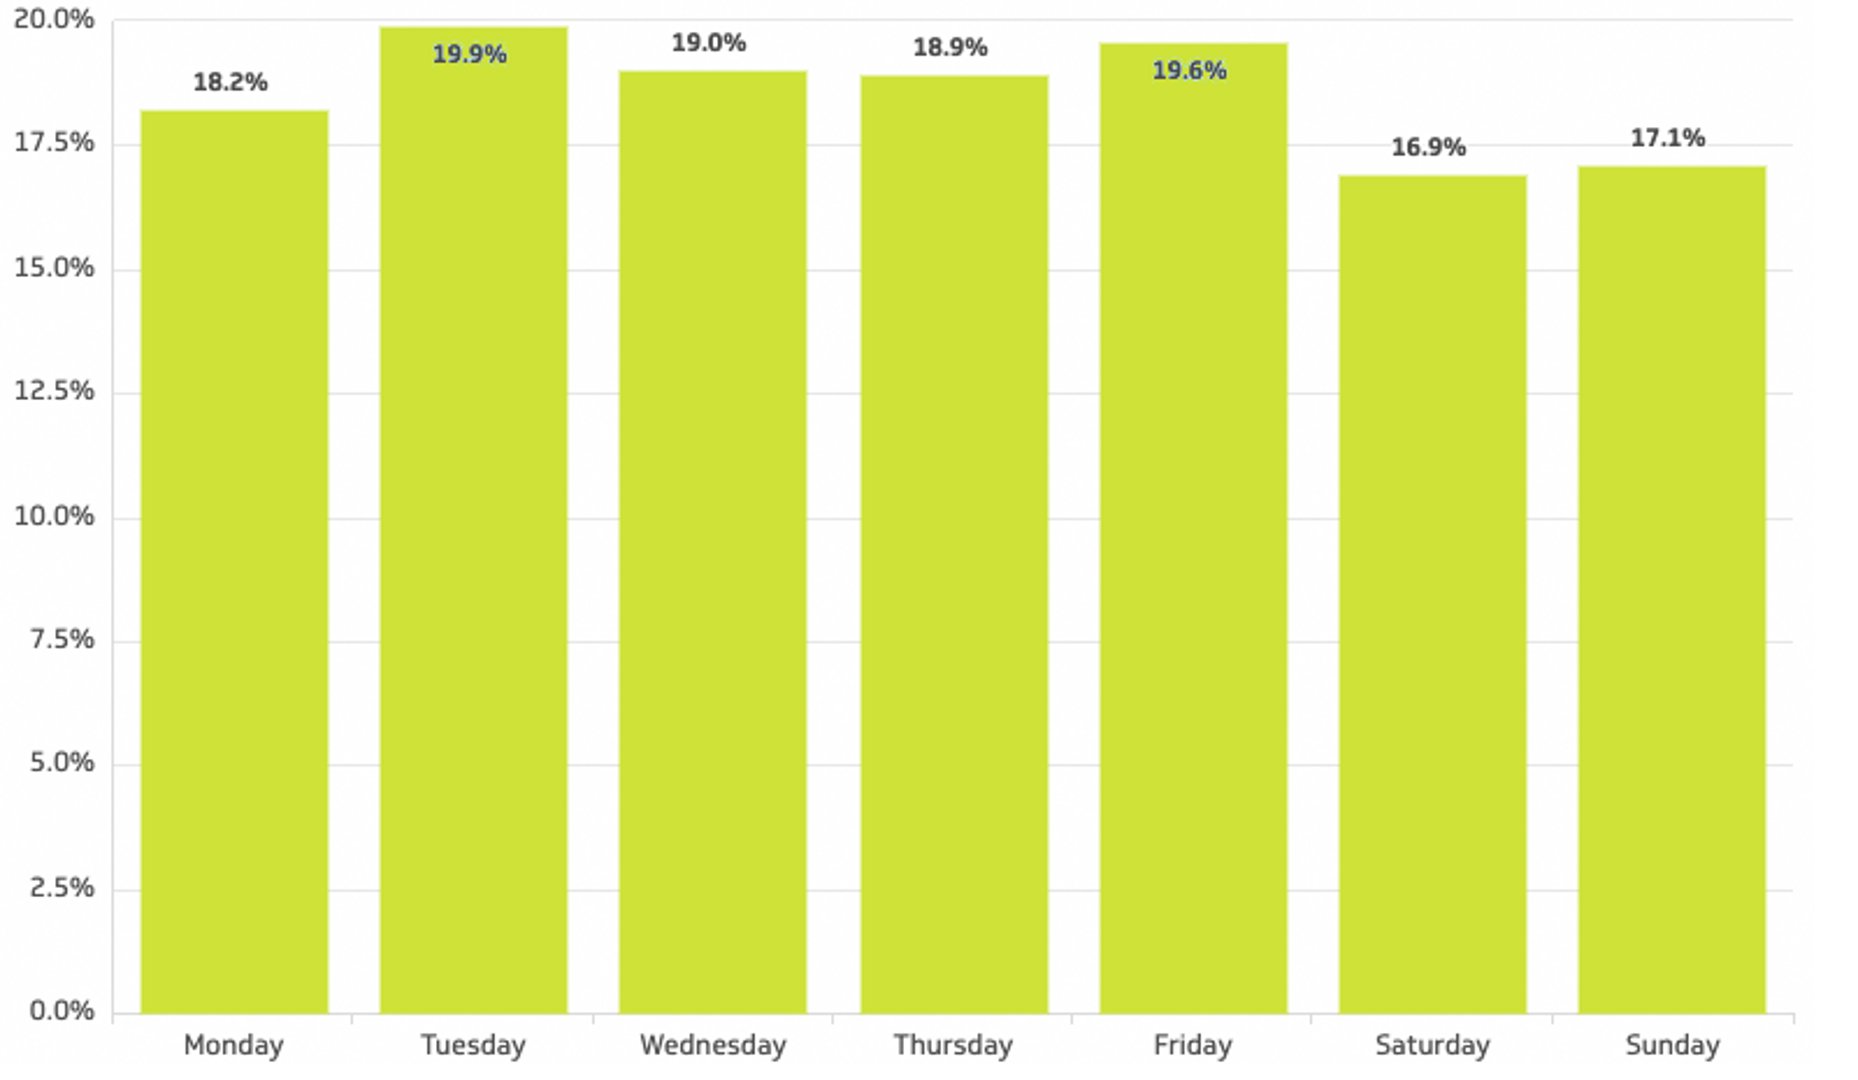
That’s where metrics come in to guide you along the right path toward conversions.
How much has digital marketing changed in the last few years?
Although digital marketing is ever-evolving, the end goal is the same—to generate leads and create more conversions. What we do see, however, are ways for marketers to use metrics and new technology to improve their campaigns.
Trends, tactics, and technology alter to make marketers more effective. Becoming increasingly granular and targeted is standard so that budgets are more efficient.
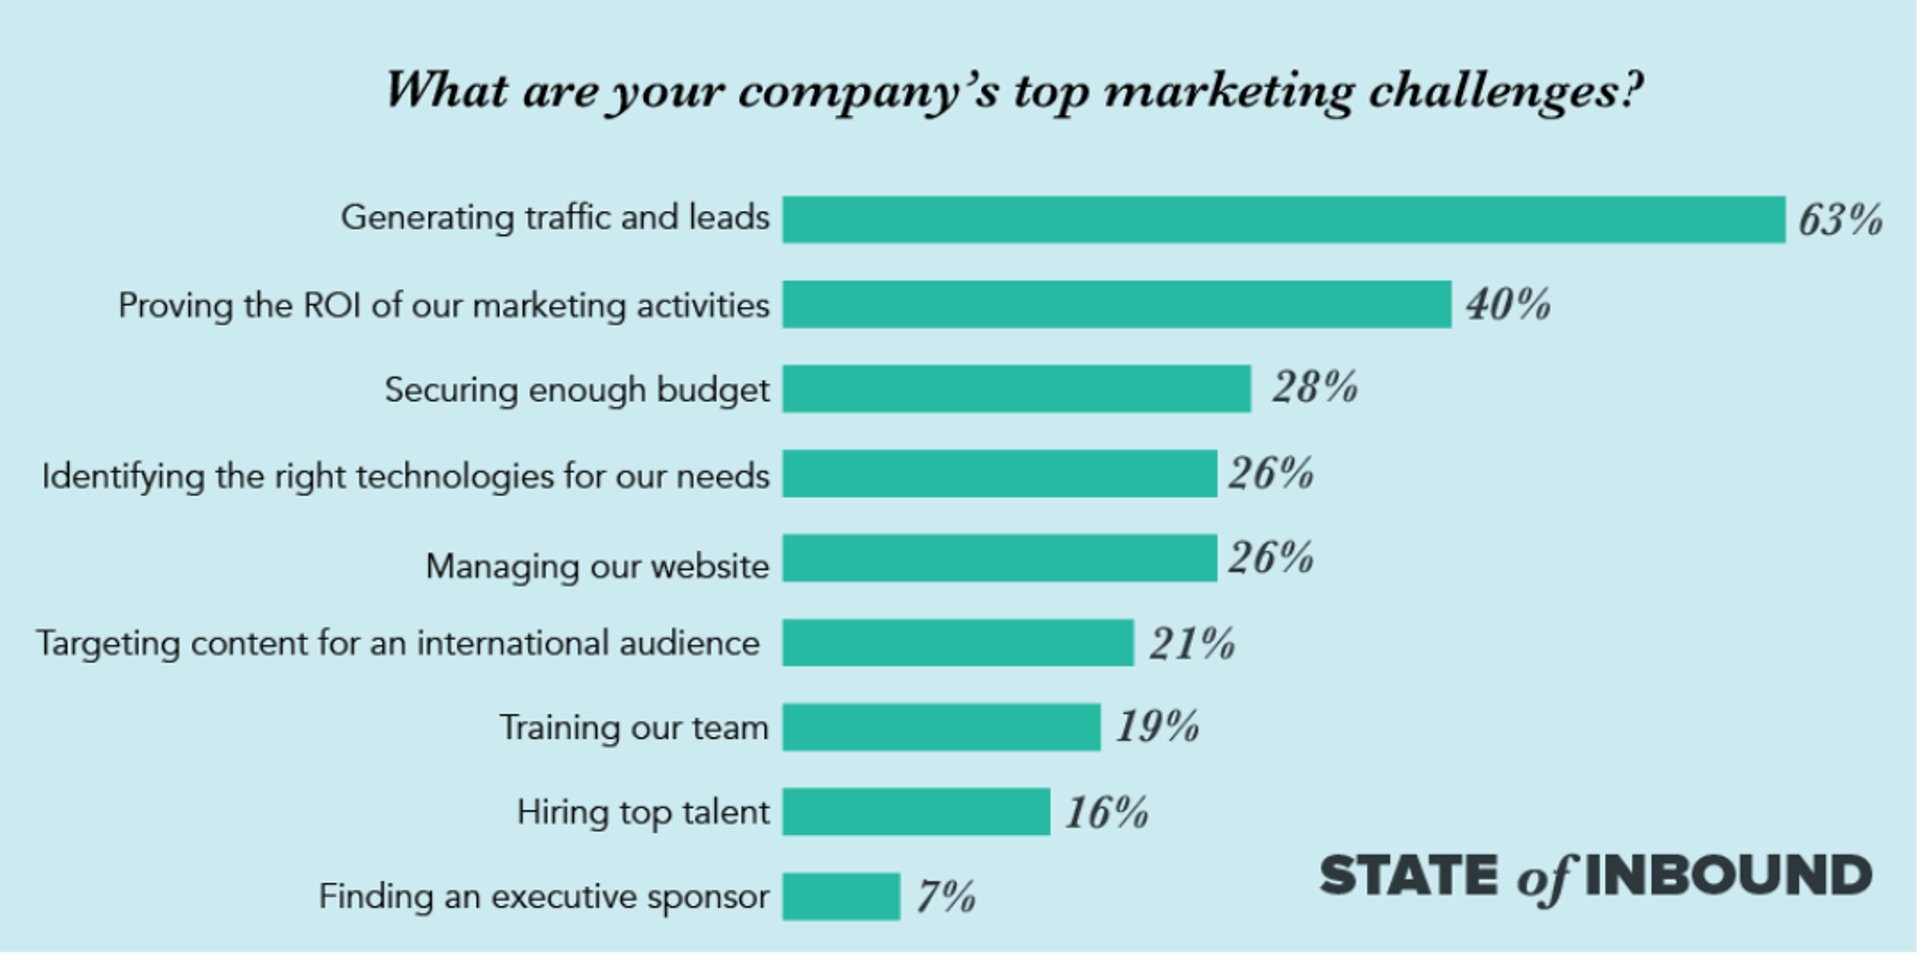
From its State of Inbound report in 2018, Hubspot reported common priorities for marketers.
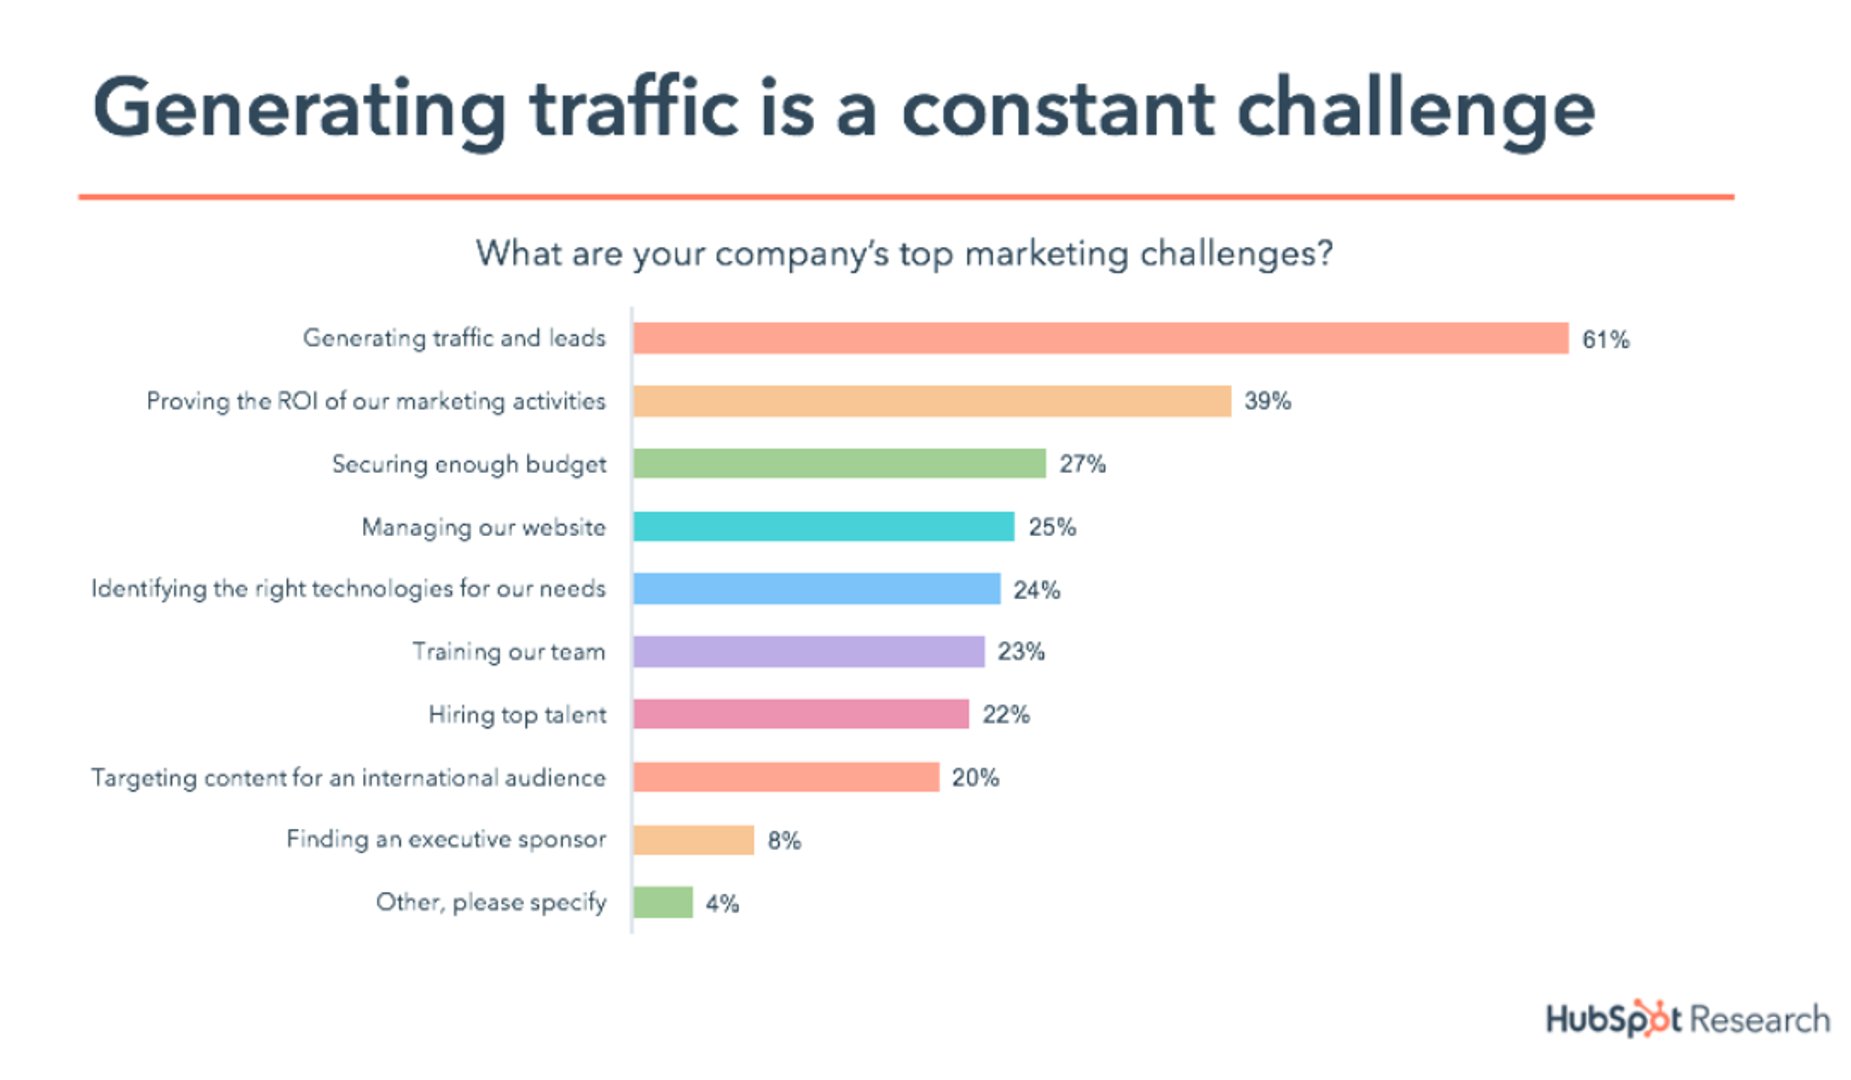
Cut forward to 2024, and Hubspot’s marketing statistics show what’s driving inbound marketing.
And generating traffic and leads remains #1. For understandable reasons—it will always be the central goal of any of your campaigns. However, the gap between other challenges isn’t as wide as it used to be, implying that marketers are now equally focused on improving other aspects of their campaigns as well.
So, let’s have a look at what you should be keeping an eye on over the next few months.
Important marketing metrics to monitor
What are the most important marketing metrics you can track? There are 13 we’d class as important to monitor, which are:
- Brand awareness
- Marketing Qualified Leads (MQLs)
- Sales Qualified Leads (SQLs)
- Conversion rate
- Bounce rate
- SEO traffic
- Click-Through Rate (CTR)
- Net Promoter Score (NPS)
- Customer engagement
- Customer Lifetime Value (CLV)
- Customer retention
- Marketing spend per customer
- Return on Marketing Investment (ROMI)
Ultimately, it’s all about traffic, reach, and conversions. And to achieve all three, you need a wealth of engaging content campaigns. Many businesses look to track a marketing campaign’s success off the leads they get.
Success is often down to a low number of leads but with a large number of conversions. One approach is to qualify prospects before they reach the final stage of the sales or marketing funnel.
A screening process is useful there—or just a highly targeted set of campaigns that bring in relevant prospects. But the more metrics you track, the better your understanding of your campaigns you’ll have.
So, here’s a look at the metrics you can focus on to make traffic count.
1. Brand awareness
Brand mentions and social media followers are crucial brand awareness metrics to track since they reflect how familiar your target audience is with your brand and how well they recognize it across various platforms.
To effectively track marketing metrics related to brand awareness, you should focus on several key indicators. Social media metrics, such as the number of mentions, shares, and followers, can provide insights into how widely recognized your brand is online.
Another important metric to track is website traffic, specifically the number of new visitors versus returning visitors. An increase in new visitors suggests that your brand is reaching a broader audience.
2. Marketing Qualified Leads (MQLs)
An MQL is a prospect who’s shown some interest in your brand through your marketing efforts. These leads have engaged with your content or responded to your marketing campaigns, which indicates that they may be more likely to become customers compared to other leads.
Getting the MQL involves calculating for factors such as demographic information, level of engagement with your content, or specific actions taken on your website. This includes downloading a white paper, signing up for a webinar, or engaging with your content in a way that indicates a deeper interest in your offerings.
Tracking the number of MQLs can help you assess the effectiveness of your marketing strategies and identify potential leads that are worth nurturing. You should review and adjust your MQL criteria regularly to make sure you’re targeting the right audience and maximizing your conversion opportunities.
3. Sales qualified leads (SQLs)
Meanwhile, SQLs represent leads that have been evaluated and deemed ready for the next step in the sales process. Unlike MQLs, which indicate an initial interest, SQLs show a deeper level of engagement and a higher likelihood of becoming customers.
Nonetheless, similar to MQLs, you should set criteria on how to qualify SQLs. This could include requesting a product demo, filling out a contact form with detailed inquiries, or directly engaging with sales representatives. These actions indicate that the lead has moved beyond mere interest and is considering making a purchase.
To monitor and measure SQLs, you should leverage data analytics tools and CRM systems. These can help you track the journey of a lead from the initial point of contact through to becoming an SQL and, eventually, a customer.
Level up data-driven decision-making. Make metric analysis easy for everyone. Get PowerMetrics Free
4. Conversion rate
The conversion rate is the percentage of users who take a desired action, such as making a purchase, signing up for a newsletter, or filling out a contact form. It ties to MQLs and SQLs by reflecting how your campaigns convert interest into tangible outcomes.
Conversion rate formula:
Conversion rate = (number of conversions / total number of visitors) * 100
It provides insights into how well your campaigns convert leads into customers or achieve other objectives. Here are four ways to optimize your conversion rate:
- Conduct A/B testing
- Improve your website's user experience
- Create persuasive call-to-actions
- Personalize your messaging
Conversion metrics aren’t just limited to your website. It can also be tracked across other channels, such as email marketing campaigns, social media ads, or landing pages. Monitoring and analyzing your conversion rate can help you identify areas for improvement and refine your marketing strategies.
5. Bounce rate
Aside from conversions, you should also track your bounce rate, which offers insights into the engagement and relevance of your website content to your audience.
A "bounce" occurs when a user visits your website and leaves without interacting further — without clicking on a menu item, a “read more” link, or any other links on the page. The bounce rate is the percentage of all visits that are single-page sessions. It can help you gauge how effective your website is in capturing the interest of your visitors.
Bounce rate formula:
Bounce rate = (number of single-page visits / total number of visits) * 100
A high bounce rate may indicate that your website content is not engaging or relevant to your audience. To reduce bounce rate, you can optimize your website's loading speed and make sure that it’s mobile-friendly.
You should also consider your email bounce rate, which indicates the percentage of emails that were not successfully delivered to recipients' inboxes. The average email bounce rate benchmark is 0.41%, which means you may need to clean your email list or improve your email deliverability if yours goes beyond this average.
6. SEO traffic
Search engine optimization (SEO) traffic refers to the visitors who arrive at your website organically or through a search engine result, not through paid advertising. It represents a segment of users actively searching for information, products, or services related to your business, which makes them highly valuable prospects.
Google Analytics is a great tool for measuring this metric by displaying:
- The volume of traffic coming from search engines
- Keywords that are driving traffic
- How users are engaging with your website once they arrive
Pay attention to the specific pages that are driving SEO traffic. These help you understand which aspects of your content strategy work well and which topics or keywords are most relevant to your audience.
7. Click-Through Rate (CTR)
CTR measures the percentage of people who click on a link or ad after seeing it. It provides insight into how compelling your ad, email, or any call-to-action (CTA) is to your target audience.
A high CTR indicates that your message resonates well with your audience, compelling them to take action. Conversely, a low CTR suggests that there may be a disconnect between your message and what your audience is interested in or looking for.
CTR formula:
CTR = (number of clicks / number of impressions) * 100
In email, the CTR involves tracking the number of clicks on links within your email campaigns compared to the total number of recipients.
8. Net Promoter Score (NPS)
The NPS is a valuable marketing metric for all businesses since it quantifies customer satisfaction and loyalty. It gauges how likely your customers are to recommend your product or service to others.
Calculating this score is all about asking your customers one simple question: "On a scale of 0 to 10, how likely are you to recommend our company/product/service to a friend?"
Based on their responses, customers are categorized into three groups:
- Promoters (score 9-10)
- Passives (score 7-8)
- Detractors (score 0-6)
Then, subtract the percentage of Detractors from the percentage of Promoters. For example:
- Detractors: 6 (4.8%)
- Neutrals: 64 (51.2%)
- Promoters: 55 (44%)
- Total: 125 (100%)
Net Promoter Score = 44% - 4.8% = 39.2
Monitoring NPS lets you track customer perceptions over time and measure the impact of their marketing efforts on customer loyalty. A high NPS indicates that your customers are happy and willing to spread the word about your business, which can lead to increased referrals, higher customer retention rates, and, ultimately, more revenue.
9. Customer engagement
Customer engagement reflects how actively involved your customers are with your brand. It goes beyond mere transactions to measure the depth of a customer's relationship with your business, including interactions via social media, email, website visits, and more.
To measure this, you must track a variety of metrics that represent different aspects of customer interaction with your brand, including:
- Time spent on site
- Social media interactions (likes, shares, comments)
- Email open rates
- Participation in surveys or feedback forms
Each of these metrics offers insights into how customers interact with your content and what might drive their behavior. Engaged customers are more likely to become repeat buyers, advocates for your brand, and have a higher lifetime value.
10. Customer Lifetime Value (CLV)
Customer lifetime value (CLV) takes a look at the total revenue a business can expect from a single customer account throughout their relationship with the company.
Calculating LTV involves analyzing historical data to estimate:
- The average duration of a customer relationship
- The number of transactions
- The average transaction value
While the formula can vary depending on the business model, a simple way to calculate LTV is by multiplying the average transaction value by the number of purchases a customer makes in a year and then multiplying that by the average customer lifespan in years.
CLV formula:
CLV = (average transaction value) * (number of purchases per year) * (average customer lifespan in years)
For marketers, tracking the LTV of customers provides insights into the long-term value of marketing campaigns and customer relationships. A high LTV indicates that customers are highly engaged with your brand, making repeat purchases over time. This suggests that your marketing efforts are effective in not only attracting customers but also in retaining them.
11. Customer retention
Customer retention measures the ability of a company to keep its customers over a period of time. Low retention rates can signal the need for improvement in product offerings, customer service, or overall customer experience.
To track customer retention, you need to calculate the percentage of customers who remain active over a specific period compared to the total number of customers at the start of that period. Take note that this does not include new customers acquired during that time.
For example, if you start the year with 100 customers and end it with 80, excluding any new customers, your customer retention rate for the year is 80%.
Retaining customers costs three to six times less than constantly acquiring new ones. That’s why you should monitor and focus more on maintaining a high customer retention rate.
12. Marketing spend per customer
Often called customer acquisition cost (CAC), this is where you evaluate how much it’s costing your team to bring in a single customer. After all, losing hundreds of dollars on a customer who’s only spending a small amount isn’t sustainable for your business.
CAC formula:
CAC = total marketing spend / number of new customers acquired
For example, $1,000 on marketing each year leading to 100 customers equals a CAC of $10. If that customer is then spending $100, that’s a good way to gain a profit.
A lower marketing spend per customer indicates that your marketing efforts are efficient and cost-effective, while a higher spend suggests the need for optimization to reduce costs or improve the effectiveness of your marketing activities.
13. Return on Marketing Investment (ROMI)
The overarching goal of business is to generate a return on your investment that’s more than the overall cost of your operations. The same principle applies in marketing. You want to make sure that your investment is yielding a positive return.
ROMI formula:
ROMI = (Revenue generated from marketing campaigns - Cost of marketing campaigns) / Cost of marketing campaigns
For example, if a campaign cost $1,000 and generated $5,000 in sales, the ROMI would be ($5,000 - $1,000) / $1,000 = 4. This means you earned $4 for every $1 spent on marketing.
Tracking ROMI helps marketers identify which campaigns are performing well and which are not, allowing for the reallocation of resources to the most effective strategies.
It’s a complex issue to get right, given the various campaigns you can be running simultaneously. Refer to Return on Marketing Investment (ROI) for detailed insights.
How to determine the right marketing metrics to track
Determining the right marketing metrics to track is essential for understanding how effective your marketing efforts are. Moreover, getting the right insights allows you to make accurate data-driven decisions to improve your business's performance. Here's how you can determine which marketing metrics are most important for your business:
Identify your business goals
Start by clearly defining your business goals. Whether it's increasing brand awareness, boosting sales, improving customer retention, or enhancing customer engagement, your goals will dictate which metrics are most relevant.
For example, if your goal is to increase sales, you'll want to focus on metrics like conversion rate and average order value. On the other hand, if your goal is to improve customer engagement, metrics like click-through rate and social media engagement would be more relevant.
Knowing where you want your organization to go lays a solid foundation for determining the marketing metrics. After all, your overall business goals will help you track your progress along the way.
Determine your marketing objectives
After identifying your business goals, it’s time to think about your marketing objectives. Each marketing campaign or effort should have specific targets that align with your overall vision.
For instance, if you're running a digital marketing campaign to increase brand awareness, your marketing objective might be to boost website traffic and social media followers. If you're launching a new product, your objective could be to generate a certain number of leads or increase sales within a specific timeframe.
With clear and measurable marketing objectives, you can determine which metrics will help you track progress toward achieving those objectives.
Choose relevant metrics
Based on your business goals and marketing objectives, pick metrics that will provide insights into your performance. Choose from the list above, such as customer retention rate, marketing spend per customer, and return on marketing investment (ROMI). These will give you valuable insights into different aspects of your marketing performance.
Use analytics tools
Tools like Google Analytics, social media analytics platforms, and customer relationship management (CRM) systems can provide useful data on your marketing performance. They can help you monitor website traffic, conversion rates, customer behavior, and more.
These are the top marketing analytics tools you should use for your company:
Web analytics tools
Web analytics tools, like Google Analytics, are essential for tracking and analyzing website performance. They provide data on website traffic, user behavior, page views, bounce rates, and conversions. With insights from these tools, you can understand how visitors interact with your site and identify areas for improvement.
Social media analytics tools
Hootsuite, Sprout Social, and Buffer are social media analytics tools that help you measure your engagement rates, follower growth, and the overall effectiveness of social media campaigns. These tools can track metrics across various platforms, from Facebook, Instagram, and TikTok to YouTube and Pinterest. By analyzing these metrics, you can gain insights into the effectiveness of your social media strategies.
Customer Relationship Management (CRM) tools
CRM tools allow you to manage customer data while tracking interactions and analyzing customer behavior over time. Salesforce and HubSpot CRM help you understand customer preferences, improve customer service, and increase customer retention and loyalty.
SEO and content analytics tools
SEO and content analytics tools focus on optimizing website content for search engines. They provide insights into keyword performance, backlink analysis, content engagement, and overall SEO health, helping businesses attract more organic traffic. Examples of these tools are Ahrefs, Semrush, and Moz.
Email marketing analytics tools
Email marketing analytics tools like Mailchimp and Campaign Monitor track the performance of email campaigns, including open rates, click-through rates, conversion rates, and bounce rates. These insights help marketers optimize their email strategies for better engagement and conversions.
Customer feedback and satisfaction tools
SurveyMonkey and Zendesk collect and analyze customer feedback, reviews, and satisfaction scores. They help you understand customer perceptions, measure customer satisfaction (e.g., through Net Promoter Score), and identify areas for product or service improvement.
Advertising and PPC analytics tools
For your online advertising campaigns, you must monitor how much return you get from each ad. They provide metrics on ad impressions, clicks, conversion rates, and ROI, helping businesses optimize their ad spend for maximum impact.
Often, the platform you choose has its own advertising analytics system. Google has Google Ads, while Facebook has its Ad Manager for insights into your page’s performance.
Heatmapping and user experience tools
Heatmapping and user experience tools, such as Hotjar and Crazy Egg, visualize how users interact with a website, showing clicks, scrolls, and mouse movements. These insights help businesses optimize website design and user experience for better engagement and conversions.
Data visualization tools
Lastly, you need a place where you can easily create dashboards to visualize and analyze all the data you've collected. PowerMetrics, our no-code data visualization tool, lets you create interactive dashboards that make analytics easy and understandable. By using data visualization tools, you can effectively communicate your findings and insights to stakeholders within your organization.
Analyze and adjust
Review your marketing metrics every quarter or as frequently as needed to assess your performance against your goals. Look for trends, patterns, and areas for improvement.
Consider adjusting your approach if certain campaigns or strategies are not performing as expected. Continuous analysis will help you optimize your marketing efforts and allocate your budget more effectively.
Benchmark against industry standards
Compare your metrics against industry benchmarks to see how your business stacks up against competitors. This can help you identify areas where your business excels and areas where there's room for improvement. Benchmarking can also provide insights into industry trends and best practices.
How to measure and improve your marketing ROI
Understanding and improving your Return on Marketing Investment (ROMI) makes sure that every dollar spent contributes to your business's growth. Aside from having clear goals and knowing the right metrics, here are other ways to enhance your marketing ROI with precision and strategic insight.
Do A/B testing
A/B testing, also known as split testing, is where you compare two versions of a marketing asset (like a webpage or email) to see which one performs better. It involves changing one element at a time, such as the call-to-action (CTA) button color or email subject line. This way, you can determine which variations resonate more with your audience.
A/B testing helps optimize your marketing campaigns for better results, ultimately improving your marketing ROI.
Leverage marketing automation tools
Marketing automation tools, such as HubSpot and Marketo, enhance the efficiency and effectiveness of your marketing efforts. These allow you to reprogram repetitive tasks, such as email marketing, social media posting, and ad campaigns. As a result, you have more time to focus on strategy and creative aspects.
With these tools, you can guarantee consistent engagement with your audience, timely follow-ups, and personalized user experiences. All of these lead to higher conversion rates and a better ROI.
Personalize your marketing efforts
Personalization is key to standing out in today’s competitive and crowded digital landscape. Tailor your marketing messages and offers based on customer data, such as past behavior, preferences, and demographics.
Use data analytics and segmentation to understand your audience better and deliver relevant content and offers. By targeting a segment of your buyers, you can build stronger relationships and drive higher conversion rates. Additionally, personalization can lead to increased customer loyalty and repeat business, further enhancing your marketing ROI.
Prioritize customer lifetime value
Instead of doubling down on short-term conversions, shift your focus toward increasing CLV for long-term profitability. Investing in customer retention lets you boost CLV, which means more revenue over time from each customer.
One of the best strategies is to implement a customer loyalty program that rewards current buyers for their continued support. Plus, it encourages them to make repeat purchases.
Through exclusive discounts, personalized offers, and VIP perks, you can incentivize customers to stay loyal to your brand. This not only increases CLV but also improves customer satisfaction and strengthens brand loyalty.
Measure and analyze data continuously
Make sure your campaigns remain effective through continuous measurement and analysis of your marketing metrics. Use analytics tools to track key metrics and display them through user-friendly and interactive data dashboards like PowerMetrics.
Analyzing this data helps you identify what's working and what's not. As such, you can make informed decisions to optimize your marketing strategies and improve ROI.
Final Thoughts
Metrics are important, and a decisive marketing campaign is lost without them—your business needs marketing metrics. They help steer your campaigns toward success, rectify failures, and provide ROI.
What you target is dependent on your business goals. However, analyzing the right metrics to follow can prove highly lucrative.
Don’t miss out—speak to your marketing team or refer to an industry expert for guidance.
Related Articles

5 tips to understand (and organize) your restaurant data
By Saleem Khatri — June 9th, 2026
6 dashboards I use daily to run my SaaS company
By Allan Wille, Co-Founder — April 10th, 2026
Business Metrics vs. KPIs: What’s the Difference?
By Jonathan Taylor — March 13th, 2026
