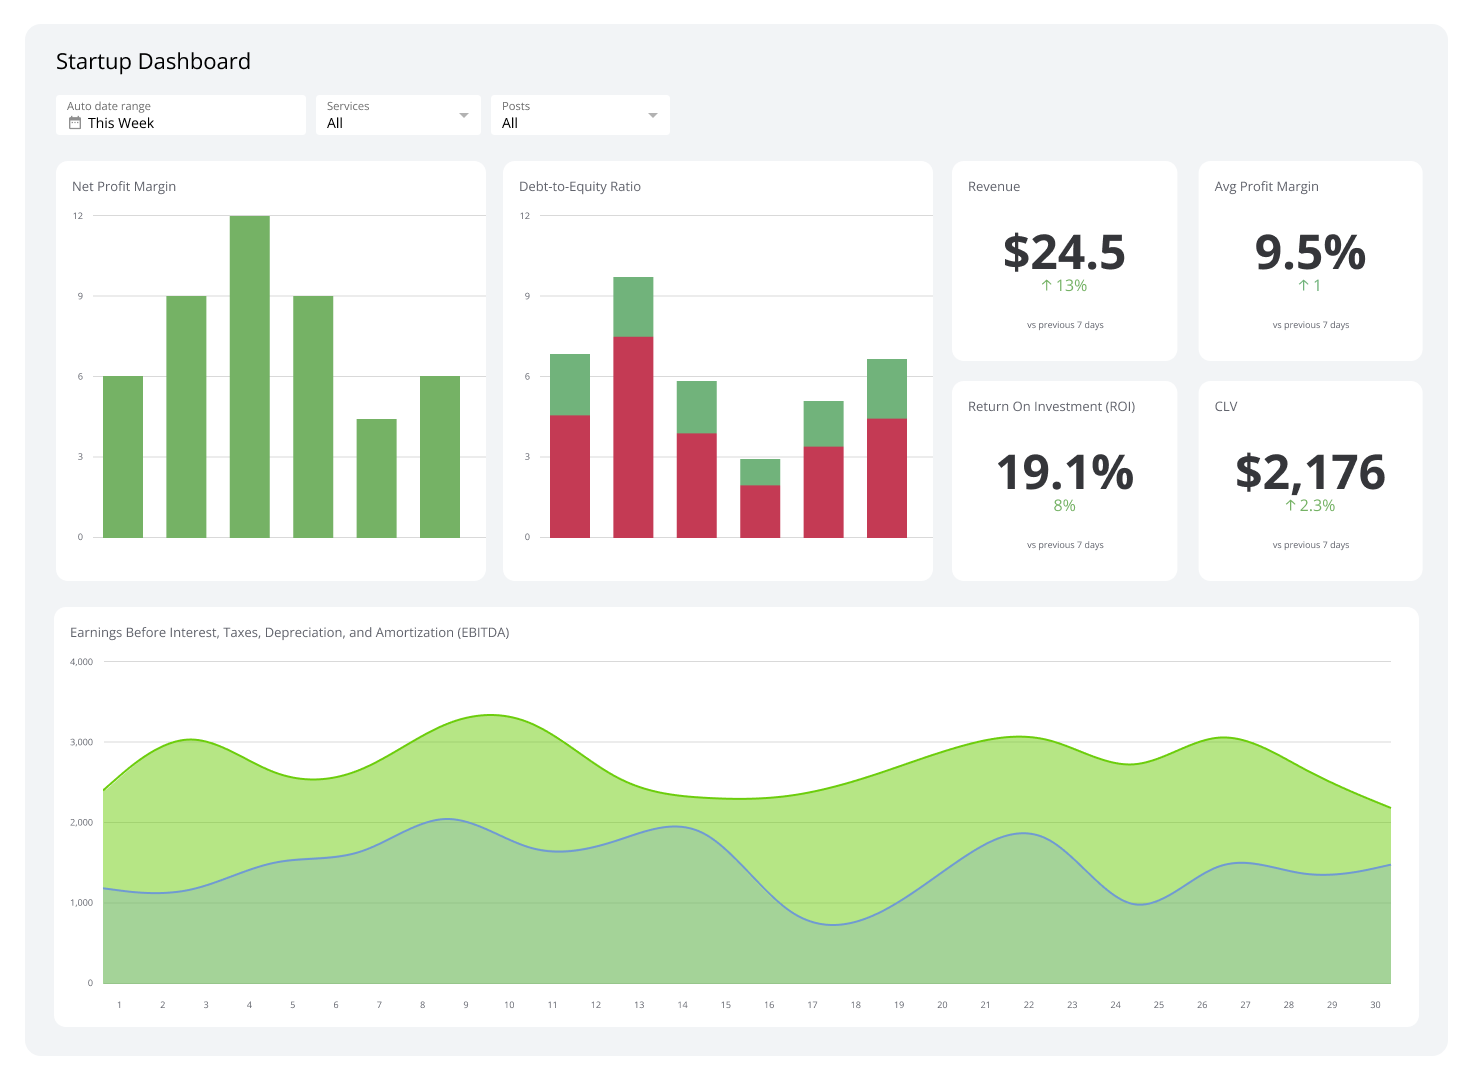
Startup Dashboard
Track growth, revenue, and runway KPIs in one clear view.
What is a Startup Dashboard?
A startup dashboard pulls data from your tools and reports, then turns it into easy visuals like charts, graphs, and tables.
It can show daily user acquisition so you can see how campaigns perform. For product teams, it can surface feature usage so you spot what resonates and where adoption lags.
Examples of Startup Dashboards
Operations Dashboard
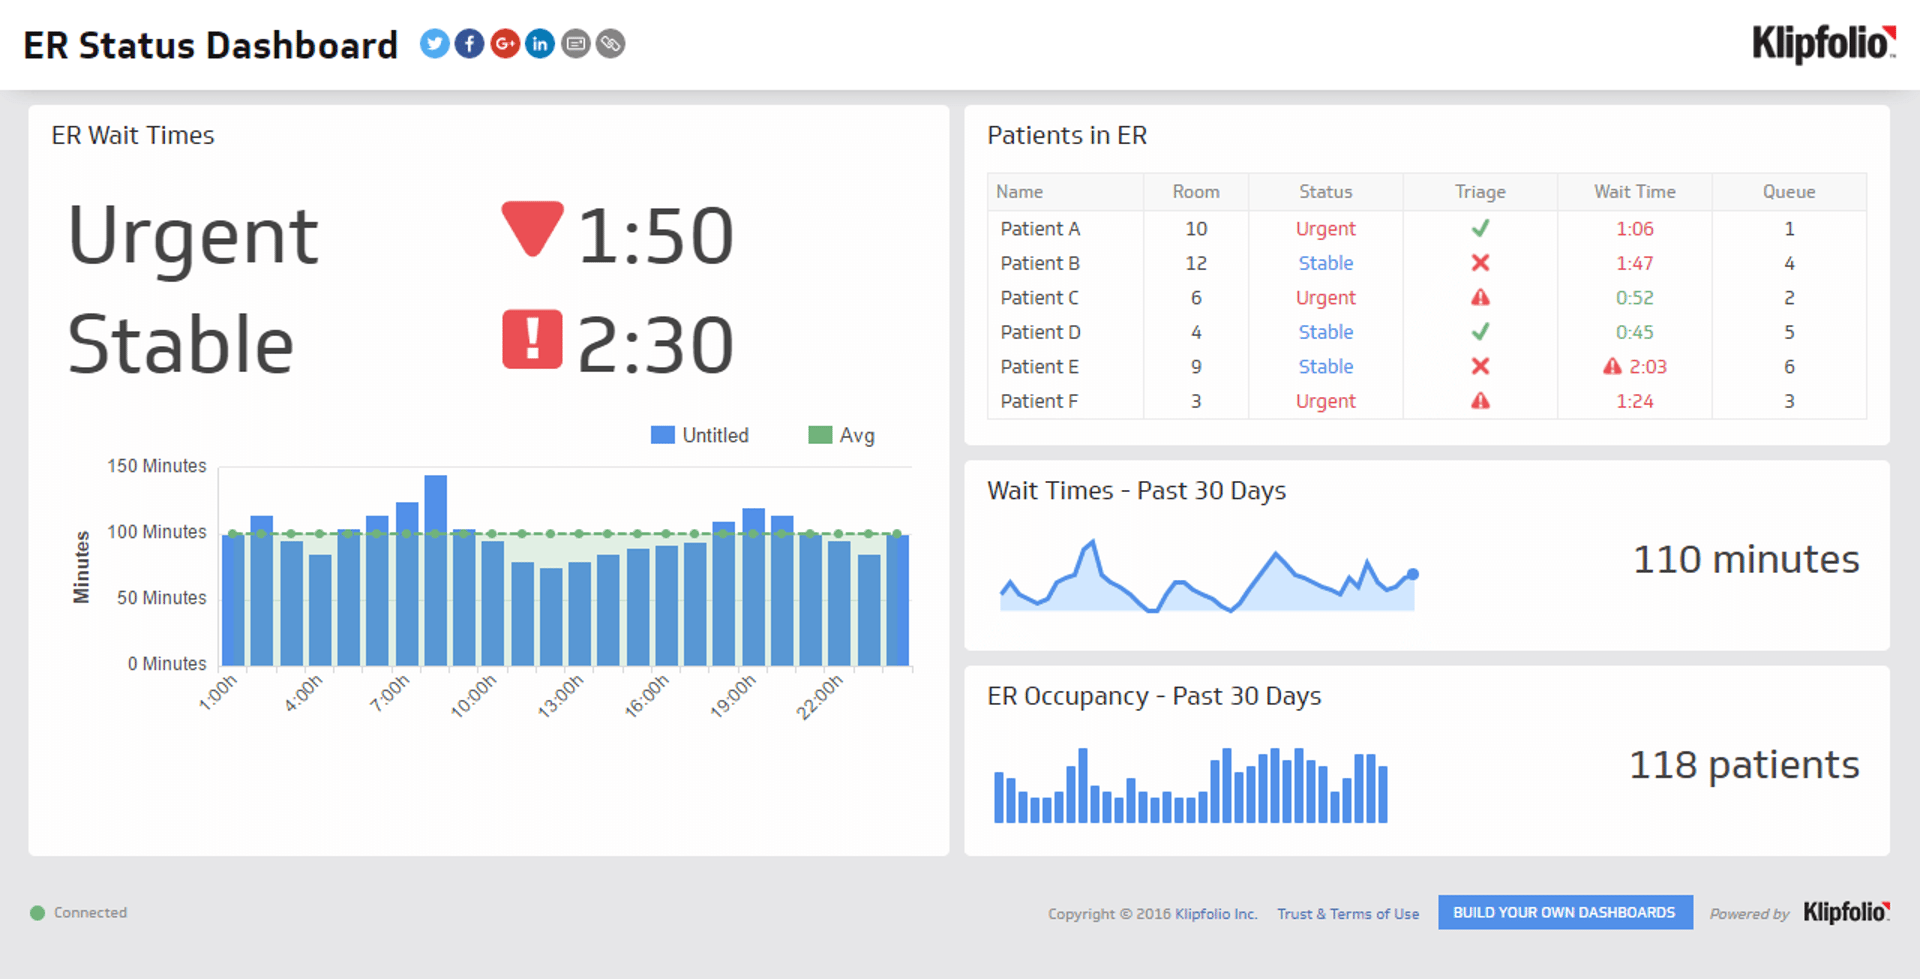
An operations dashboard provides a deep look into the operational performance of your startup. Through metrics like production efficiency, inventory levels, and order fulfillment rates, the dashboard tells you how well day-to-day operations run and where bottlenecks or inefficiencies exist.
Who’s it for | Operations managers, supply chain managers, production supervisors, company executives, quality control teams, logistics coordinators |
How often it's needed | Real-time, daily, weekly, monthly |
Covered KPIs | Production output, inventory turnover, order fulfillment rate, on-time delivery rate, equipment utilization rate, defect rate, cycle time, throughput, capacity utilization, overall equipment effectiveness (OEE), lead time, work-in-progress (WIP) levels, scrap rate, labor productivity, machine downtime, supplier performance metrics, warehouse capacity utilization, inventory accuracy, transportation costs, energy consumption, maintenance costs, safety incidents, quality control metrics, customer complaints, return rate, operational costs per unit, production schedule adherence, process yield, material waste, employee productivity, inventory days on hand, perfect order rate, cash-to-cash cycle time, forecast accuracy, backorder rate, pick and pack times, dock-to-stock time, supply chain visibility |
Marketing Dashboard
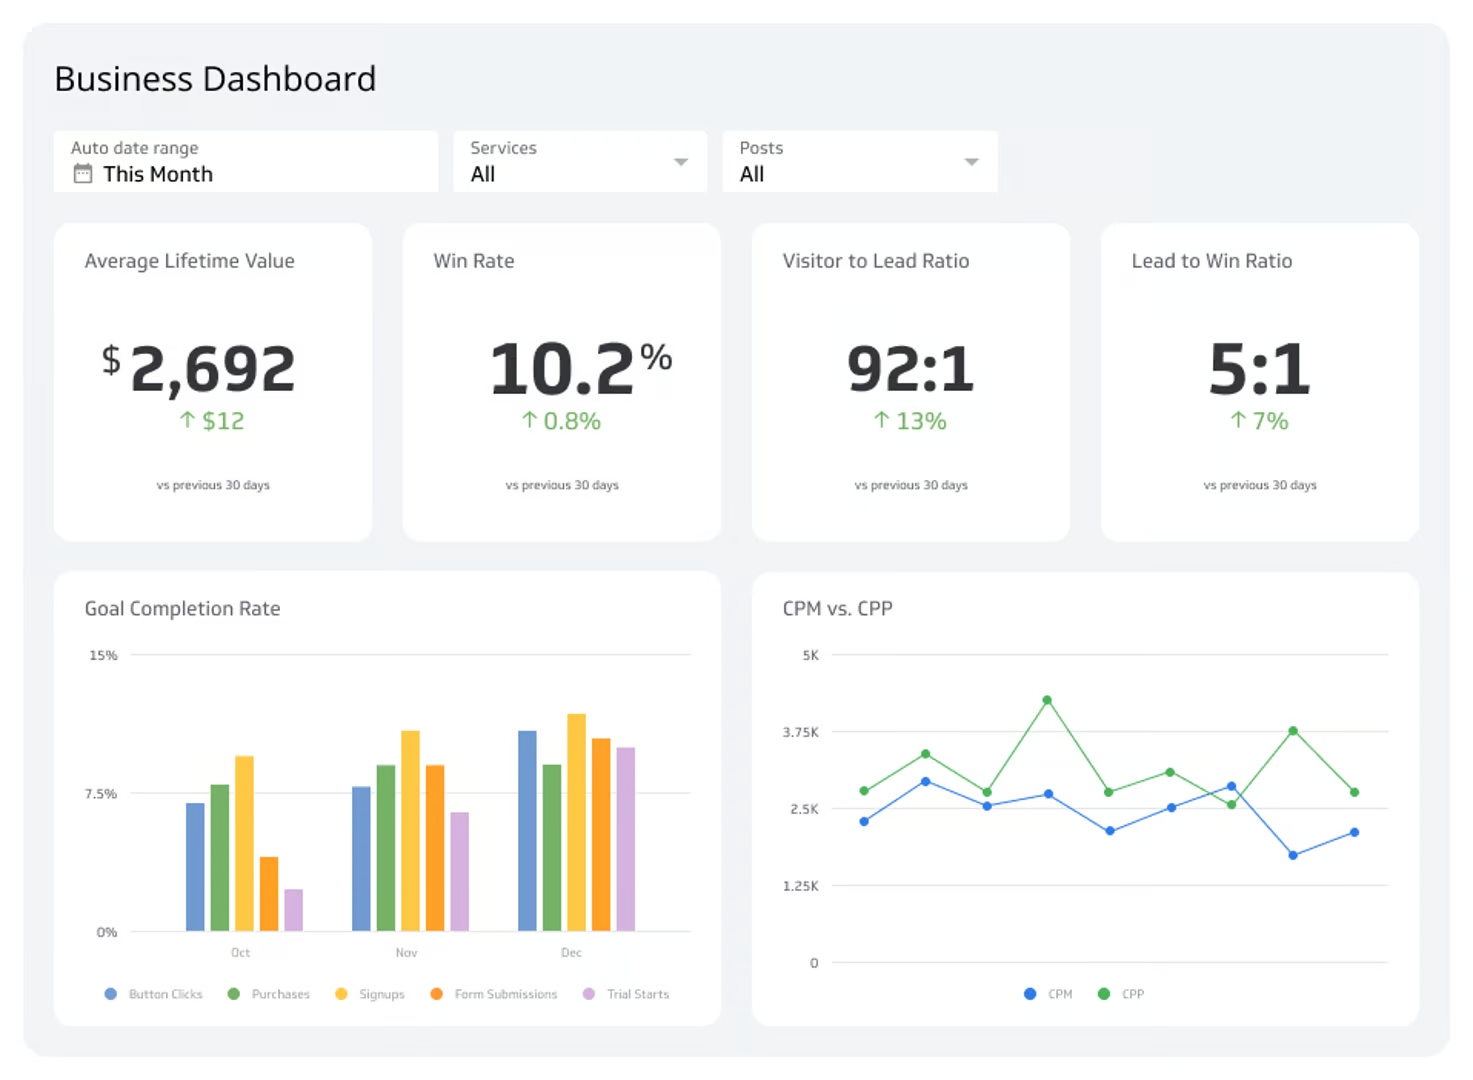
A marketing dashboard shows how your startup’s marketing performs. It tracks customer acquisition cost and conversion rates so you can compare channels, improve your mix, allocate budgets with confidence, and raise return on marketing investment.
Who’s it for | Marketing managers, digital marketers, content creators, social media managers, company executives, brand managers, marketing analysts |
How often it's needed | Daily, weekly, monthly, quarterly |
Covered KPIs | Website traffic, conversion rate, customer acquisition cost (CAC), return on ad spend (ROAS), cost per click (CPC), click-through rate (CTR), bounce rate, social media engagement rate, email open rate, email click-through rate, lead generation rate, marketing qualified leads (MQLs), sales qualified leads (SQLs), brand awareness, share of voice, customer lifetime value (CLV), net promoter score (NPS), organic traffic, paid search traffic, content performance metrics, followers growth, video view count, marketing ROI, campaign performance, landing page conversion rate, cost per lead, average order value, customer retention rate, time on site, pages per session, social media reach, influencer marketing ROI, mobile vs desktop traffic, audience demographics, referral traffic, marketing-generated revenue, customer segmentation effectiveness, brand sentiment analysis |
Sales Dashboard
Sales dashboards give a clear view of your startup's sales performance. They track the effectiveness of sales tactics, highlight what works, monitor conversion rates at each funnel stage, and show progress against revenue targets. Common metrics include total revenue, sales by product or service, growth rate, and pipeline value.
Who’s it for | Sales managers, sales representatives, company executives, marketing teams, business development managers |
How often it's needed | Daily, weekly, monthly, quarterly |
Covered KPIs | Total revenue, sales growth rate, sales by product/service, sales by region, sales by customer segment, average deal size, win rate, sales conversion rate, sales cycle length, pipeline value, number of new opportunities, number of closed deals, sales quota attainment, CAC, CLV, lead-to-opportunity ratio, opportunity-to-win ratio, sales value productivity, sales forecast accuracy, cross-sell/upsell rates, customer churn rate, average profit margin, sales velocity, lead response time, number of sales calls/meetings, proposal win rate, sales funnel conversion rates, revenue per sales rep, customer retention rate, NPS |
Customer Satisfaction Dashboard
High customer satisfaction leads to loyalty. A customer satisfaction dashboard shows how well your startup meets expectations. It displays metrics on satisfaction, effort, and loyalty so you can see where to improve the experience.
Who’s it for | Customer service managers, customer support representatives, company executives, product managers, marketing teams |
How often it's needed | Daily, weekly, monthly, quarterly |
Covered KPIs | NPS, customer satisfaction score (CSAT), customer effort score (CES), first response time, average resolution time, ticket volume, ticket backlog, customer retention rate, churn rate, CLV, CAC, customer feedback ratings, number of support interactions, support channel preference, self-service success rate, customer loyalty index, repeat purchase volume, rate of return, customer complaint rate, issue resolution rate, customer engagement score, customer satisfaction by product/service, customer satisfaction by support channel, customer satisfaction trends over time, average handling time, first contact resolution rate, customer survey response rate, customer sentiment analysis, customer satisfaction by customer segment, customer satisfaction impact on revenue |
Competitive Analysis Dashboard
Competitive analysis dashboards help you understand position in the market relative to competitors. They provide insights to refine strategy, spot threats, and capitalize on gaps in the landscape.
Who’s it for | Marketing managers, product managers, company executives, sales teams, business development managers, strategic planners |
How often it's needed | Weekly, monthly, quarterly, annually |
Covered KPIs | Market share, competitor pricing, product feature comparison, brand sentiment analysis, competitor growth rate, share of voice, CAC comparison, CLV comparison, competitor marketing spend, social media engagement rates, website traffic comparison, search engine rankings, customer satisfaction scores, NPS, product launch success rates, innovation index, patent filings, research and development spending, employee satisfaction and turnover rates, financial performance metrics, geographic presence, distribution channel effectiveness, customer demographics analysis, pricing strategy effectiveness, promotional campaign performance, product portfolio diversity, market penetration rates, brand awareness levels, customer loyalty metrics, competitive win/loss ratio, time-to-market for new products, customer support performance metrics, sustainability and corporate social responsibility rankings |
Growth Dashboard
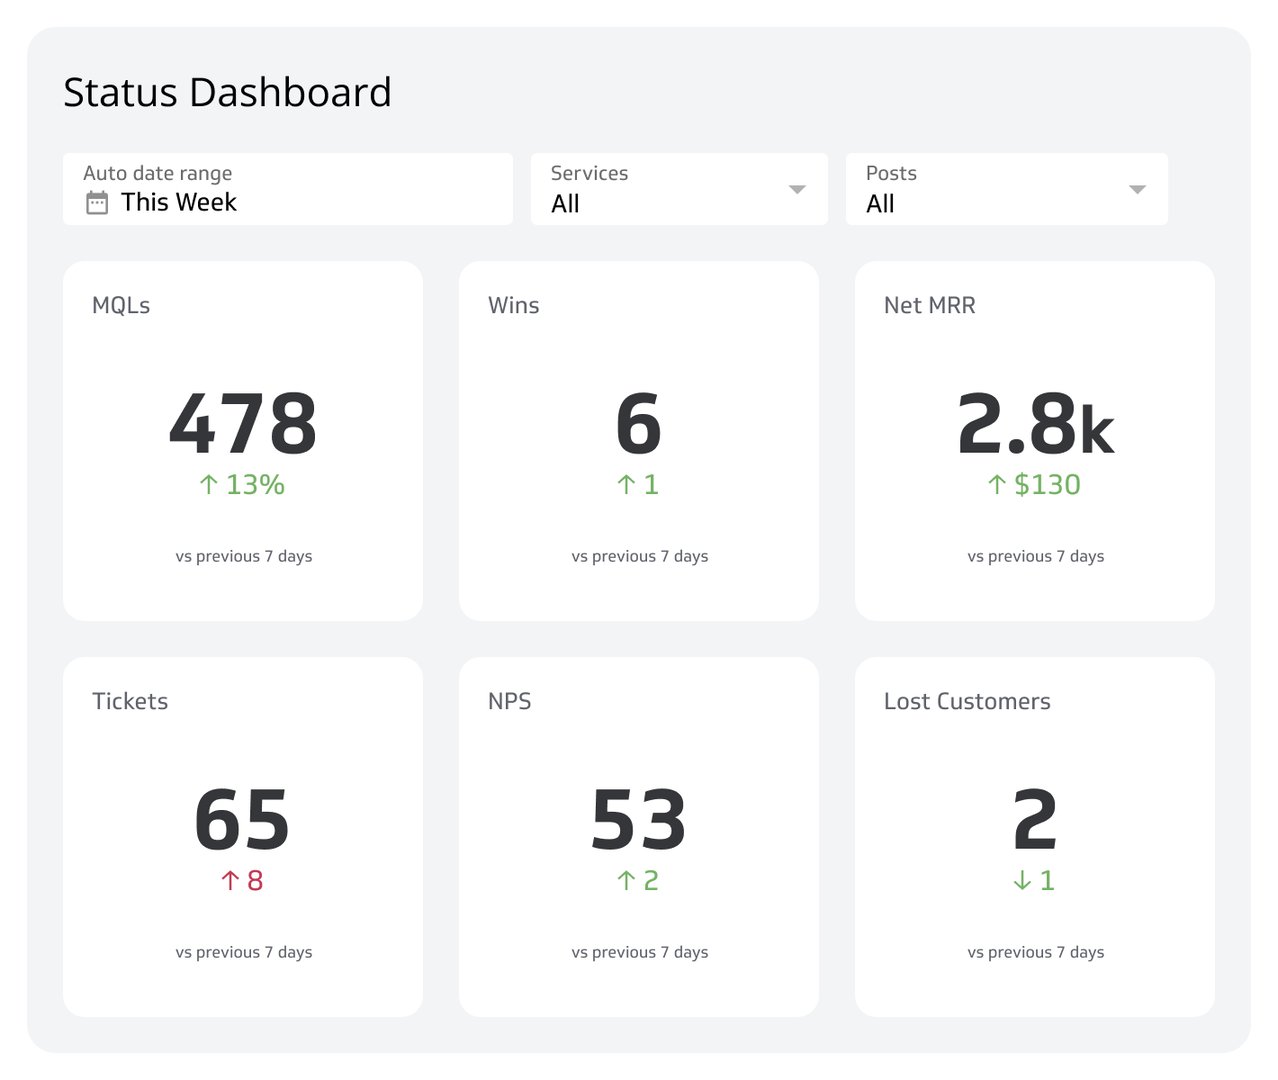
A growth dashboard tracks growth metrics across your startup. It helps you assess expansion and overall progress and identify the factors that keep the business healthy.
This dashboard can reveal useful correlations, such as how changes in support response times affect retention. It also serves as an early warning system that flags sudden drops in engagement.
Who’s it for | Growth managers, marketing directors, product managers, sales leaders |
How often it's needed | Daily, weekly, monthly, quarterly |
Covered KPIs | User acquisition rate, customer retention rate, churn rate, monthly recurring revenue (MRR), annual recurring revenue (ARR), average revenue per user (ARPU), CLV, CAC, conversion rates, activation rates, onboarding completion rates, feature adoption rates, viral coefficient, NPS, user engagement metrics, revenue growth rate, market share growth, expansion revenue, upsell/cross-sell success rates, organic traffic growth, paid traffic ROI, social media follower growth, email list growth, app store rankings, customer support ticket volume, product usage frequency, time to value, cohort analysis, customer segment growth, sales pipeline velocity, lead-to-customer conversion rate, freemium to paid conversion rate, pricing change impact |
Social Media Dashboard
For startups, social media is cost-effective and can drive awareness, engagement, and growth. Social media dashboards summarize performance across platforms. They deliver live figures that show how content lands and how quickly your footprint grows.
With this data, you can monitor and adjust your content strategy to expand your presence in the market.
Who’s it for | Social media managers, digital marketers, content creators, brand managers, community managers, company executives |
How often it's needed | Daily, weekly, monthly, quarterly |
Covered KPIs | Total followers, follower growth rate, engagement rate, reach, impressions, CTR, post frequency, best-performing content types, audience demographics, sentiment analysis, share of voice, social media traffic to website, social media conversion rate, social media ROI, response time to messages/comments, user-generated content volume, video views and watch time, story views and completion rate, hashtag performance, influencer campaign metrics, social media ad performance (CPC, CPM), social listening metrics, brand mentions, social media lead generation, post timing effectiveness, social media referral traffic, social media audience growth by platform, social share of web traffic, social media conversion path, social media-driven revenue, cost per engagement, audience overlap across platforms, dark social traffic, social media campaign performance, community growth rate, social media share of total marketing budget, brand advocacy rate, social media-driven email signups, social media content calendar adherence, social media crisis management effectiveness |
Expense Report Dashboard
An expense report dashboard tracks your startup’s spending patterns. It helps you find areas to reduce spend and improve cost control.
This dashboard also helps you reflect on resource allocation. It highlights when you’re within or over budget, and gives the data to set better policies and forecast future expenses.
Who’s it for | Financial managers, accountants, department heads, company executives, project managers, expense approvers, budget planners |
How often it's needed | Daily, weekly, monthly, quarterly |
Covered KPIs | Total expenses, expenses by category, expenses by department, expenses by employee, average expense per employee, expense trends over time, budget vs. actual expenses, expense approval time, reimbursement turnaround time, policy compliance rate, top spenders, most frequent expense types, travel expenses breakdown, expense report submission timeliness, expense report rejection rate, expense anomalies detected, cost savings from expense reduction initiatives, expense to revenue ratio, cash flow impact of expenses, expense forecast accuracy, expense report processing costs, expense report cycle time, expense policy exception rate, expense report audit findings, expense report fraud detection rate, expense categorization accuracy, expense report volume trends, expense report automation rate, expense report approval rate, recurring vs. one-time expenses, fixed vs. variable expenses, expense allocation by project or client, expense report submission method (mobile vs. desktop) |
Inventory Dashboard
Inventory dashboards provide a real-time snapshot of inventory levels. They show how much capital is tied up and how fast products move through the supply chain. Standard metrics include total inventory value, turnover, and dead stock percentage.
Regular reviews help you prevent stockouts, reduce excess inventory, and improve product management. This efficiency is critical for startups with limited resources that aim to grow quickly.
Who’s it for | Inventory managers, supply chain managers, warehouse supervisors, purchasing managers, operations executives, sales teams, financial planners |
How often it's needed | Daily, weekly, monthly, quarterly |
Covered KPIs | Total inventory value, inventory turnover rate, inventory-to-sales ratio, days of supply, stockout rate, excess stock rate, inventory accuracy, inventory shrinkage, average inventory age, slow-moving inventory, percentage of out of stock items, inventory carrying cost, reorder point adherence, safety stock levels, lead time by supplier, order fulfillment rate, perfect order rate, inventory to sales ratio, inventory write-offs, inventory obsolescence rate, economic order quantity (EOQ), cycle count accuracy, inventory forecast accuracy, inventory holding costs, inventory velocity, supplier performance metrics, inventory return rate, just-in-time (JIT) efficiency, inventory discrepancy rate, inventory-to-cash conversion cycle, average days to sell inventory, stock coverage ratio, inventory service level, inventory turnover by product category, inventory valuation method efficiency, demand forecasting accuracy, inventory replenishment cycle time, backorder rate, inventory to working capital ratio |
Sustainability Dashboard
ESG (environmental, social, and governance) matters for every business. Startups can build a strong sustainability profile from the start. By tracking resource use, social impact, and governance practices, a sustainability dashboard helps you meet ESG goals and strengthen your brand.
Who’s it for | Sustainability managers, environmental officers, operations managers, company executives, regulatory compliance officers, supply chain managers |
How often it's needed | Daily, weekly, monthly, quarterly, yearly |
Covered KPIs | Carbon footprint, energy consumption, water usage, waste generation and recycling rates, renewable energy adoption, supply chain sustainability score, employee diversity and inclusion metrics, community engagement hours, ethical sourcing percentage, greenhouse gas emissions, resource efficiency, sustainability certifications, environmental compliance rate, sustainable product revenue, circular economy initiatives, biodiversity impact, air quality index, sustainable transportation metrics, employee health and safety incidents, sustainability training completion rate, stakeholder engagement score, sustainable packaging adoption, life cycle assessment results, green building certifications, sustainable investment allocation, sustainability reporting compliance, carbon offset initiatives, water stress assessment, sustainable supplier percentage, fair labor practices compliance, sustainability innovation index, product end-of-life management, renewable energy generation, sustainable procurement rate, corporate governance score, sustainability-linked compensation metrics, sustainability-related patents, eco-efficiency indicators, social impact measurement |
Build a startup dashboard with Klips
A startup dashboard brings your key metrics into one place so you can track growth, cash, and customer signals in real time.
With flexible visualizations, Klips helps you monitor what matters and act faster. Try Klips free. No credit card required.
Related Dashboards
View all dashboards