

Summary - There comes a time in every SMB's analytics journey to upgrade to a more robust tool. Instant metrics and PowerMetrics makes it easy to get started with the depth and granularity to dig deeper as your analytics journey evolves.
Manual spreadsheet reporting takes time. The journey with an analytics tool often begins out of the necessity for easy set up, automatic updates, and easy sharing amongst your team. For example, I worked with a founder who managed all her metrics and reporting out of a spreadsheet – the sheet tracked everything and served as a single source of truth.
Distributing that spreadsheet proved to be frustrating. For team members less skilled in Excel or Google Sheets, spreadsheets create more of an “ummm” moment than an “aha!” moment. Even for those adept at working in spreadsheet land, the columns and rows of data are impenetrable without a central data narrative.
There comes a time in every SMB’s journey to upgrade to something more robust. The number of choices, however, can be daunting and confusing for those who aren’t sure where to start.
Where to start?
Starting, arguably, is the most important step in your journey to become data driven. PowerMetrics is a lightweight analytics tool that provides depth for powerful custom metric and dashboard building. But for our users, the first step isn’t always to set up a modeled data source and start creating calculated metrics.
For many PowerMetrics users, the journey begins with our library of instant metrics. As the name suggests, these metrics are quick to set up and return immediate value. They are out of the box and serve as an excellent starting point for many teams.
Let’s dig into instant metrics and learn more about this feature.
Pillars of a metric
We’ve adopted a metrics-first approach to PowerMetrics that provides enduring value to teams looking for data insights. There are 4 pillars of a great metric:
- Metrics should be expert informed and vetted to ensure standard units of measurement
- Metrics should tell a story and how that story changes over time is told through captured data history
- Metrics should enable a layer of data insights through features like historical comparisons and setting goals
- Metrics should be an integral part of business decision making
Each instant metric we’ve built in PowerMetrics introduces you to these concepts on your path to analytics success.
What are instant metrics?
Metrics are the building blocks of PowerMetrics. Behind every metric is a data model that enables metric features like data history, goals, and calculated metrics.
Instant metrics are pre-built metrics. Enter in your login credentials (such as Google Analytics, HubSpot, or Stripe) and PowerMetrics will create the data model and populate your metric’s dimensions. It takes a minute or two to populate the data and build the metric, but once it’s done, you’re ready to start exploring your data.
All our instant metrics have been set up and validated by experts in the data community. Our library of metrics, MetricHQ, documents our instant metrics in addition to metrics defined by experts that you can create using a custom metric.
Since instant metrics only require login credentials to build, it’s a good starting point to get automated metrics set up quickly and to build out a proof of concept.
Instant metrics and custom metrics
Instant metrics are prebuilt and preconfigured – they can be modified by adding goals or using them in calculated metrics. Instant metrics get you started and are excellent building blocks as you move towards custom metrics that track the unique data points behind your business.
Custom metrics are created by setting up a data source, configuring a data model from that data source, then creating the metric from that data model. This process allows for a lot of fine-tuning to measure exactly what you want.
Instant metrics and dashboards
A metric is a metric whether it’s an instant metric, custom metric, or a calculated metric. Explore your metrics using any data visualization type, add a goal, or add them to a dashboard.
Metrics are exceptionally powerful when you display them on a dashboard using different visualization types, like a bar chart, pie chart, or bubble chart.
Metrics can be added to dashboards with a filter to give a detailed view of one part of your process, such as showing only organic traffic from the web users metric. Filters are supported at the dashboard level as well - meaning you can add a filter to your dashboard and it will be applied to any metric that contains those dimensions.
Exploring instant metrics
Instant metrics open you up the world of metric creation in PowerMetrics. Instant metrics do more than paint a picture of what is possible – they help you track what matters most to your business.
We organize our instant metrics by service. Let’s look at some of the most popular instant metrics by data service.
Google Analytics 4
Google Analytics 4 is the new norm for web analytics. With Google’s announcement that it is deprecating Universal Analytics (UA), there’s no better time to start switching your web metrics over to GA4.
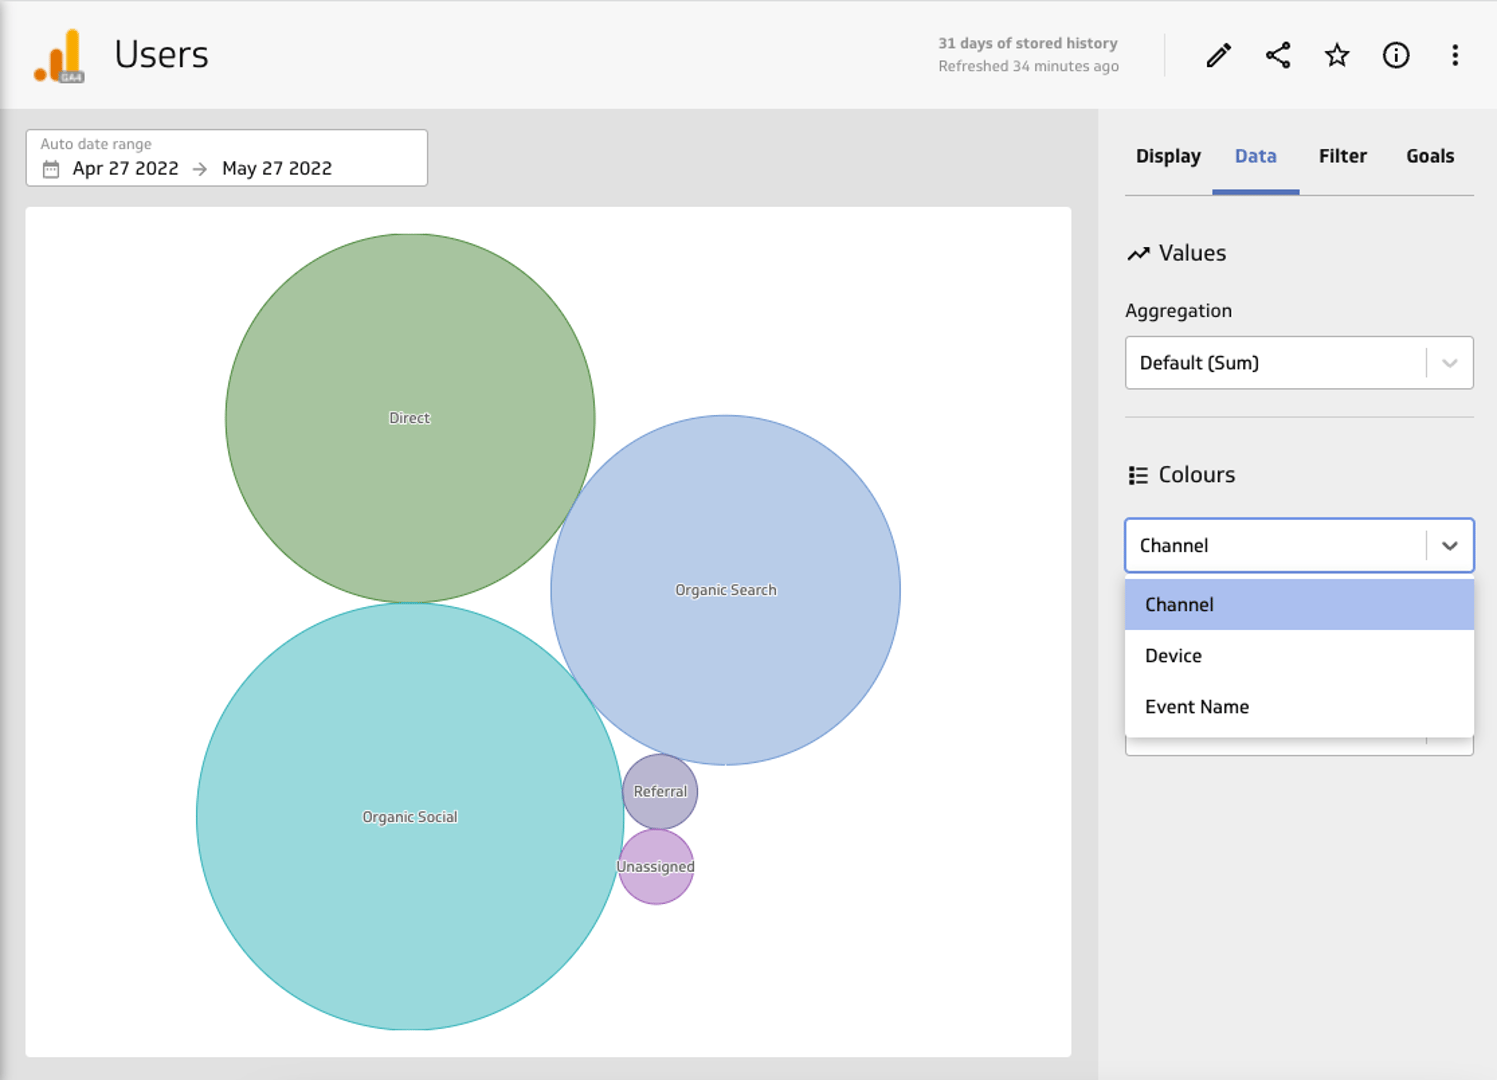
Web Users
Tracking website visitors or web users is an essential part of marketing reporting. The metric comes with 3 dimensions you can segment:
- Channel
- Device
- Event Name
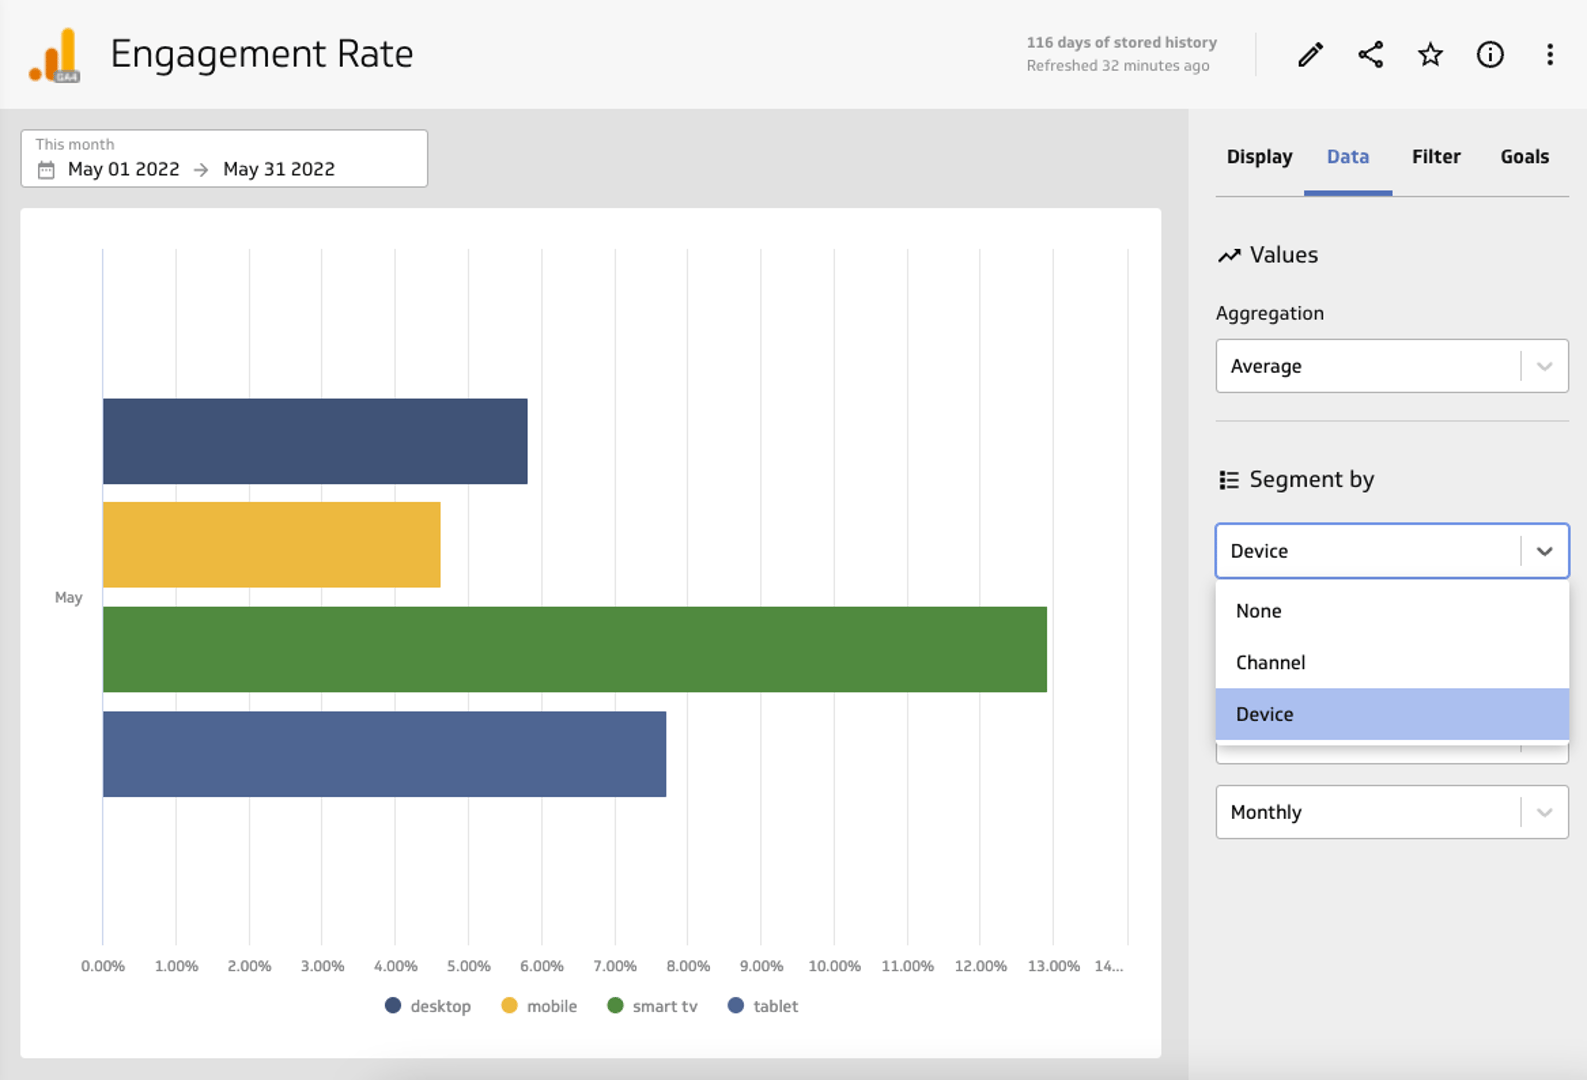
User Engagement Rate
Google is shifting focus away from user based reporting to event-based reporting in GA4. This is evident in the retirement of the bounce rate and the renewed focus on the engagement rate metric. Engagement rate tracks the percentage of users that are actively engaged on your site or app for 10 seconds, have two or more screen views, and/or have a conversion event. You can segment by channel or device.
HubSpot
For many growing teams, HubSpot serves as the central nervous system for sales, marketing, and success teams. HubSpot metrics are frequently combined with metrics from other systems (like Google Analytics or Stripe) to get a more complete view of your business funnel. Check out this blog post on calculated metrics to learn more about how this works in PowerMetrics.
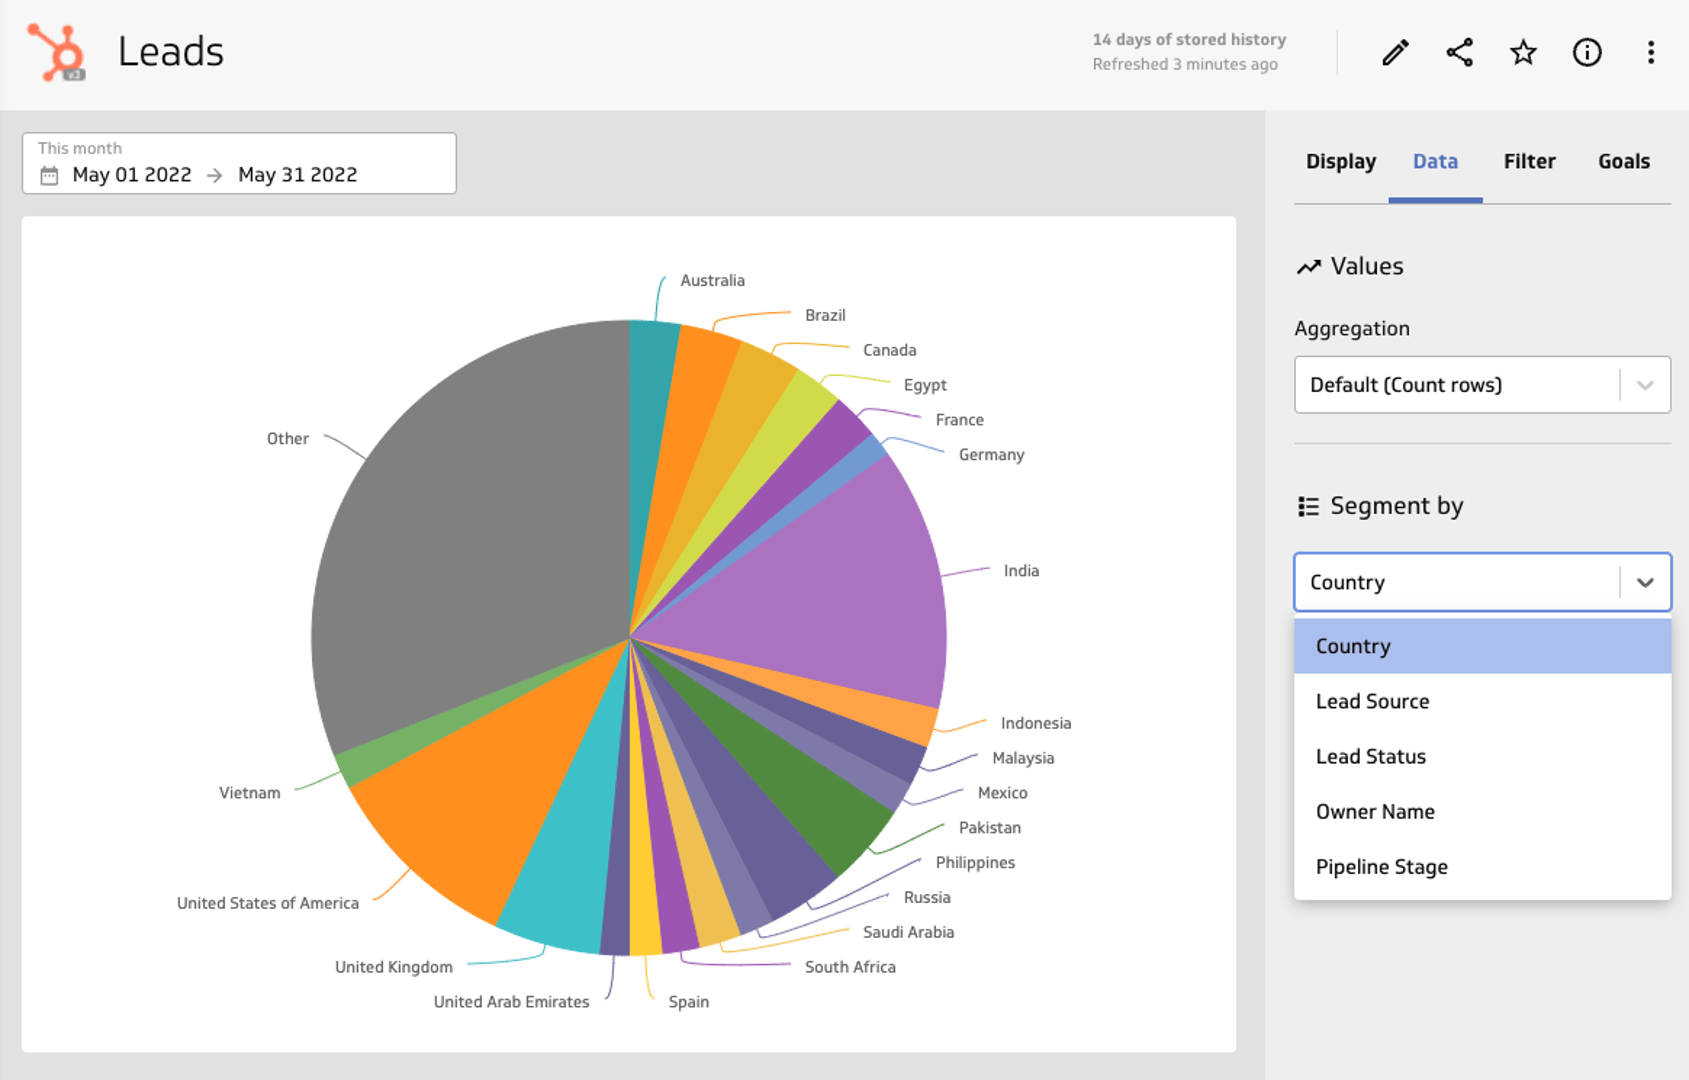
Leads
The Leads metric is top of mind for demand generation teams tasked with filling the sales and marketing funnel. This metric comes out of the box with useful dimensions for quick analysis:
- Country
- Lead Source
- Lead Status
- Owner Name
- Pipeline Stage
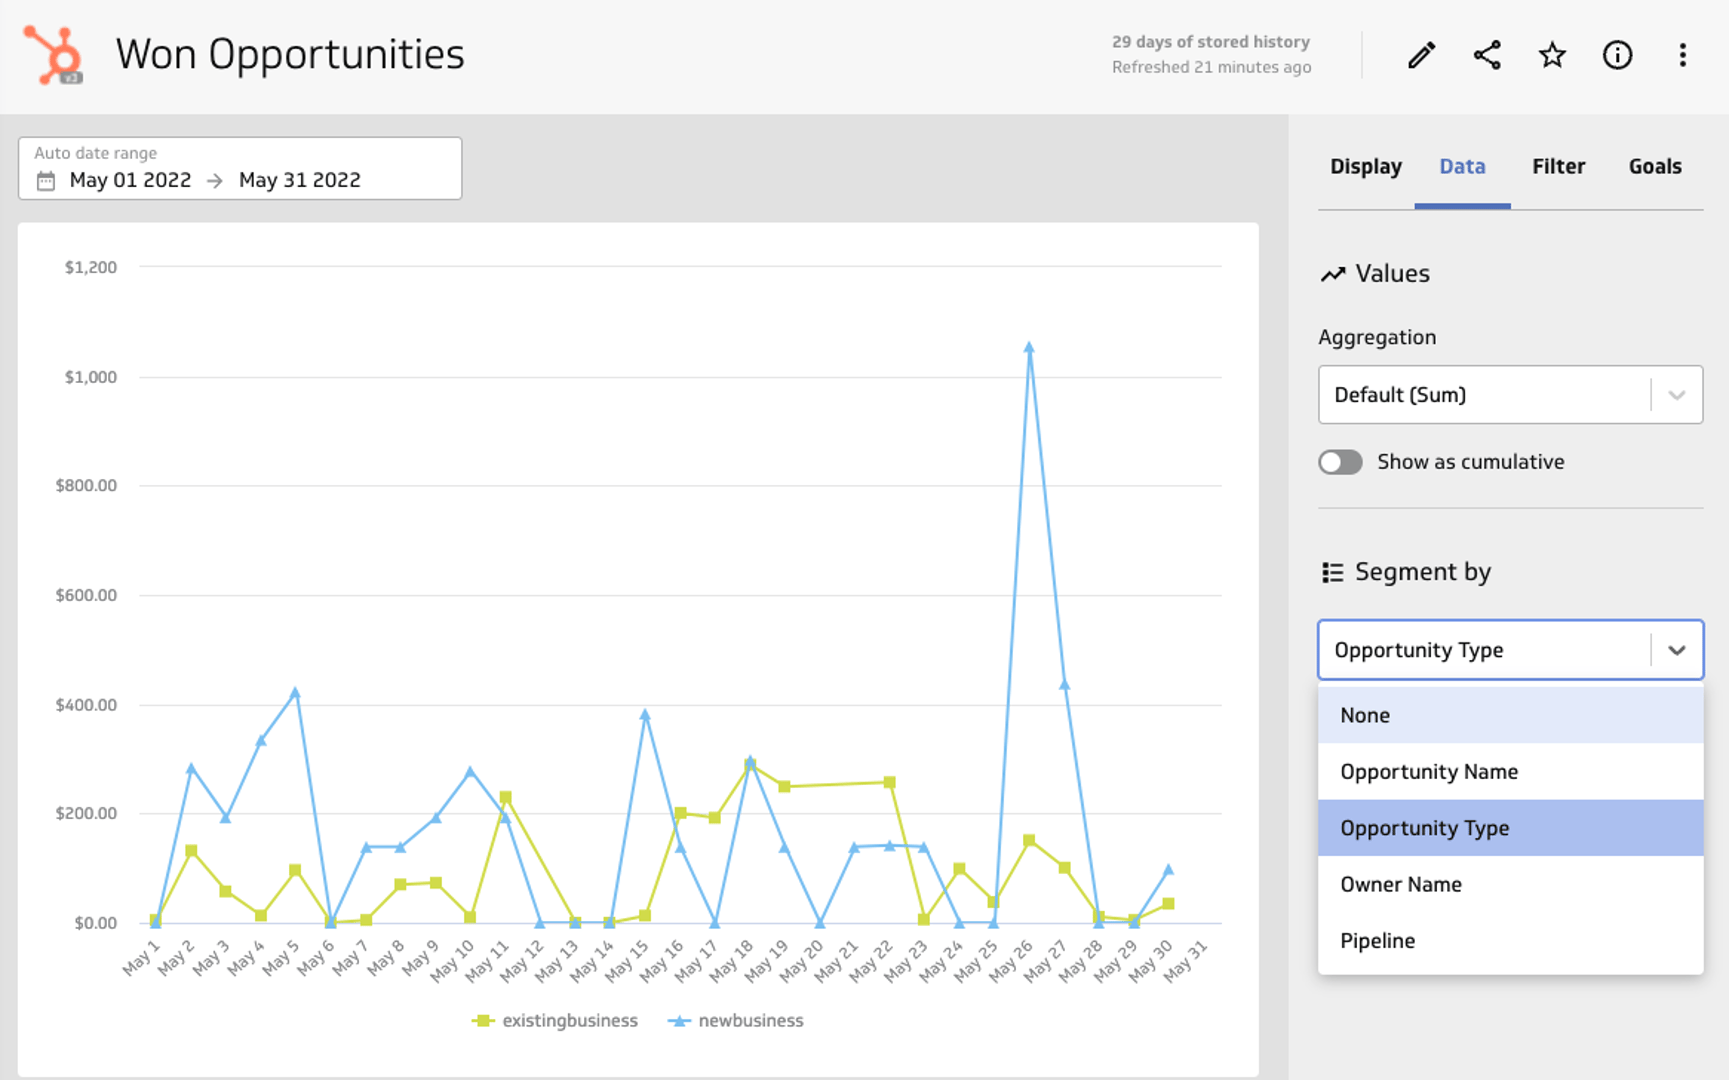
Won Opportunities
Track the revenue generated from Won Opportunities in your HubSpot pipeline. This metric comes with a few dimensions worth paying attention to:
- Opportunity Name
- Opportunity Type
- Owner Name
- Pipeline
Stripe
Stripe is the payment infrastructure for the internet, and one of the most important data sources for tracking revenue and finances. PowerMetrics has a native integration to Stripe, meaning you can bring all your data into the Stripe Dashboard. You can learn more about the Stirpe PowerMetrics integration here.
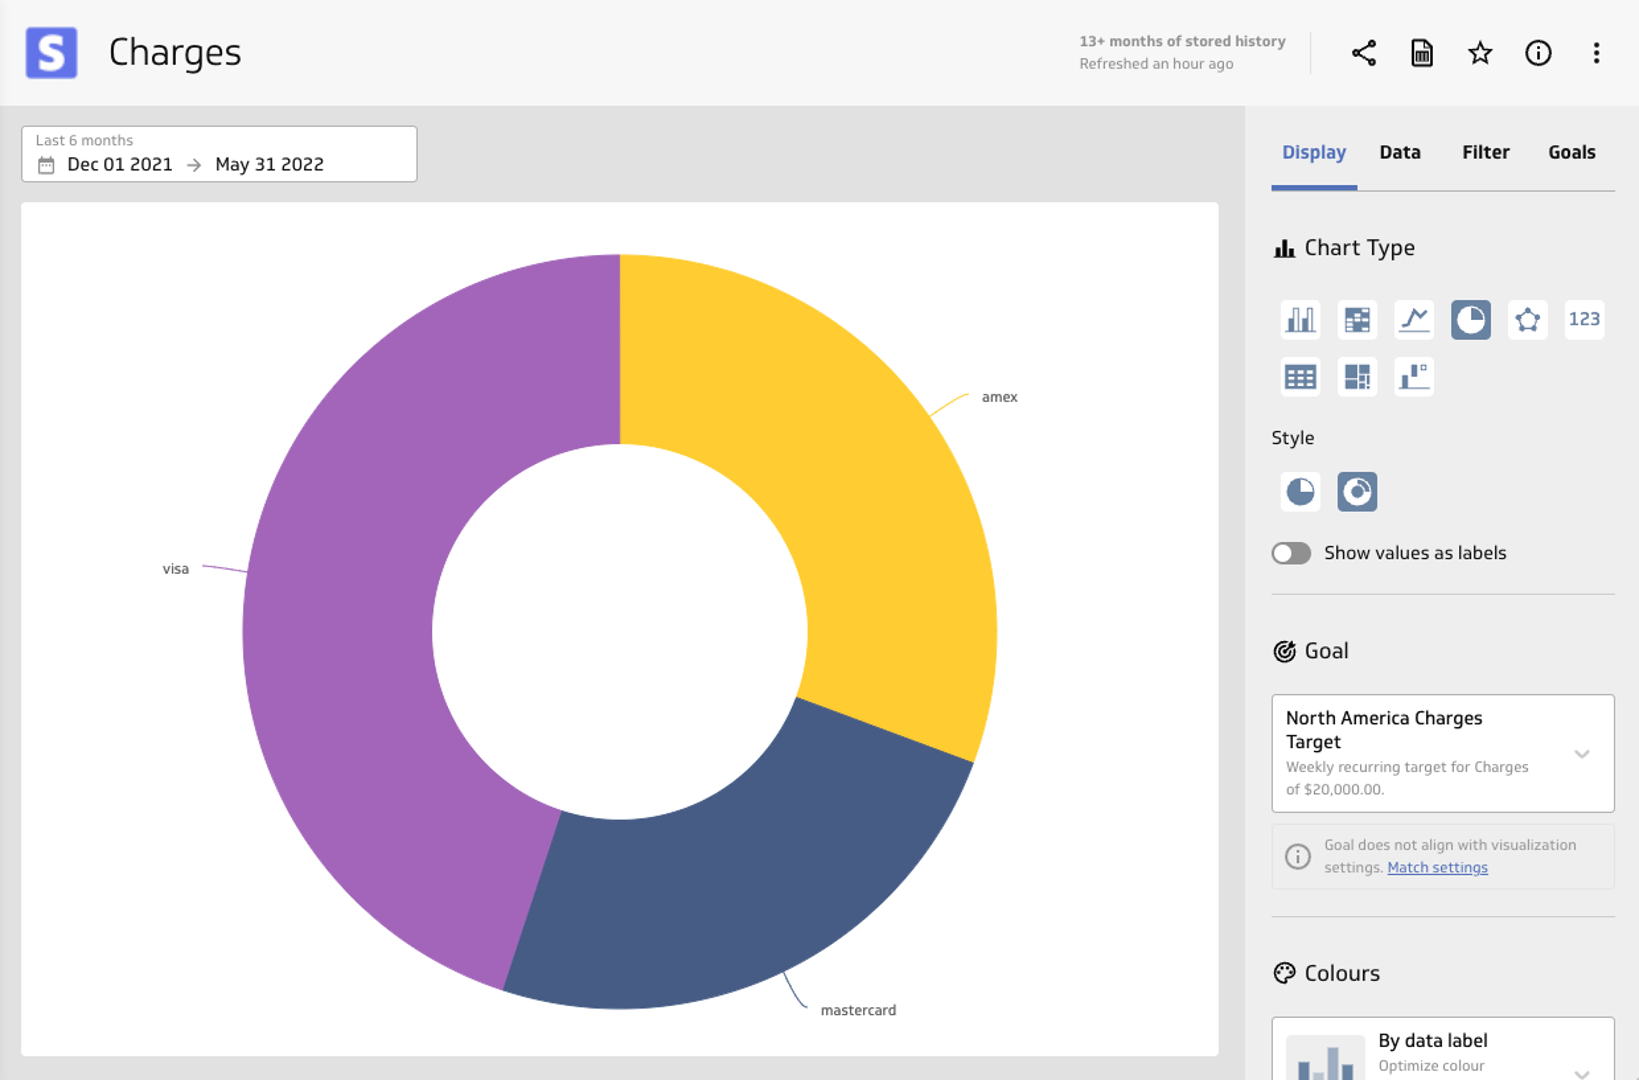
Charges
This metric tracks the total revenue earned from payments after deducting fees, refunds, transfers, and disputes. Charges comes with important dimensions:
- Card Network
- Country
- Currency
- Disputed
- Refunded
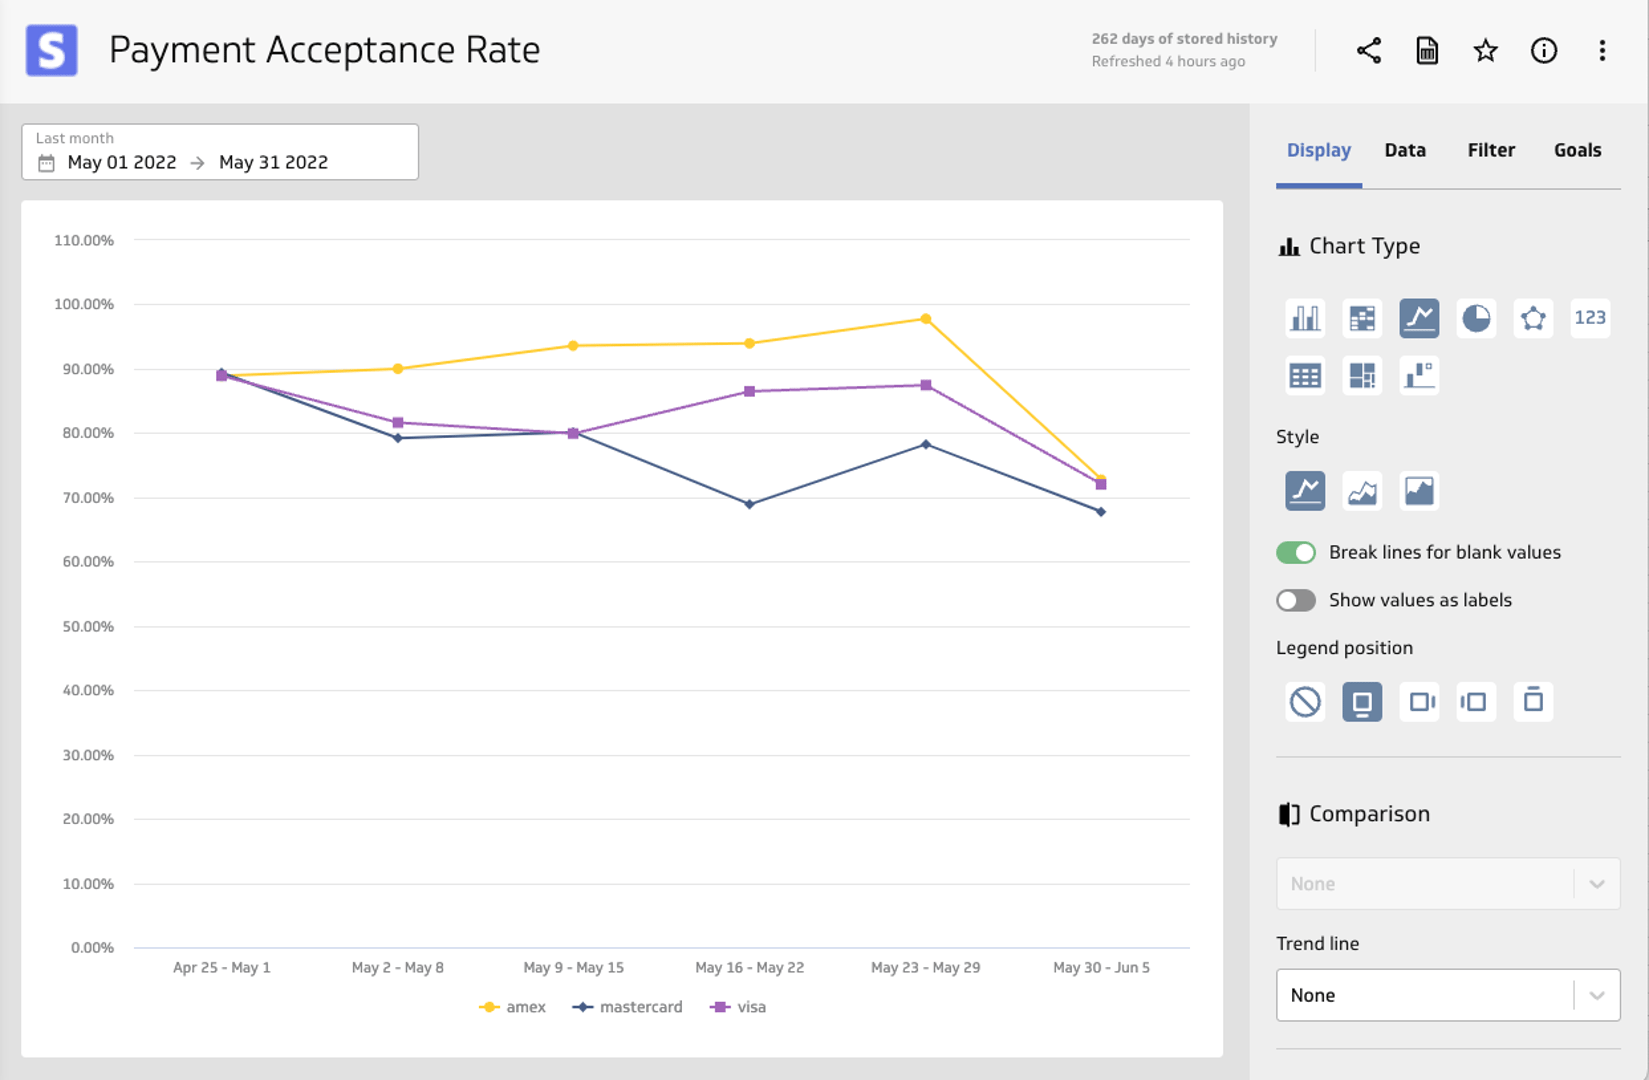
Payment Acceptance Rate
Are payments being accepted? This metric is important to track to see if there are any oddities or exceptions. For example, you can track this metric to see if there are any issues with payments from a specific country or card network. The following dimensions are included:
- Card Network
- Currency
- Country
Finance & Accounting Metrics
While we track and get value from a wide variety of metrics, the litmus test for your business is your finance metrics. As we saw with the Stripe metrics, these metrics are critical for making sure your bank account numbers are moving in the right direction.
QuickBooks
Choose from over 20 instant metrics to track all things finance from QuickBooks. Here are a few QuickBooks metrics you may want to try:
Xero
With 15 instant metrics to choose from, you can track invoicing, bank reconciliation, bookkeeping, and revenue. Here are a few Xero instant metrics to get you started:
Social Media Metrics
Social media KPIs from services like Twitter, LinkedIn, Facebook, and Instagram help you adjust and optimize your marketing campaigns in real-time. Check out the instant metrics available for these services.
Digital Advertising Metrics
Modern marketers are blessed with the ability to track and fine-tune their ad campaigns down to the last penny spent. At the center of this is a culture of reporting and accountability. Here are some instant metrics that our customers use to measure their advertising ROI.
Facebook Ads
Google Ads
LinkedIn Ads
Putting your metrics together on a dashboard
Once you’ve created instant metrics, the next step is to add them to a dashboard. Remember: you can add multiple instances of the same metric to a dashboard. Use a line chart to show trends over time, a donut chart to show a detailed breakdown, and a single numeric value to show an aggregate value.
Instant metric provides the quickest way to get started with PowerMetrics. Once you’re started, you’ll open the door to exploring custom metrics and digging deep into your data.
Related Articles
Case Study: How Media Propulsion Laboratory improved client analytics with the PowerMetrics – BigQuery integration
By Cathrin Schneider — September 12th, 2024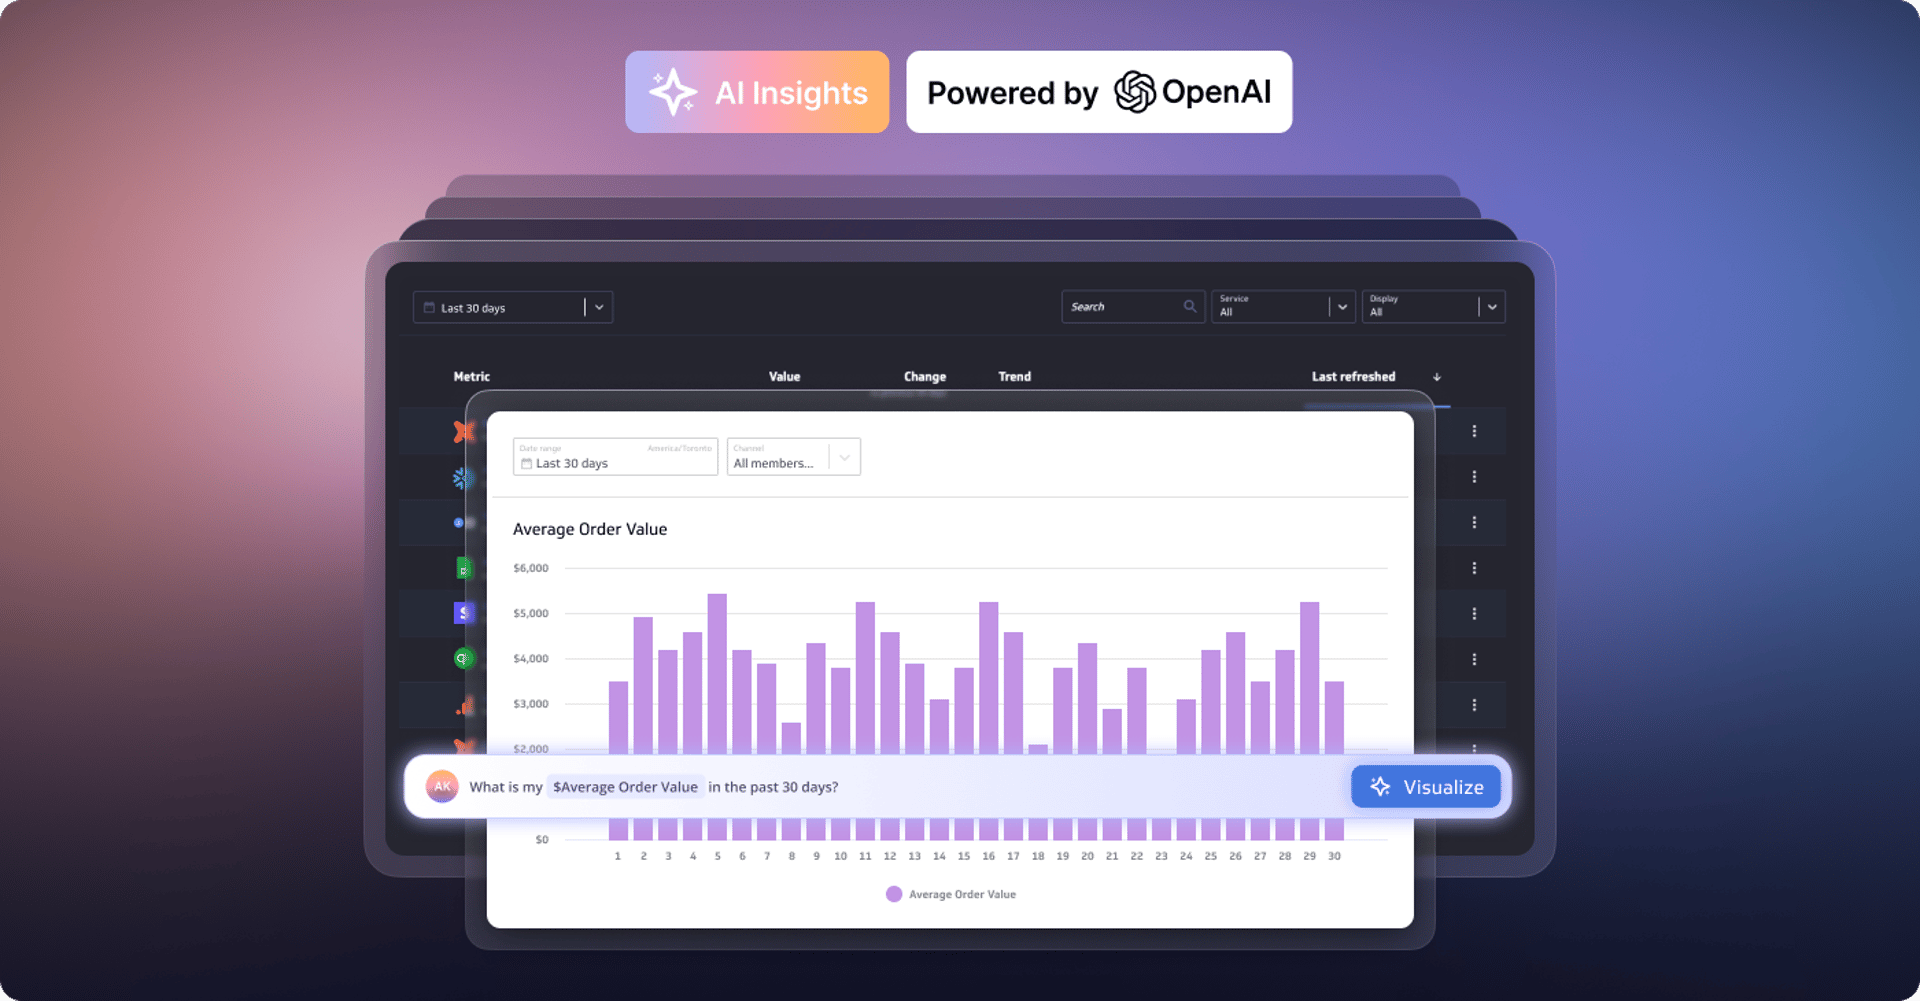
Metrics provide rich context for better AI: Introducing the new PowerMetrics AI experience
By David Mennie — June 21st, 2024
PowerMetrics - New data warehouse integrations and Cube semantic layer support
By David Mennie — June 14th, 2024