Financial Dashboard
Centralize and visualize your financial data to make faster, more confident decisions.
What is a financial dashboard?
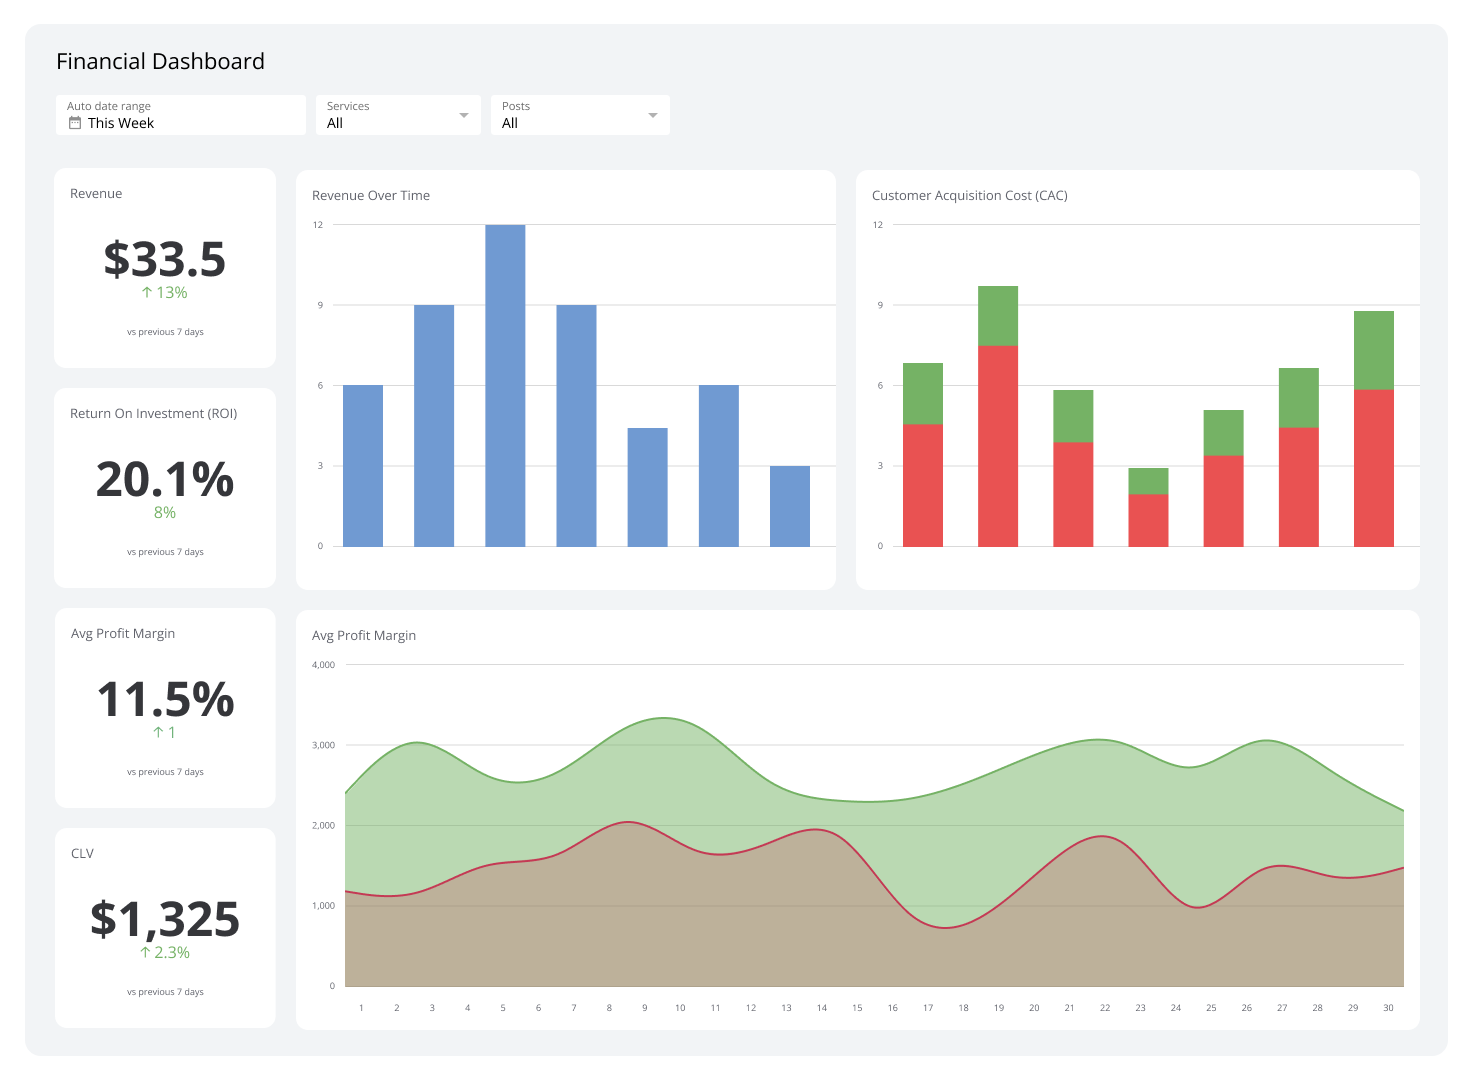
A financial dashboard is a centralized tool that displays your company's financial health in real time. It consolidates data from multiple sources into a single visual interface, making it easier to understand complex financial information at a glance.
You can use a financial dashboard to monitor revenue, expenses, profits, and other critical financial metrics. They eliminate time spent on manual data analysis, freeing you to focus on strategic planning and growth.
These dashboards are highly customizable, letting you focus on the metrics most relevant to your financial goals and decision-making needs.
Financial dashboard examples
Below are six financial dashboard examples to inspire your own.
CFO dashboard
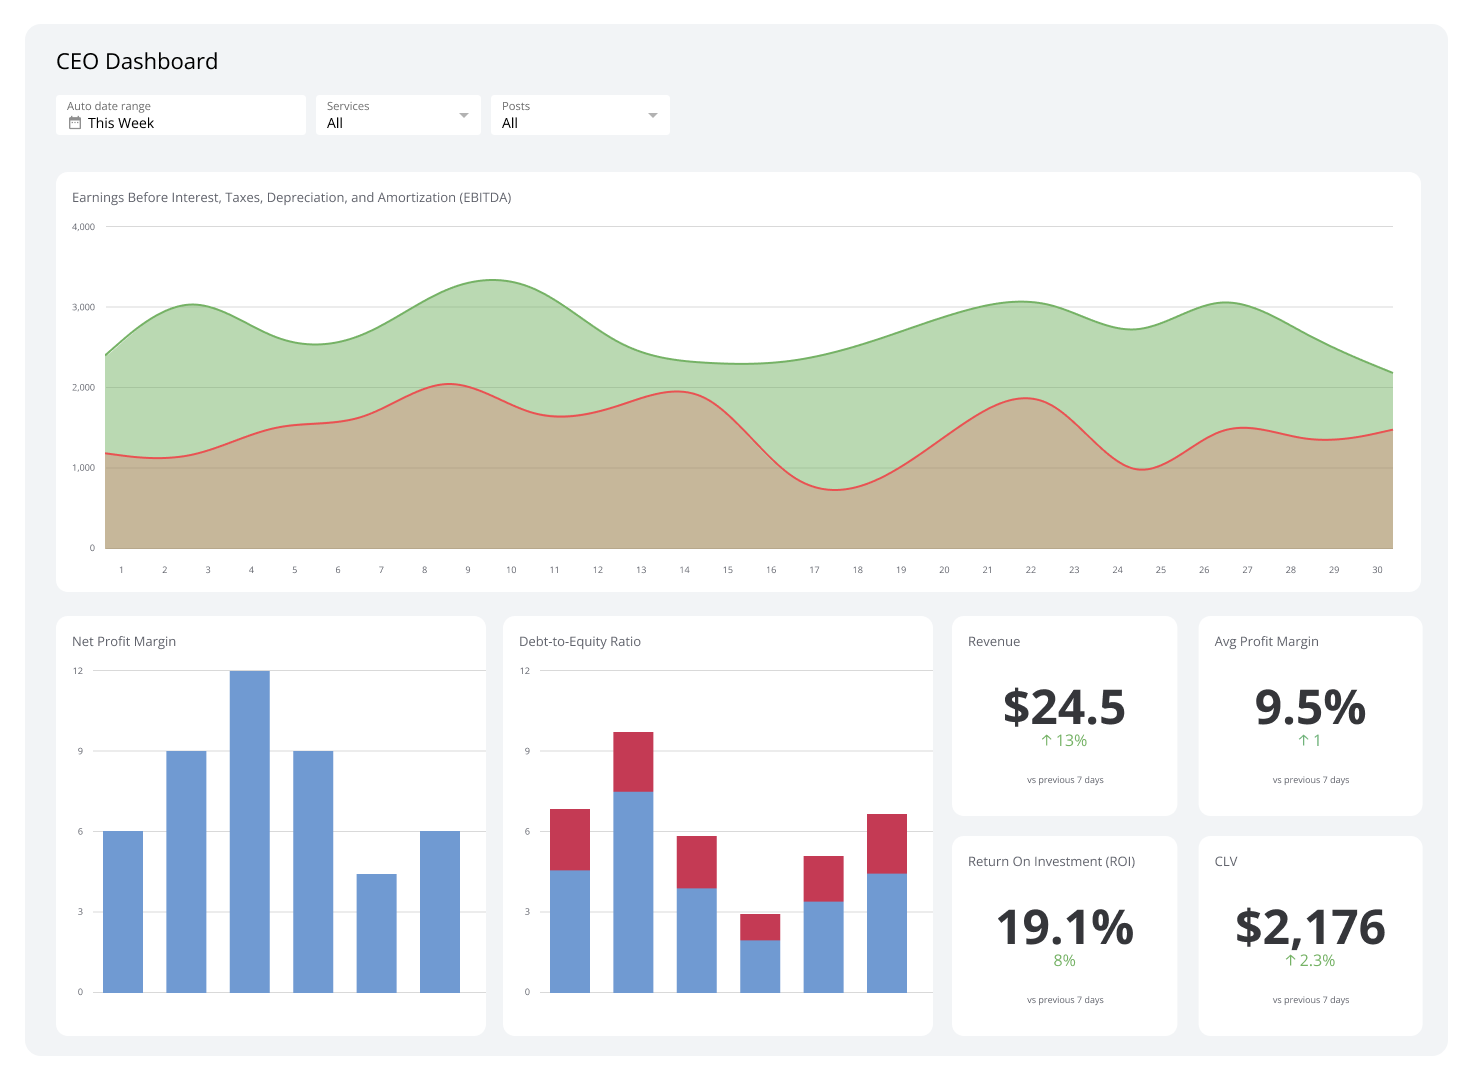
A CFO dashboard gives you a comprehensive view of your company's financial standing and health. It delivers live financial data, allowing you to quickly respond to issues such as rapid declines in revenue.
The dashboard also helps you spot opportunities—like market trends—that can boost sales. A CFO dashboard makes it possible to immediately evaluate the impact of cost-cutting initiatives and measure the effectiveness of ongoing financial strategies.
| Who's it for | Chief financial officers (CFOs), financial controllers, finance managers, accounting teams, budget analysts, investment analysts |
|---|---|
| How often it's needed | Daily, weekly, monthly, quarterly, yearly |
| Covered KPIs | Revenue, net profit margin, gross profit margin, operating income, cash flow, accounts receivable turnover, accounts payable turnover, working capital, debt-to-equity ratio, return on assets (ROA), return on equity (ROE), current ratio, quick ratio, cost of goods sold (COGS), earnings before interest, taxes, depreciation, and amortization (EBITDA), operating expenses, capital expenditures (CapEx), budget variances, financial forecasting accuracy, investment performance, liquidity ratios, credit risk exposure, key performance trends over time |
Revenue metrics dashboard
A revenue metrics dashboard delivers a clear overview of your company's income generation performance. By visualizing revenue growth against targets, it helps you analyze the effectiveness of pricing strategies and sales tactics. Revenue dashboards also uncover trends in customer behavior, product performance, and market opportunities to boost revenue.
| Who's it for | Chief revenue officers (CROs), CFOs, sales managers, marketing managers, business development teams, revenue analysts |
|---|---|
| How often it's needed | Daily, weekly, monthly, quarterly, yearly |
| Covered KPIs | Revenue growth rate, recurring revenue (monthly recurring revenue or annual recurring revenue), revenue by product or service, revenue by region, total revenue, customer acquisition cost (CAC), customer lifetime value (CLV), average revenue per user (ARPU), churn rate, upsell and cross-sell revenue, gross profit margin, net profit margin, revenue forecast accuracy, sales pipeline value, conversion rates, deal size, contract renewal rates, revenue per employee, revenue from new versus existing customers |
Cash flow dashboard
A cash flow dashboard tracks the movement of money in and out of your business, giving you live visibility into its liquidity. It monitors cash inflows from sales and cash outflows for expenses, payroll, and debt repayments, so you can accurately forecast future cash needs and prevent shortfalls.
With this dashboard, you can more effectively manage budgets, make informed financial decisions, and optimize operations.
| Who's it for | CFOs, financial controllers, accountants, finance managers, treasury teams, cash flow analysts, business owners |
|---|---|
| How often it's needed | Weekly, monthly, quarterly, yearly |
| Covered KPIs | Total cash inflows, total cash outflows, net cash flow, operating cash flow, investing cash flow, financing cash flow, cash flow forecast, free cash flow, cash burn rate, days sales outstanding (DSO), days payable outstanding (DPO), days inventory outstanding (DIO), cash conversion cycle, working capital, accounts receivable turnover, accounts payable turnover, liquidity ratios (current ratio, quick ratio), debt repayment schedules, CapEx, ending cash balance by period |
Fundraising insights dashboard
Fundraising dashboards track the performance of your organization's fundraising campaigns and donor contributions. They display figures behind funds raised, average donation amount, fundraising goal progress, and donor engagement.
With one, you can acquire the data needed to grow stronger relationships with donors and track donation trends to predict future fundraising outcomes—essential for long-term financial planning.
| Who's it for | Nonprofit executives, finance managers, budget analysts, financial controllers, development directors, fundraising managers, donor relations teams, grant managers, finance departments, event coordinators, board members |
|---|---|
| How often it's needed | Daily, weekly, monthly, quarterly, yearly |
| Covered KPIs | Fundraising goal progress, number of active donors, donor retention rate, average donation amount, donor acquisition cost, donor lifetime value, top donors by contribution, campaign-specific funds raised, grant funding received, total funds raised, online donation performance, recurring donation metrics, event fundraising totals, pledge fulfillment rates, donor segmentation breakdowns, email open and click-through rates, social media engagement for campaigns, cost per dollar raised, peer-to-peer fundraising activity |
Expense analysis dashboard
An expense analysis dashboard provides a detailed view of your company's spending patterns to help you track and manage costs effectively. It identifies where costs can be reduced without compromising efficiency.
Beyond monitoring expenses, this dashboard uncovers patterns that might go unnoticed—such as recurring overspending and underutilized budgets. It segments data by category, department, or timeframe to give you a granular view of your organization's spending habits.
| Who's it for | CFOs, finance managers, accountants, department heads, budget analysts, procurement teams, finance departments, operational managers |
|---|---|
| How often it's needed | Daily, weekly, monthly, quarterly, yearly |
| Covered KPIs | Expense-to-revenue ratio, budget utilization rate, departmental spending breakdown, expense category distribution (travel, marketing, payroll), total expenses, cost per employee, variance between actual and budgeted expenses, recurring expense trends, vendor payments, overdue payments, procurement cycle time, operating cost ratio, cost savings from negotiated contracts, capital expenditure tracking, indirect cost allocation, month-over-month expense changes |
Sales and product dashboard
A sales and product dashboard helps your company monitor and evaluate sales performance using clear, real-time insights from key sales metrics like revenue, deal conversion rates, and customer acquisition costs.
This dashboard gives sales teams and finance departments visibility into sales performance, making it easier to track progression. It also showcases sales trends, uncovers bottlenecks in the sales pipeline, and supports informed decisions that drive your company's sales forward.
| Who's it for | Sales managers, account executives, business development representatives, regional sales directors, chief sales officers (CSOs), marketing and sales alignment teams, strategic planning teams |
|---|---|
| How often it's needed | Daily, weekly, monthly, quarterly, yearly |
| Covered KPIs | Total sales revenue, sales growth rate, revenue by product or service, regional sales performance, sales by channel, average deal size, sales cycle length, customer acquisition cost, customer lifetime value, lead-to-close conversion rate, sales forecast accuracy, pipeline value by stage, win rate, opportunity-to-lead ratio, salesperson performance rankings, churn rate, upsell and cross-sell rates, quota attainment, sales activity metrics, discount utilization rate |
Profit and loss dashboard
A profit and loss dashboard offers a detailed, real-time view of your company's financial health by breaking down revenue, expenses, and net profit. It goes beyond simple tracking to identify cost drivers, revenue growth opportunities, and profitability bottlenecks.
With these insights, you can optimize pricing strategies, streamline operations, and align financial outcomes with strategic profit goals—making it a critical resource for sustainable growth.
| Who's it for | CFOs, financial controllers, accountants, business unit managers, chief executive officers (CEOs), board members, investors |
|---|---|
| How often it's needed | Daily, weekly, monthly, quarterly, yearly |
| Covered KPIs | Cost of goods sold (COGS), gross profit, gross margin percentage, operating expenses, net operating income, net profit, net profit margin percentage, revenue by product or service, revenue by region or channel, expense breakdown by category, EBIT, EBITDA, year-over-year profit growth, operating cash flow, income-to-expense ratio, budget variance, tax liabilities |
Analyze important financial data using financial dashboards
A financial dashboard provides real-time insights into your company's financial health by consolidating data into key metrics like revenue, expenses, and cash flow. This type of dashboard helps you evaluate the profitability of your products, monitor trends, and identify areas for improvement.
Klipfolio's financial dashboards are customizable to fit your needs. Try them out today!
Frequently asked questions
How do I create a finance dashboard?
To create a finance dashboard:
- Start by identifying the financial metrics you want to track (revenue, expenses, or profit margins).
- Connect your data sources, such as QuickBooks, Excel, or Google Sheets, to Klipfolio.
- Use pre-built templates or customize your own dashboard with visualizations like bar charts, line graphs, and pie charts.
- Share your dashboard with your team for real-time insights and updates.
You can also use an intuitive platform like Klipfolio that walks you through the steps and saves certain metrics so you don't have to rebuild anything from scratch.
Can I create a financial dashboard in Excel?
Yes, you can create a financial dashboard in Excel using pivot tables, charts, and slicers. However, dashboard platforms like Klipfolio offer automation, integrations, and a user-friendly interface, making it easier to update and share dashboards without manual work.
What is the best chart to use for financial dashboards?
The best chart for a finance dashboard depends on the type of data you're analyzing:
- Line charts track trends over time, like monthly revenue.
- Bar charts compare categories, such as expenses by department.
- Pie charts show proportions, like expense distribution.
Can I share my financial dashboard with others?
Yes! Klipfolio allows you to securely share financial dashboards via email links, embedded views, or live presentations. Your team can access real-time data updates without requiring additional downloads.
Why should I use a dashboard platform for financial analysis?
Dashboard platforms like Klipfolio simplify financial analysis by automating data updates from multiple sources. They offer a centralized view of all key financial metrics, allowing you to easily monitor and assess your financial health in one place.
They also provide customizable visualizations tailored to the specific insights you need, enhancing your overall understanding of financial data. This improves efficiency and saves considerable time compared to manually updating Excel spreadsheets.
At a glance
Focus Area
Financial performance monitoring and analysis
Metrics List
Revenue, expenses, cash flow, profit margins, budget variance, liquidity ratios
Related Dashboards
View all dashboards