Track ad campaign performance with PowerMetrics
Cervinodata is a powerful solution to organize your current and historical ad campaign data. The interface, designed with marketers in mind, pulls in the ad campaign data that fuels your acquisition strategies.Level up your ad campaign reporting
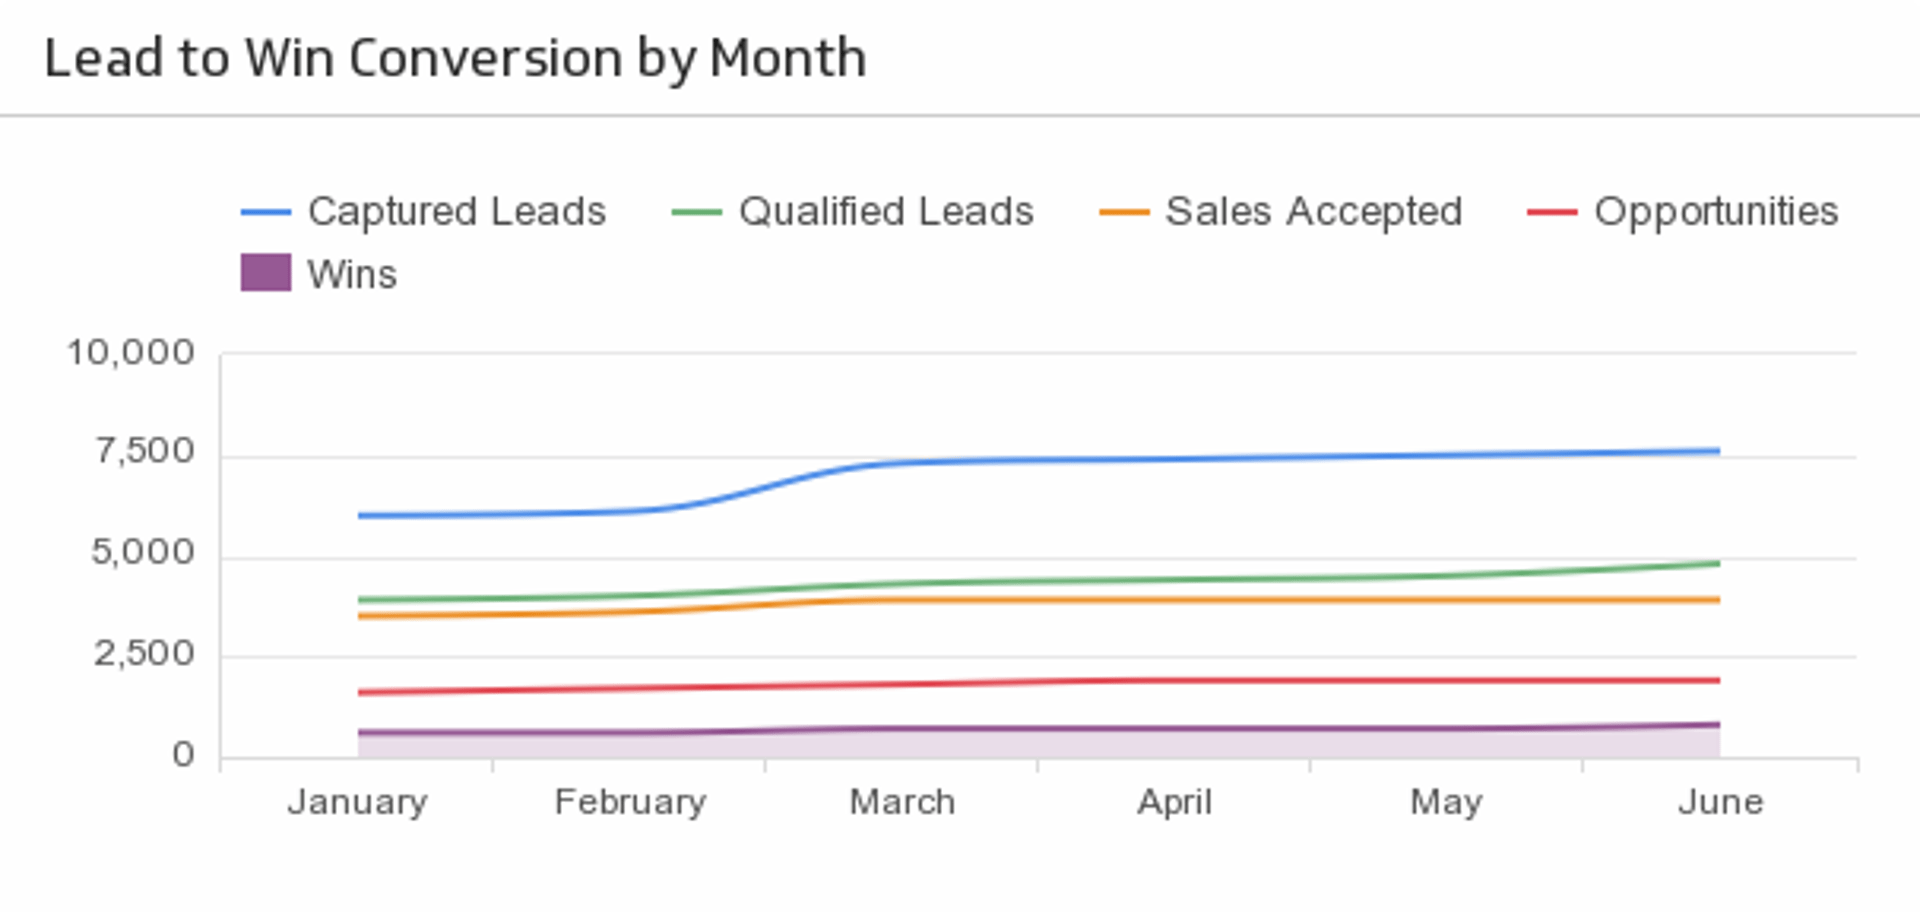
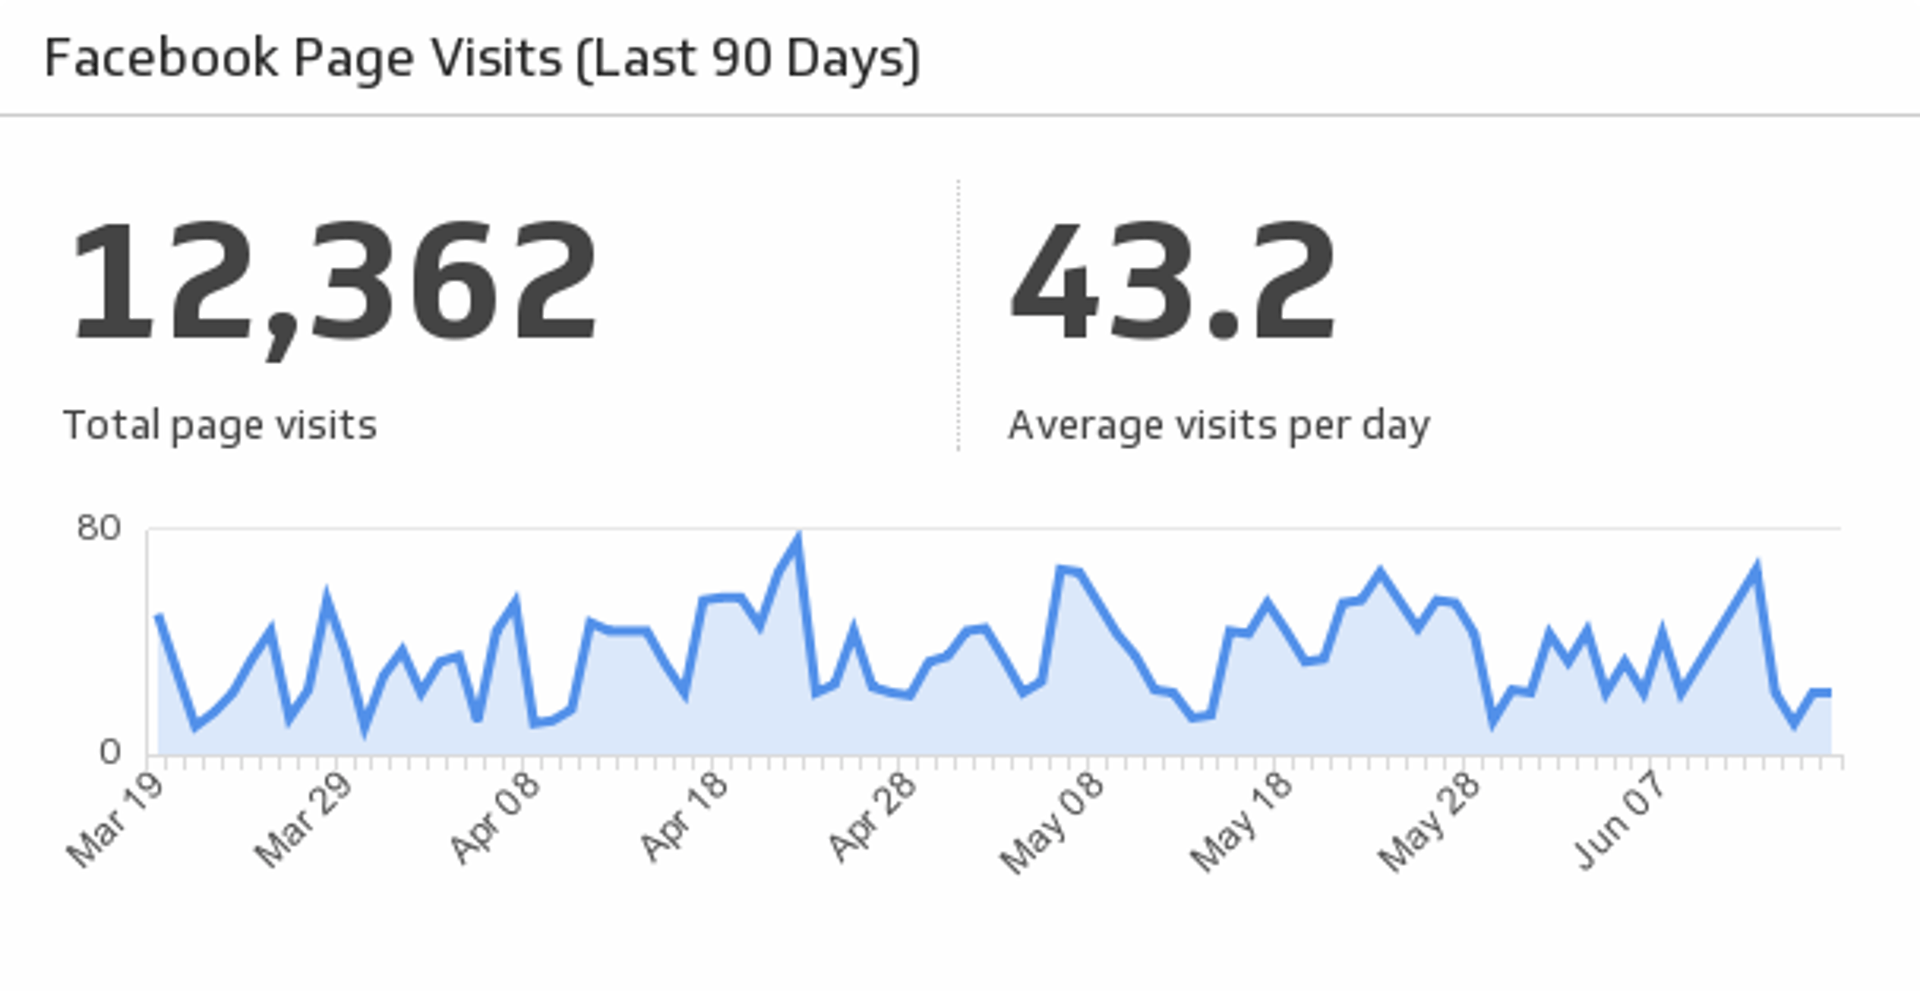
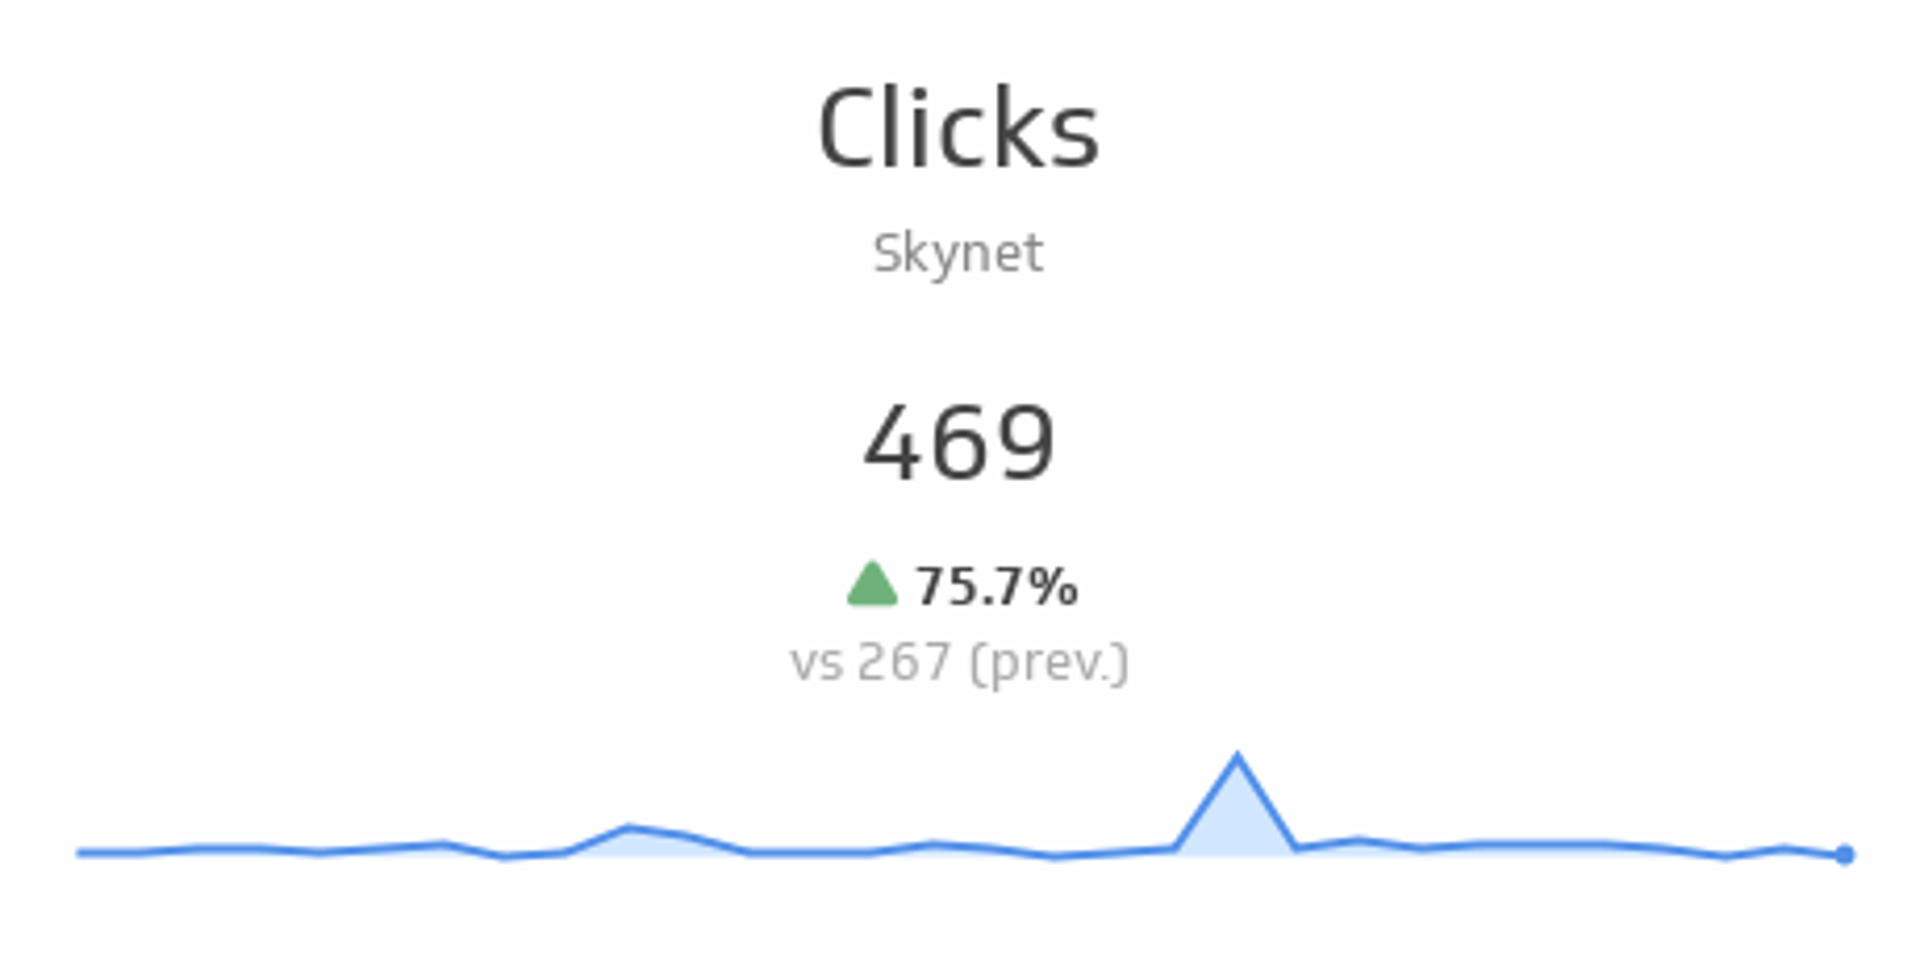
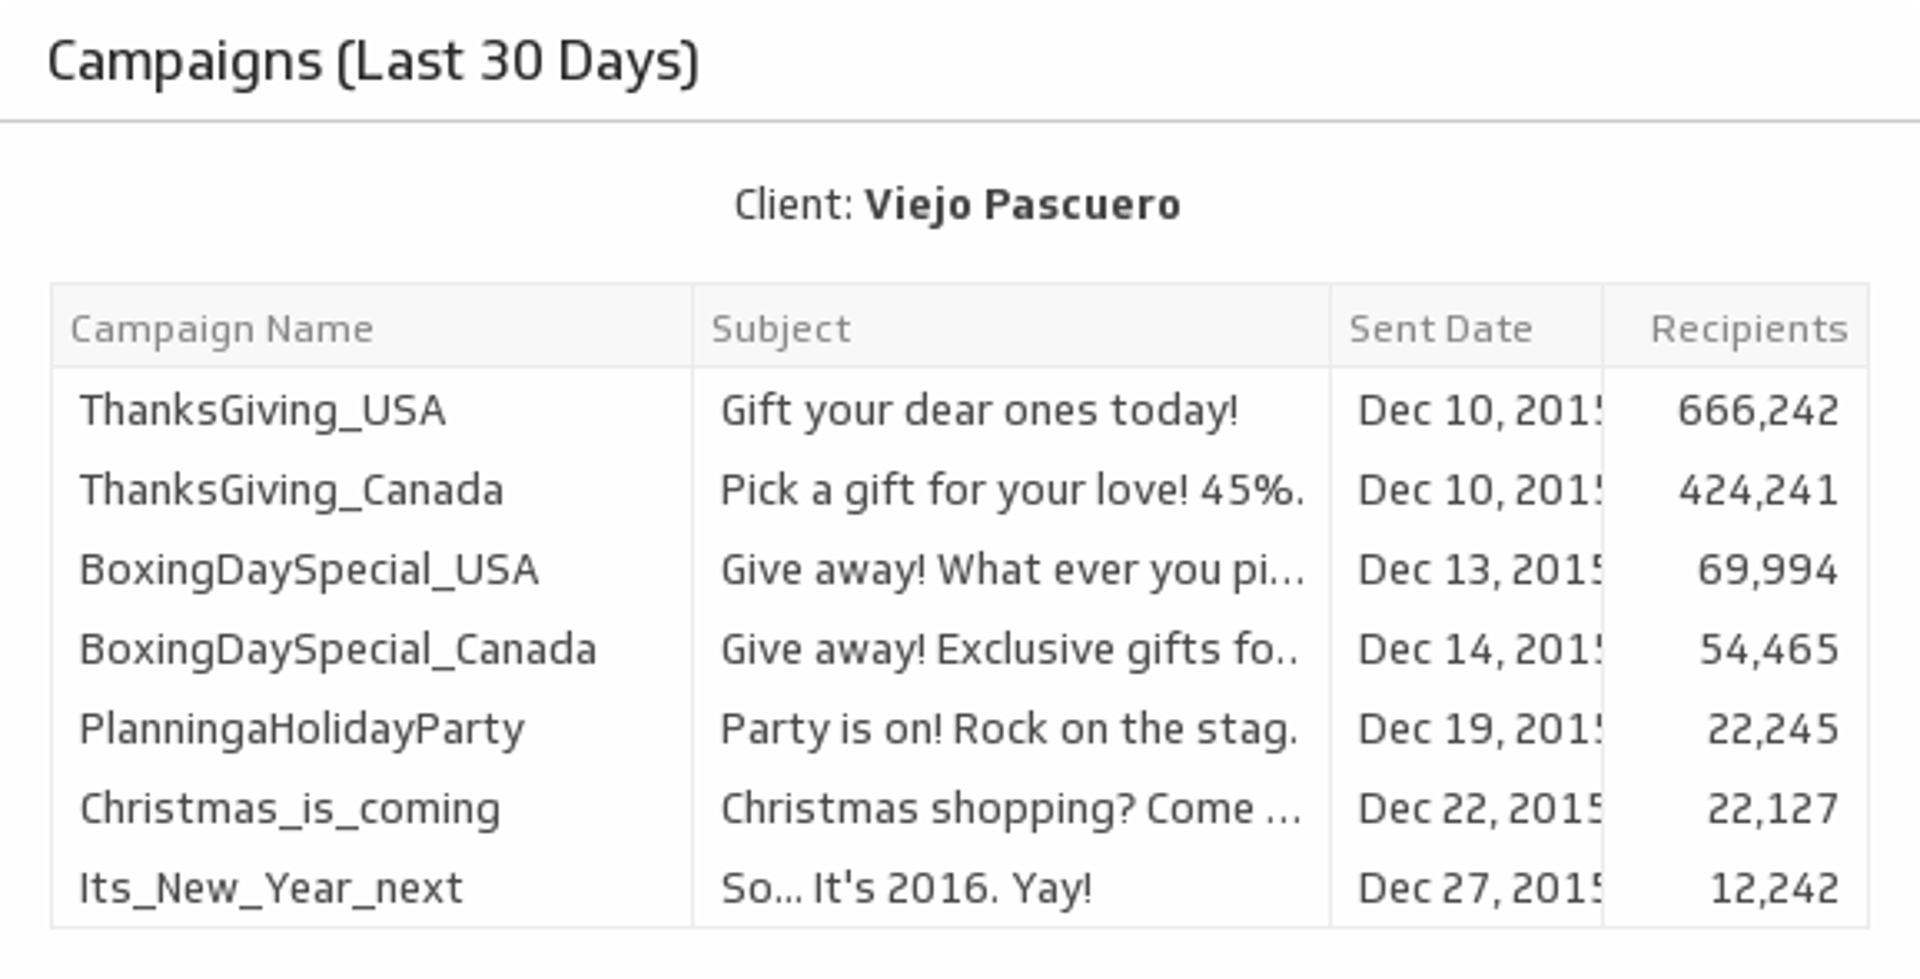
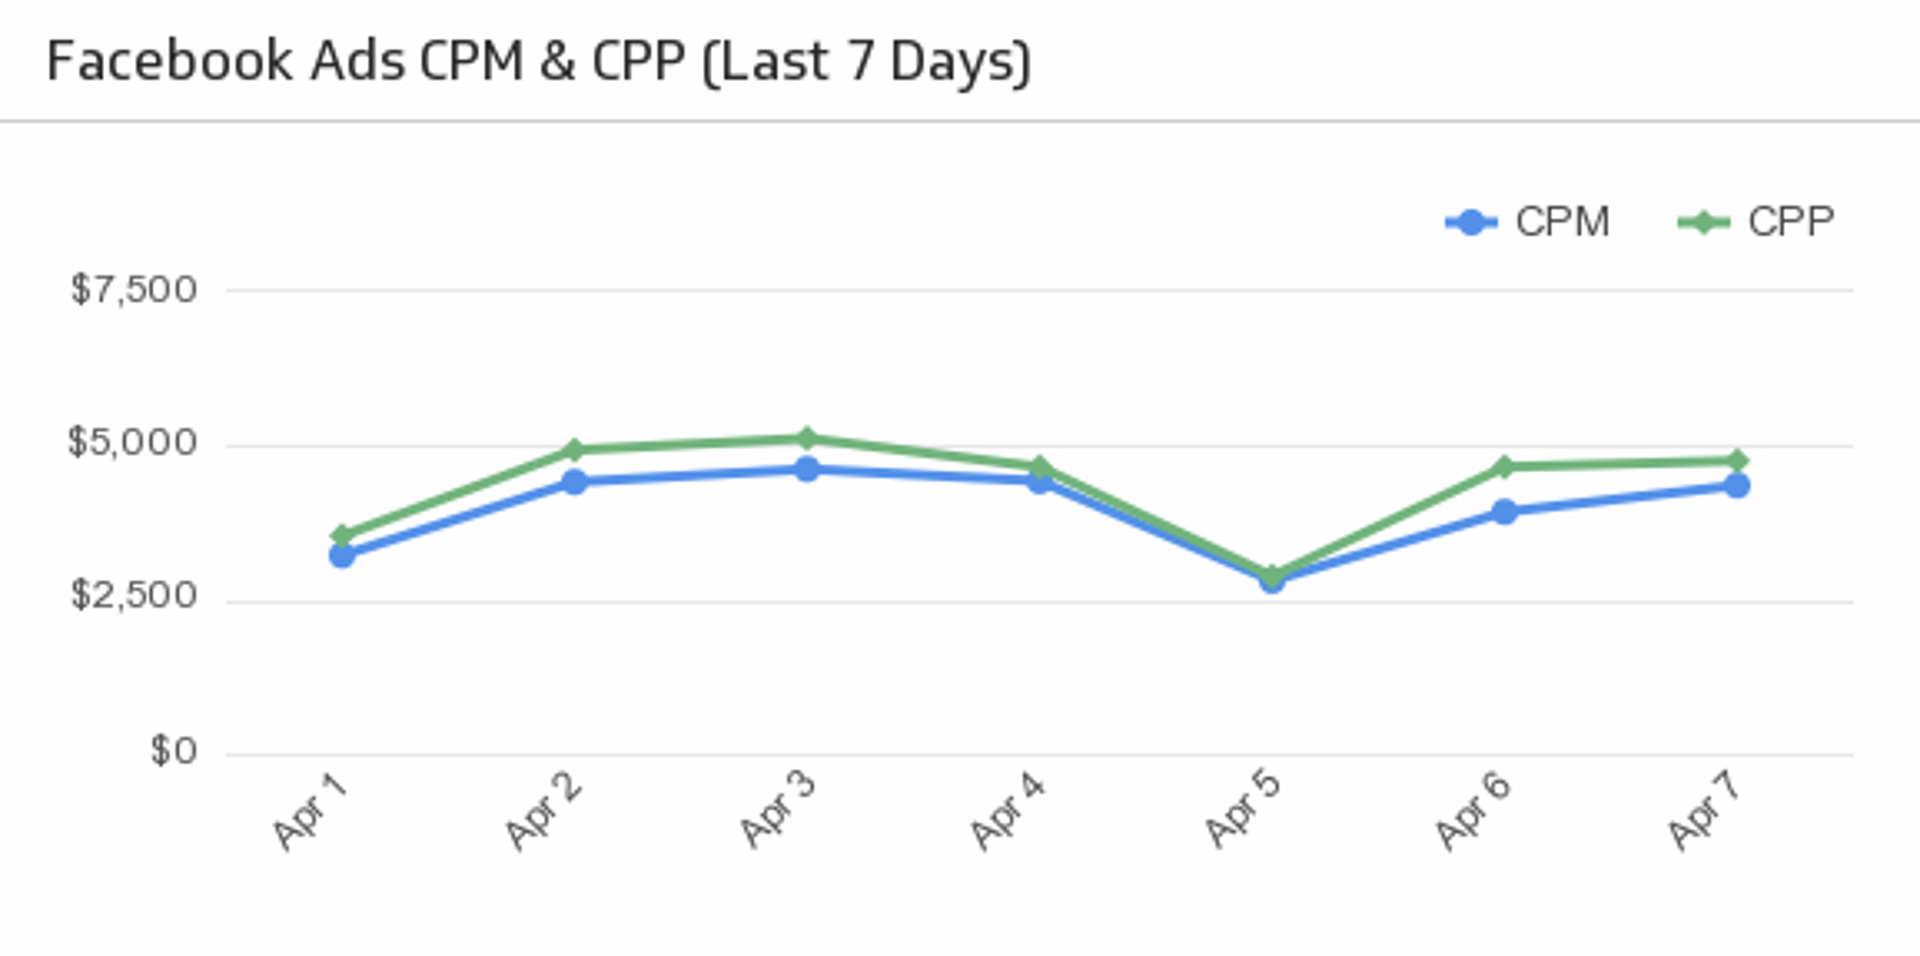
The powerful Cervinodata engine collects, organizes, and filters your current and historical data from your ad accounts and ad platforms. Add your data as a custom data source to PowerMetrics to visualize your ad data, get a picture of your performance, and identify trends and insights.
Blend your ad platform statistics into one performance dashboard so you can monitor across your ad campaigns in near real-time, measure ROI, and make adjustments to your bid strategy for maximum performance.
Once your data is collected and organized, it’s ready to connect to PowerMetrics to build robust dashboards.
- Blend and analyze your multi-channel advertising from Facebook Ads, Google Ads, or LinkedIn Ads (to name a few) into one dashboard for a complete overview of your ad spend and ROI.
- Visualize your advertising data by choosing from a variety of visualization types available for your dashboard.
- Create calculated metrics by combining your custom Cervinodata with other data sources to get a full picture of marketing strategy.
- Easily share your dashboard with your team by managing user access or printing and sharing via PDF.
- Choose your refresh based on your PowerMetrics plan.
Overview of the Cervinodata platform
Configure your ad platforms
Add your advertising platforms to your Cervinodata dashboard.
Switch your accounts on
Turn on your accounts to start collecting data from each ad platform.
Choose your destination
From your Cervinodata dashboard, you can choose the destination for your data. In this case, choose Klipfolio.
Visualize your Cervinodata in PowerMetrics
Identify trends in your advertising campaigns and access your insights from anywhere for answers on-the-go.