Klip Gallery
Our Klip Gallery allows you to track your key performance measures through Klips with just a few clicks. Get the Klips that matter most to your business right from our Gallery to your dashboard in minutes.
Track KPIs in minutes
Sign up for free and start making decisions for your business with confidence.


Select a Category
Select an Integration
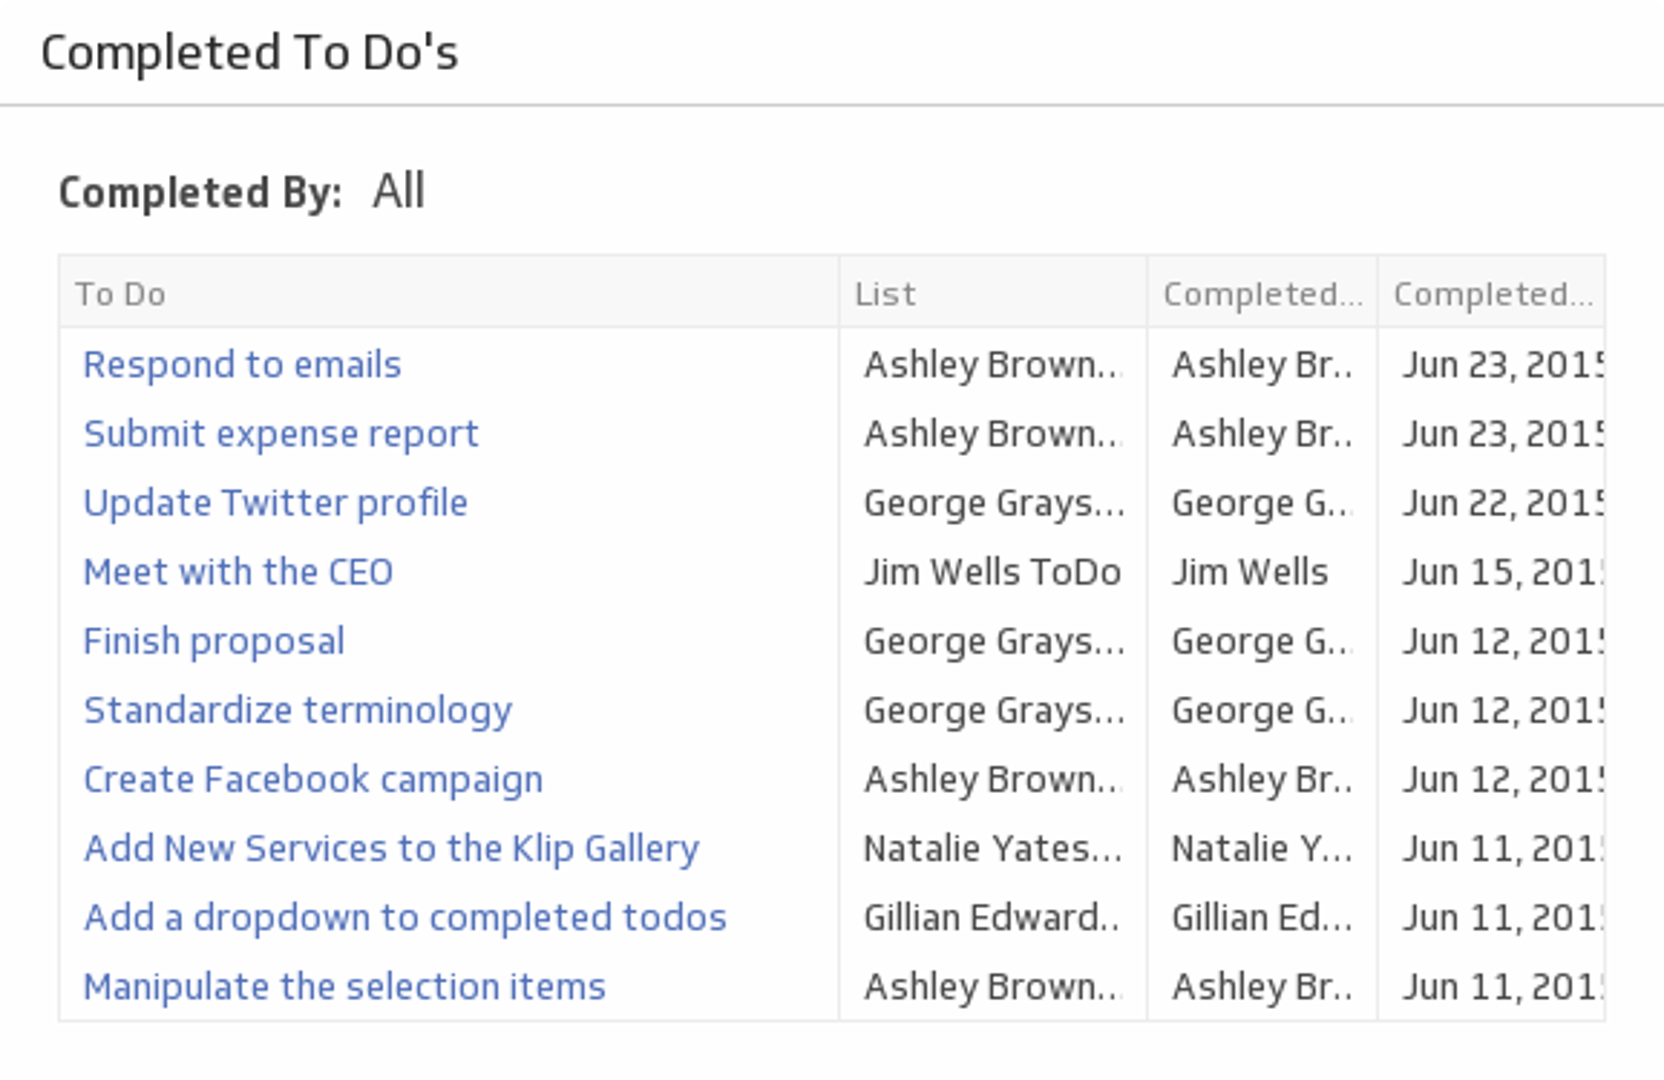
Completed To Dos
See a list of tasks each team member has completed using a handy drop down menu.
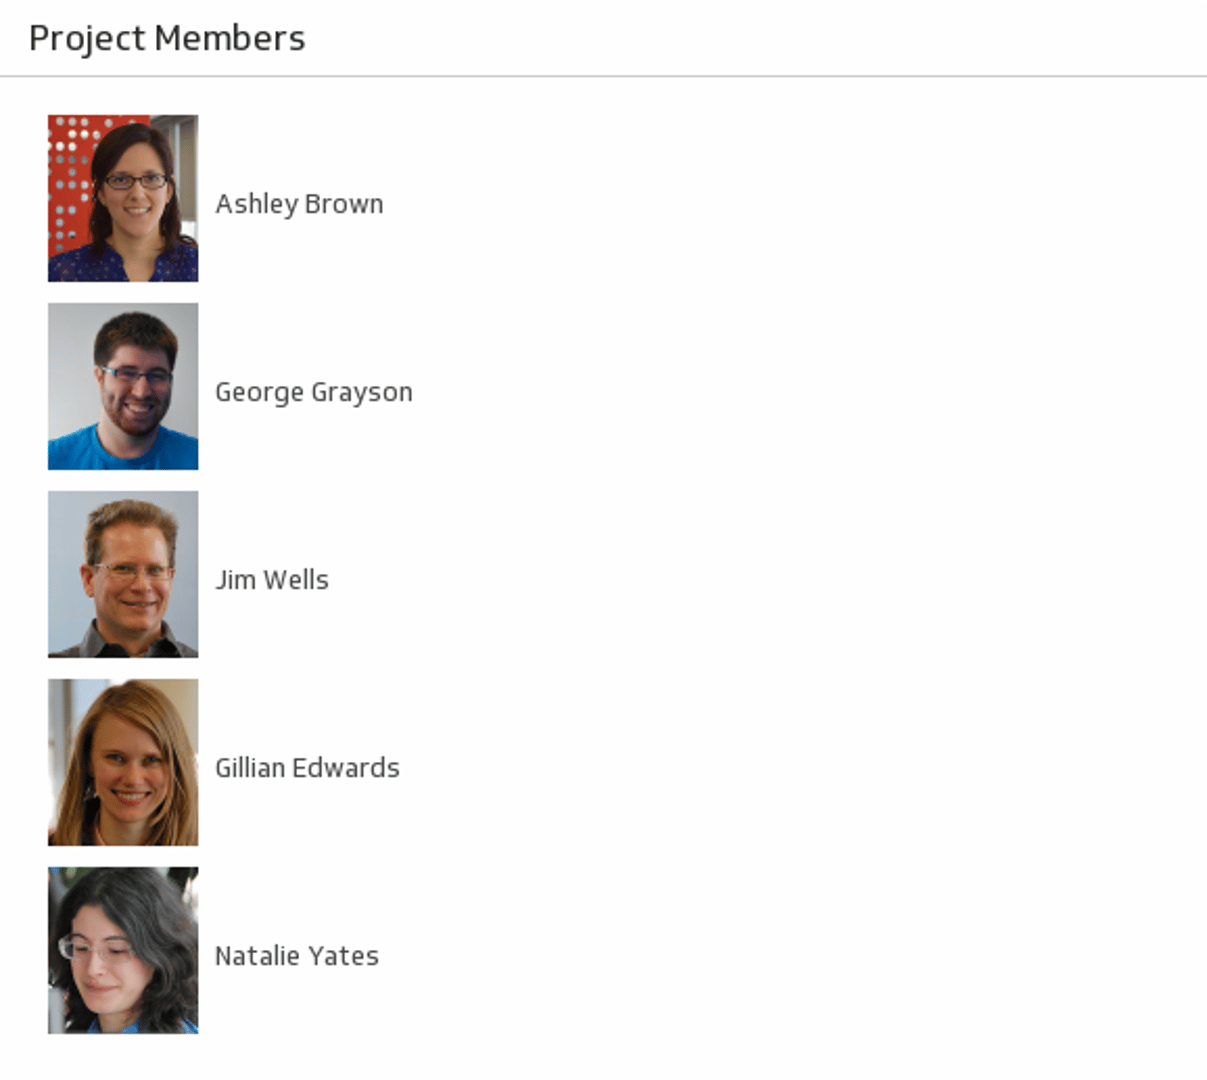
Project Members
Let your team shine by displaying a list of members on your dashboard.
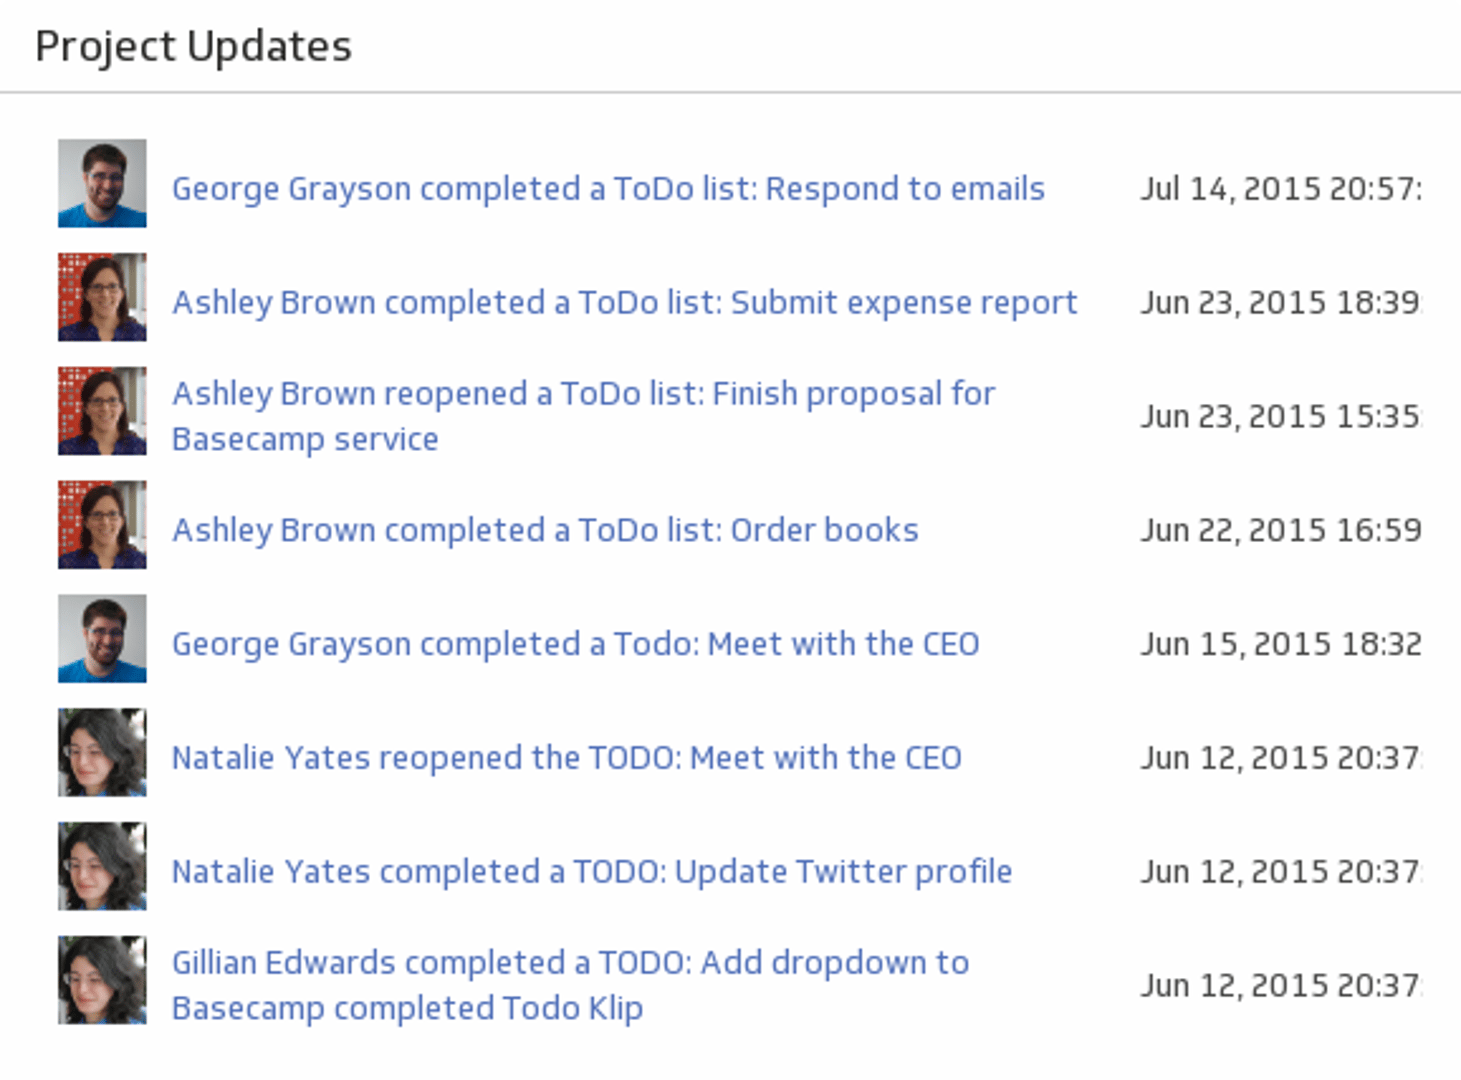
Project Updates
Monitor your team's activity with a real-time list of updates.
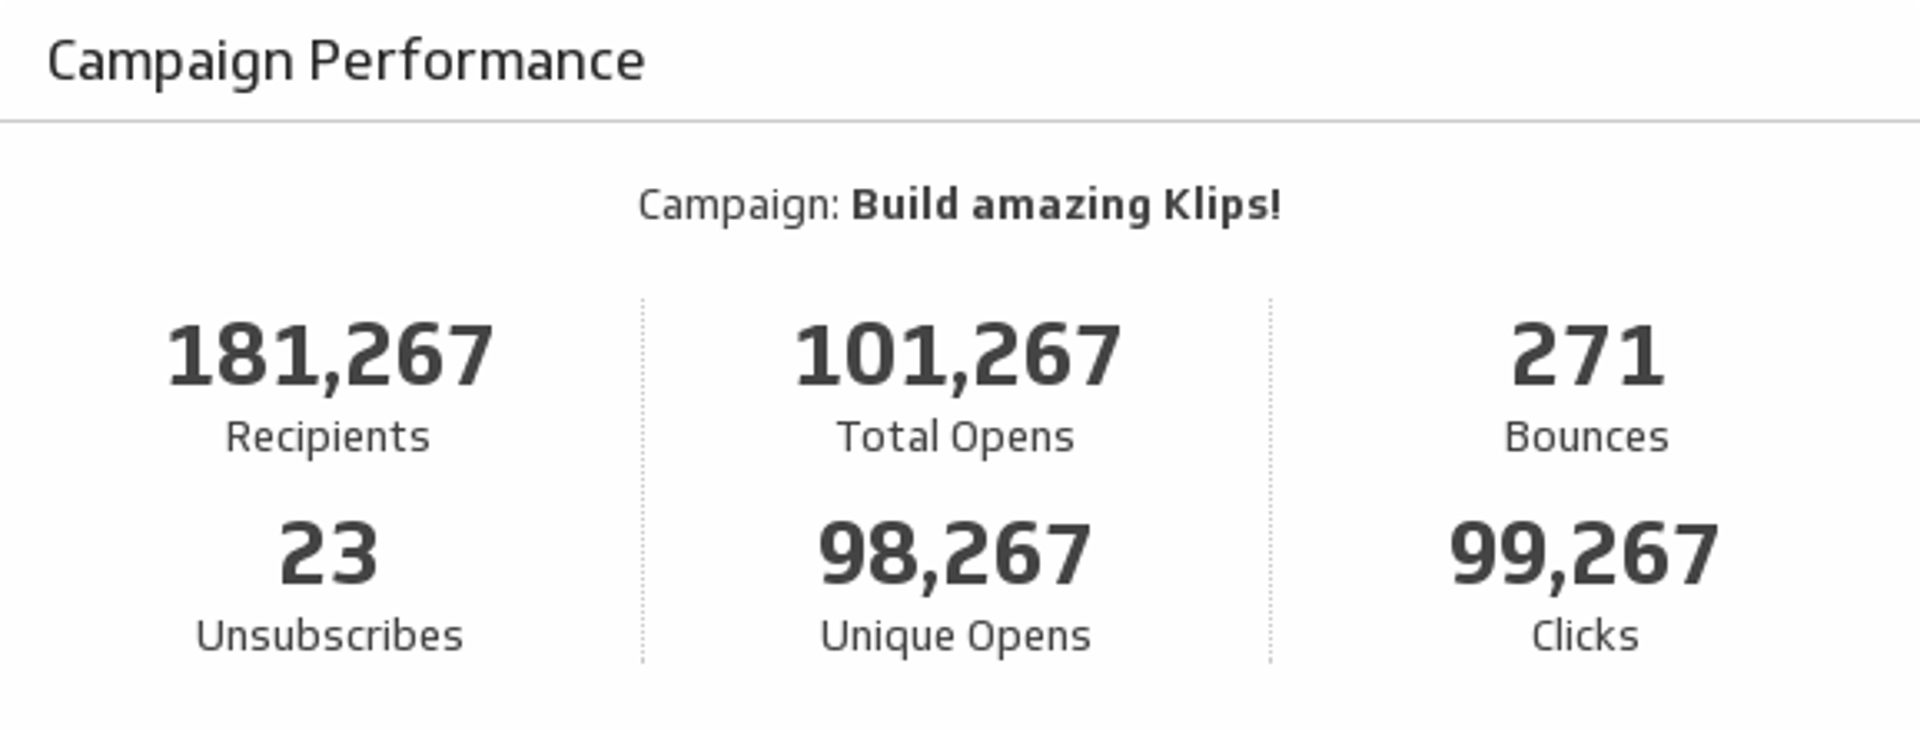
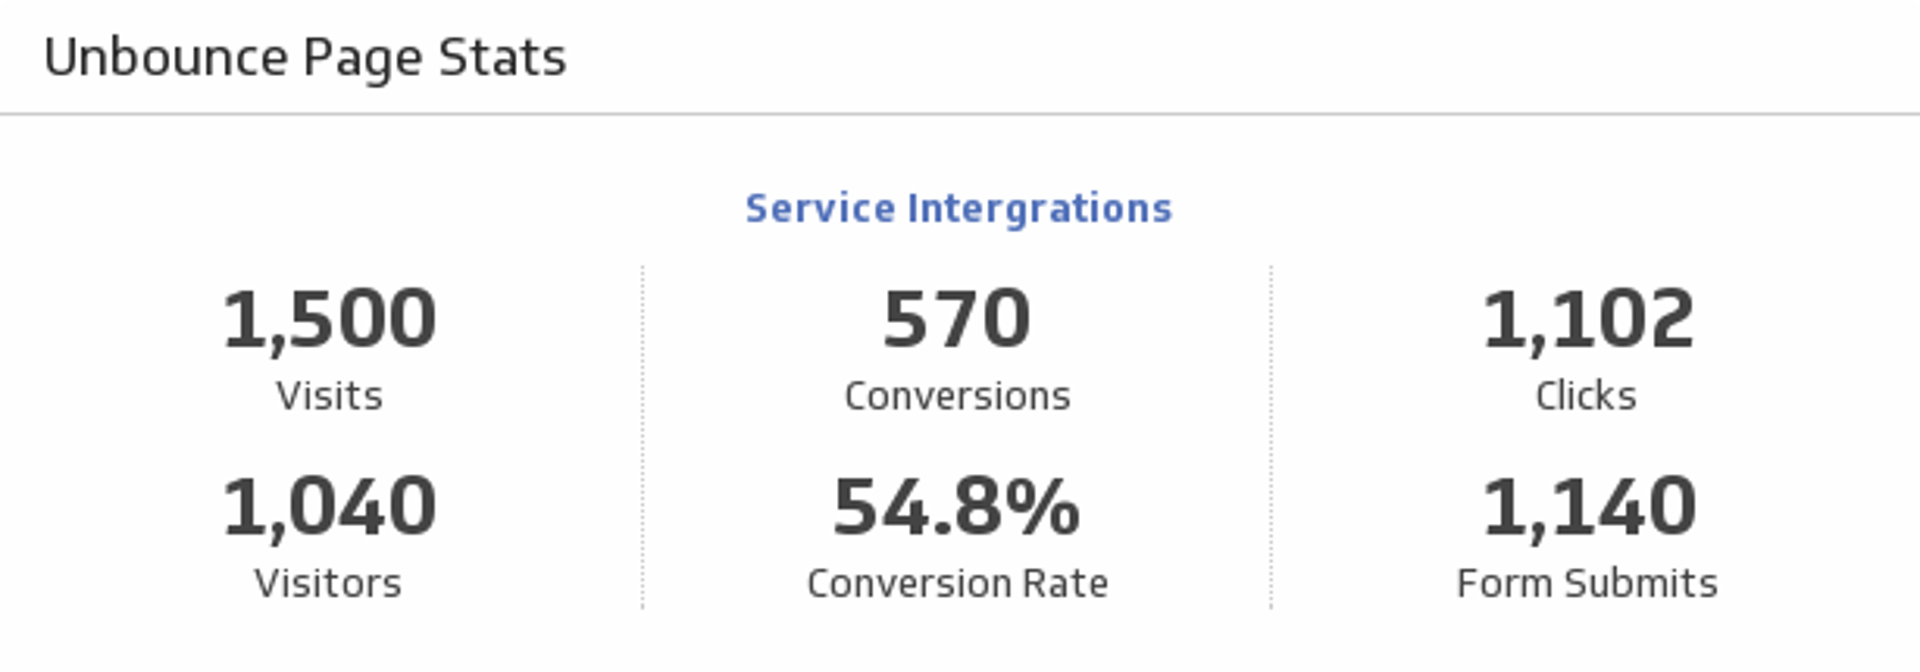
Campaign Performance
Help your team make informed decisions by monitoring key metrics on your email marketing campaign performance.
Campaigns (Last 30 Days)
Never lose track of your email campaigns with a list of all your mail-outs over the past 30 days.
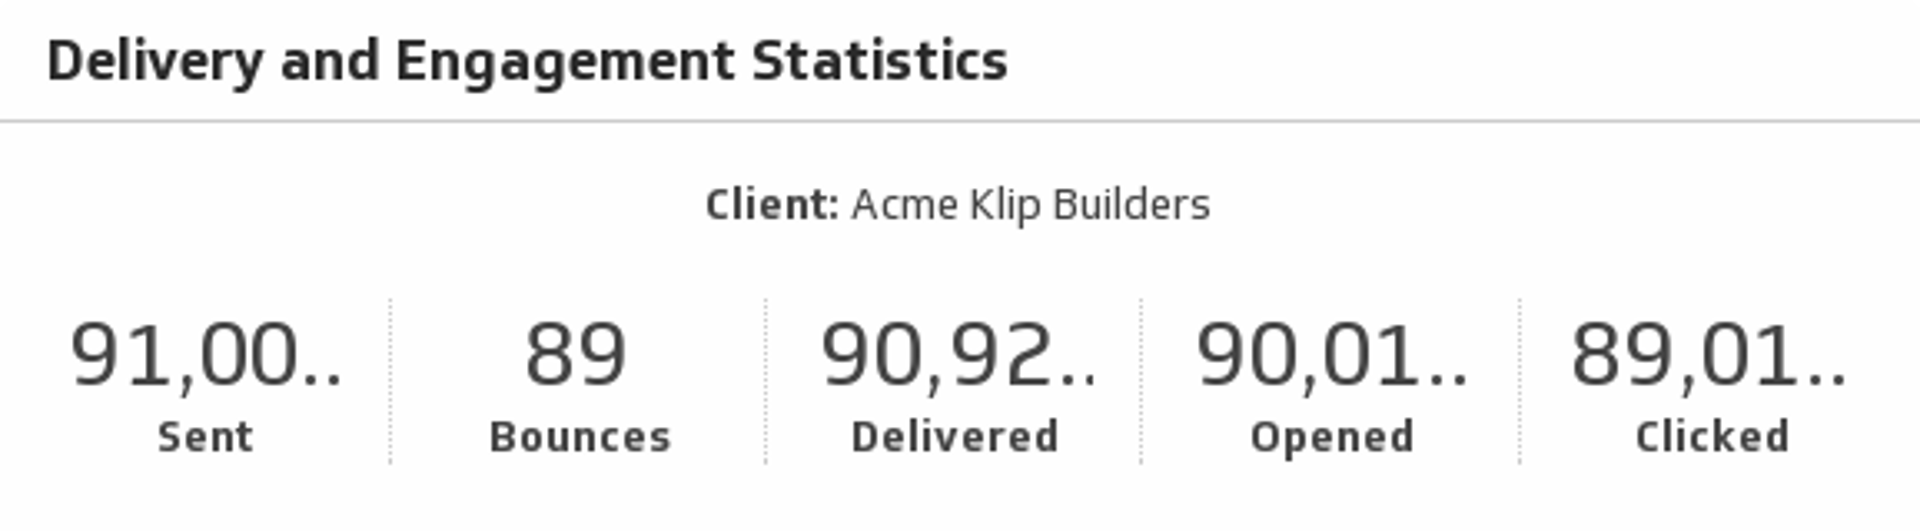
Delivery and Engagement Statistics
Show the delivery and engagement statistics of your Campaign Monitor client.
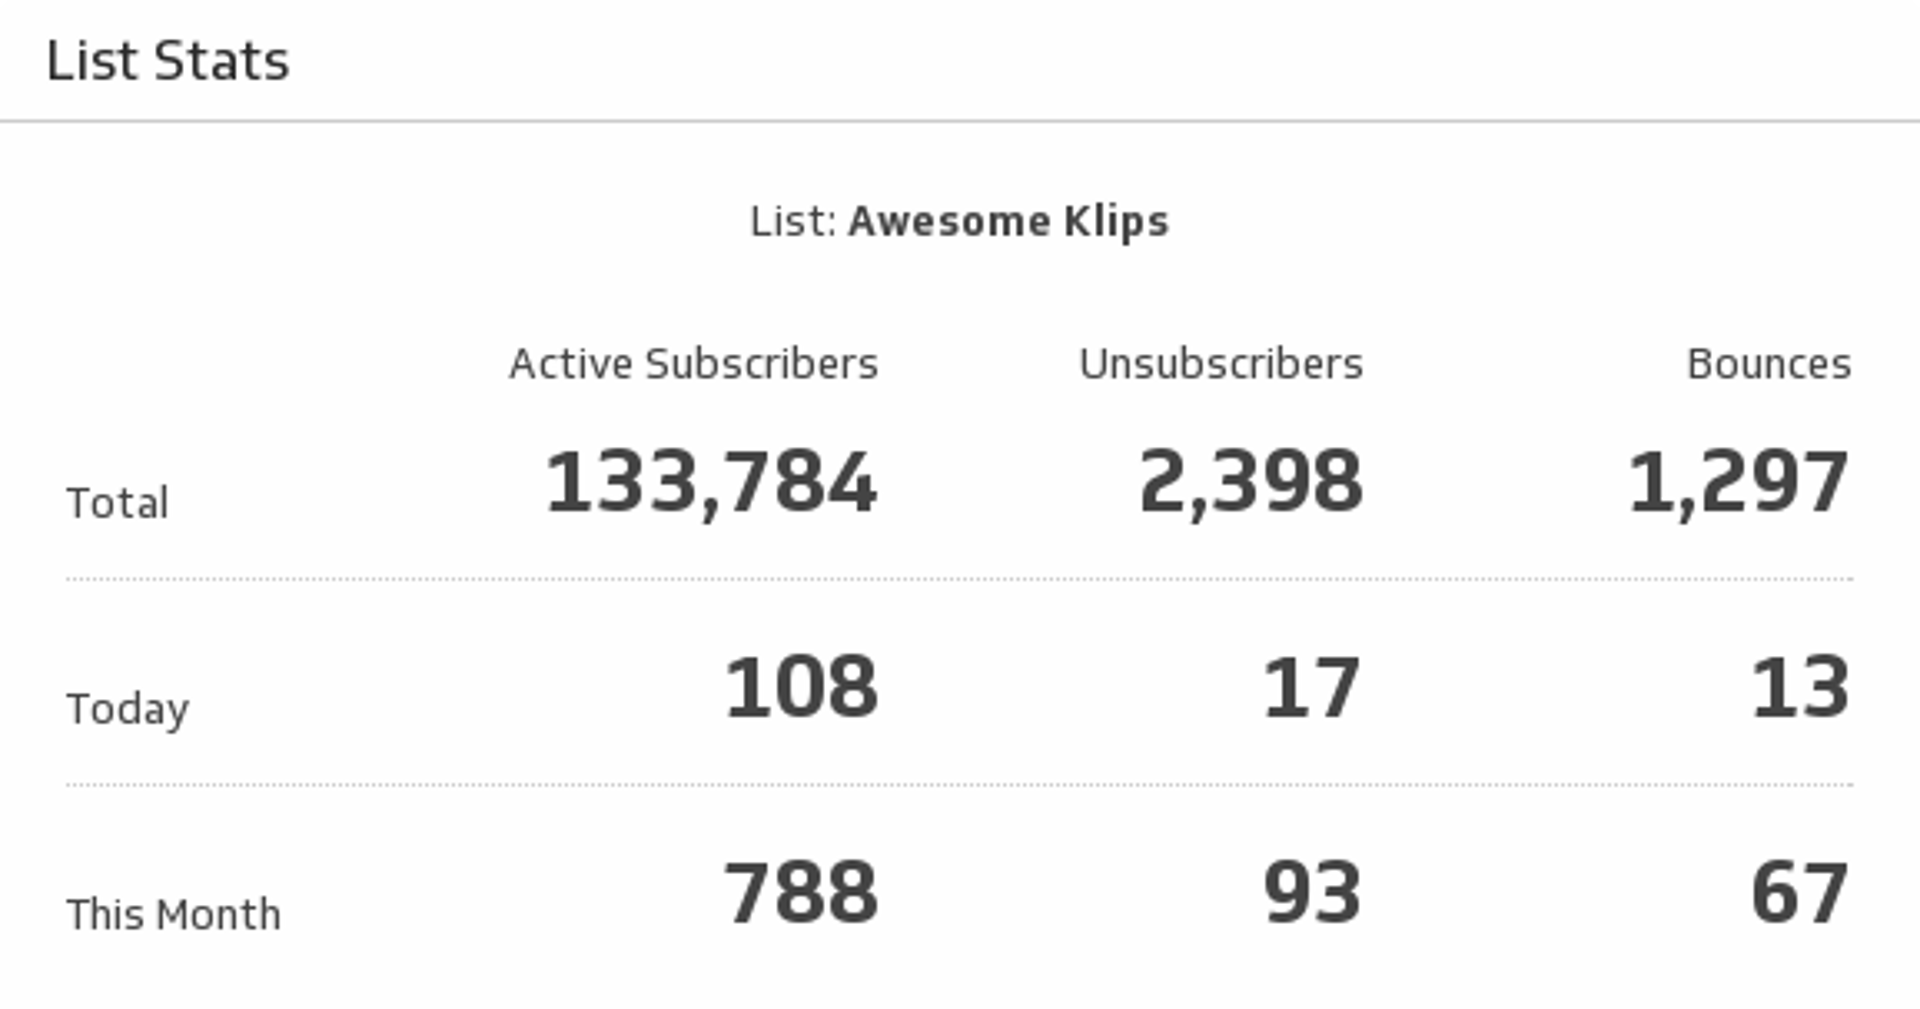
List Stats
Use this indispensable Klip to monitor key stats on your email marketing list.
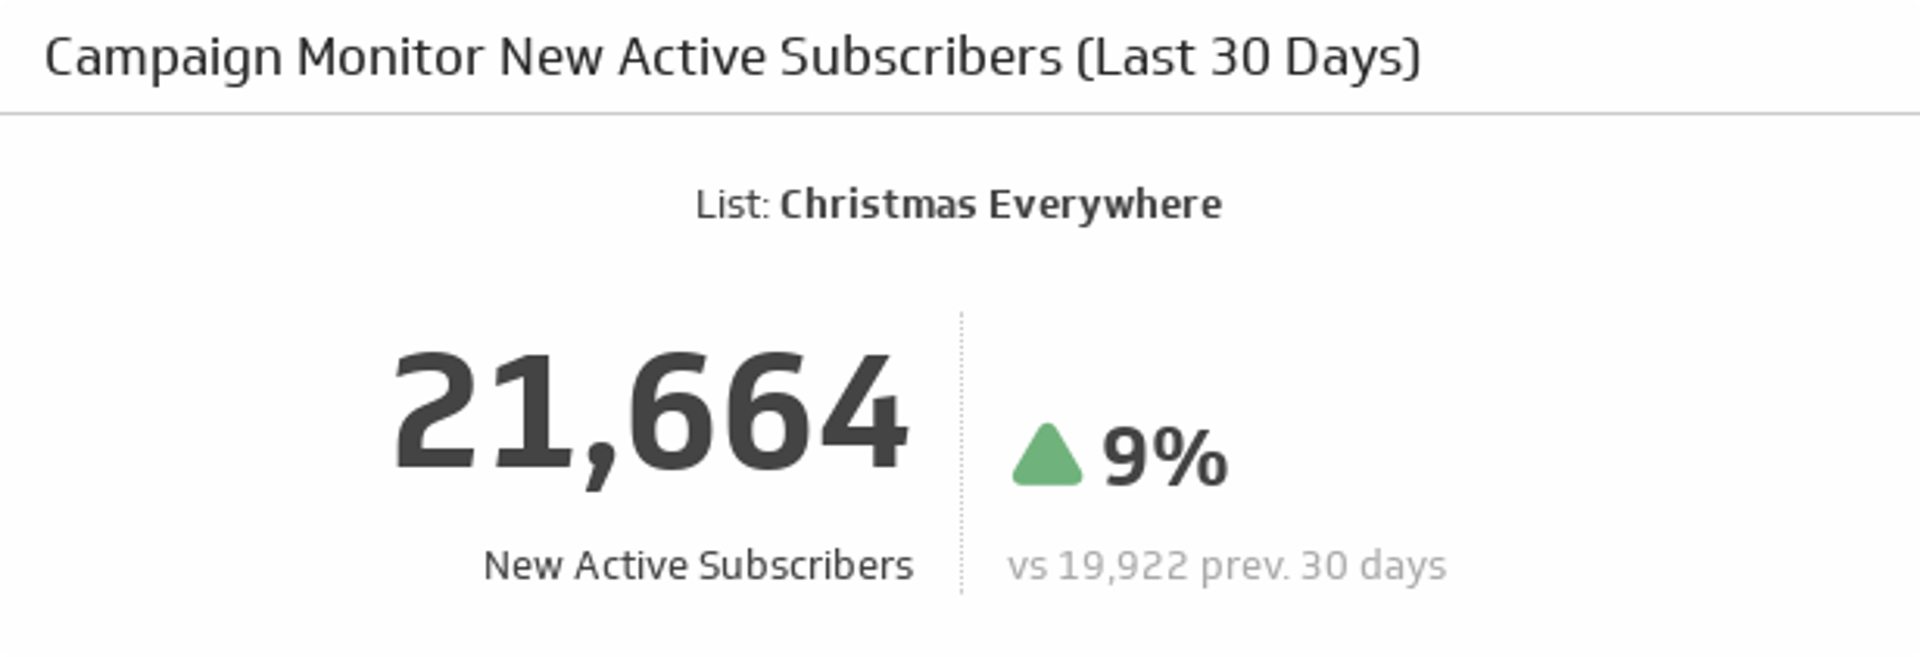
New Active Subscribers (Last 30 Days)
Watch the number of new and active subscribers grow over the past 30 days, and compare it to the previous 30 days.
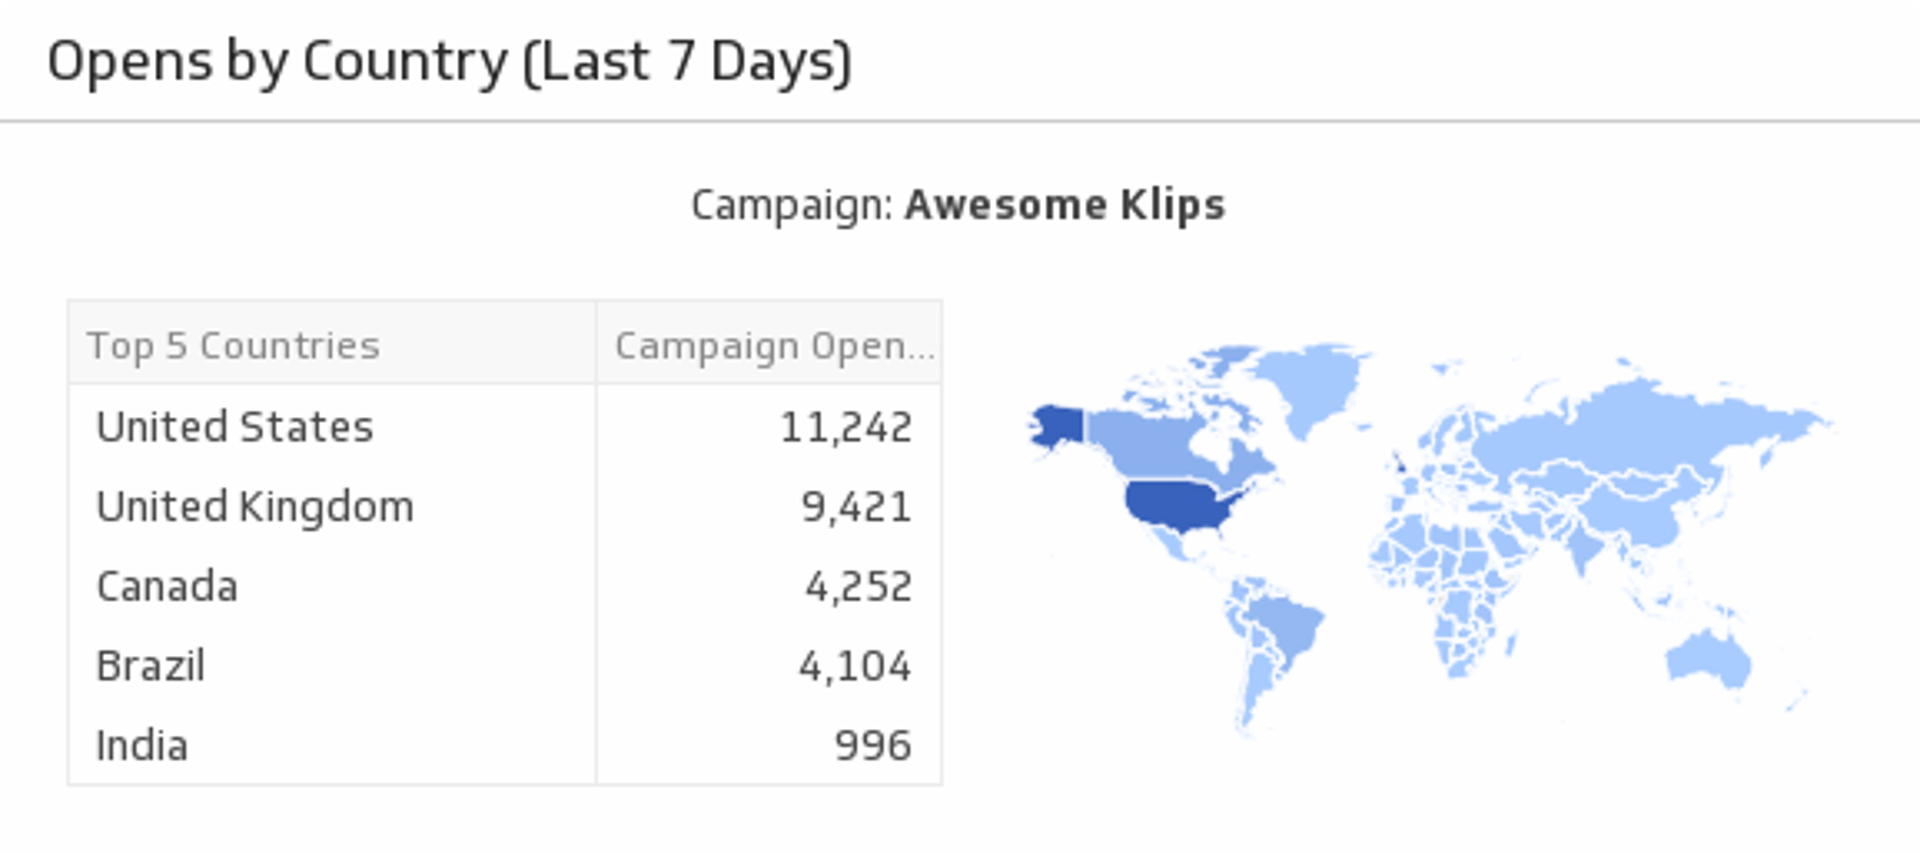
Opens by Country (Last 7 Days)
Discover where your audience lies by monitoring campaign open rates by country.
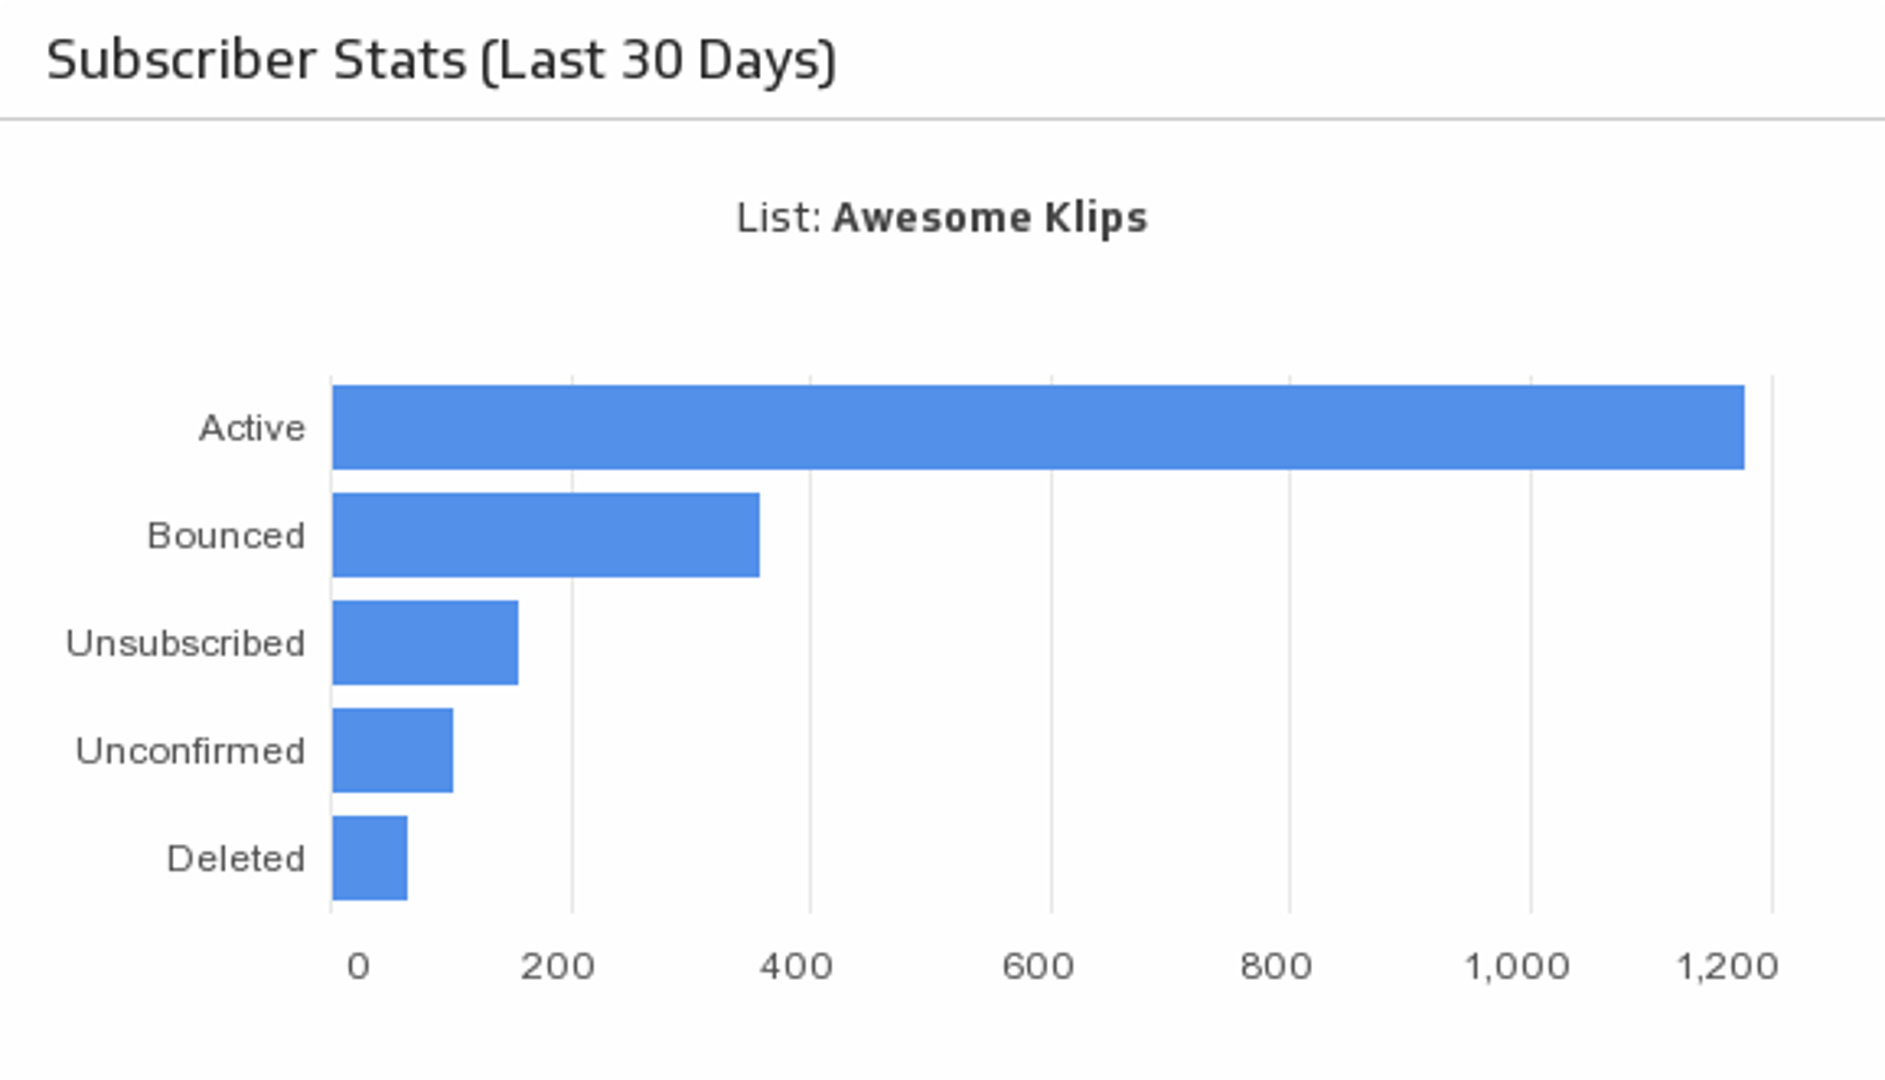
Subscriber Stats (Last 30 Days)
Always know how many Active, Unsubscribed, Bounced, Unconfirmed and Deleted subscribers you have with an at-a-glance horizontal bar chart.
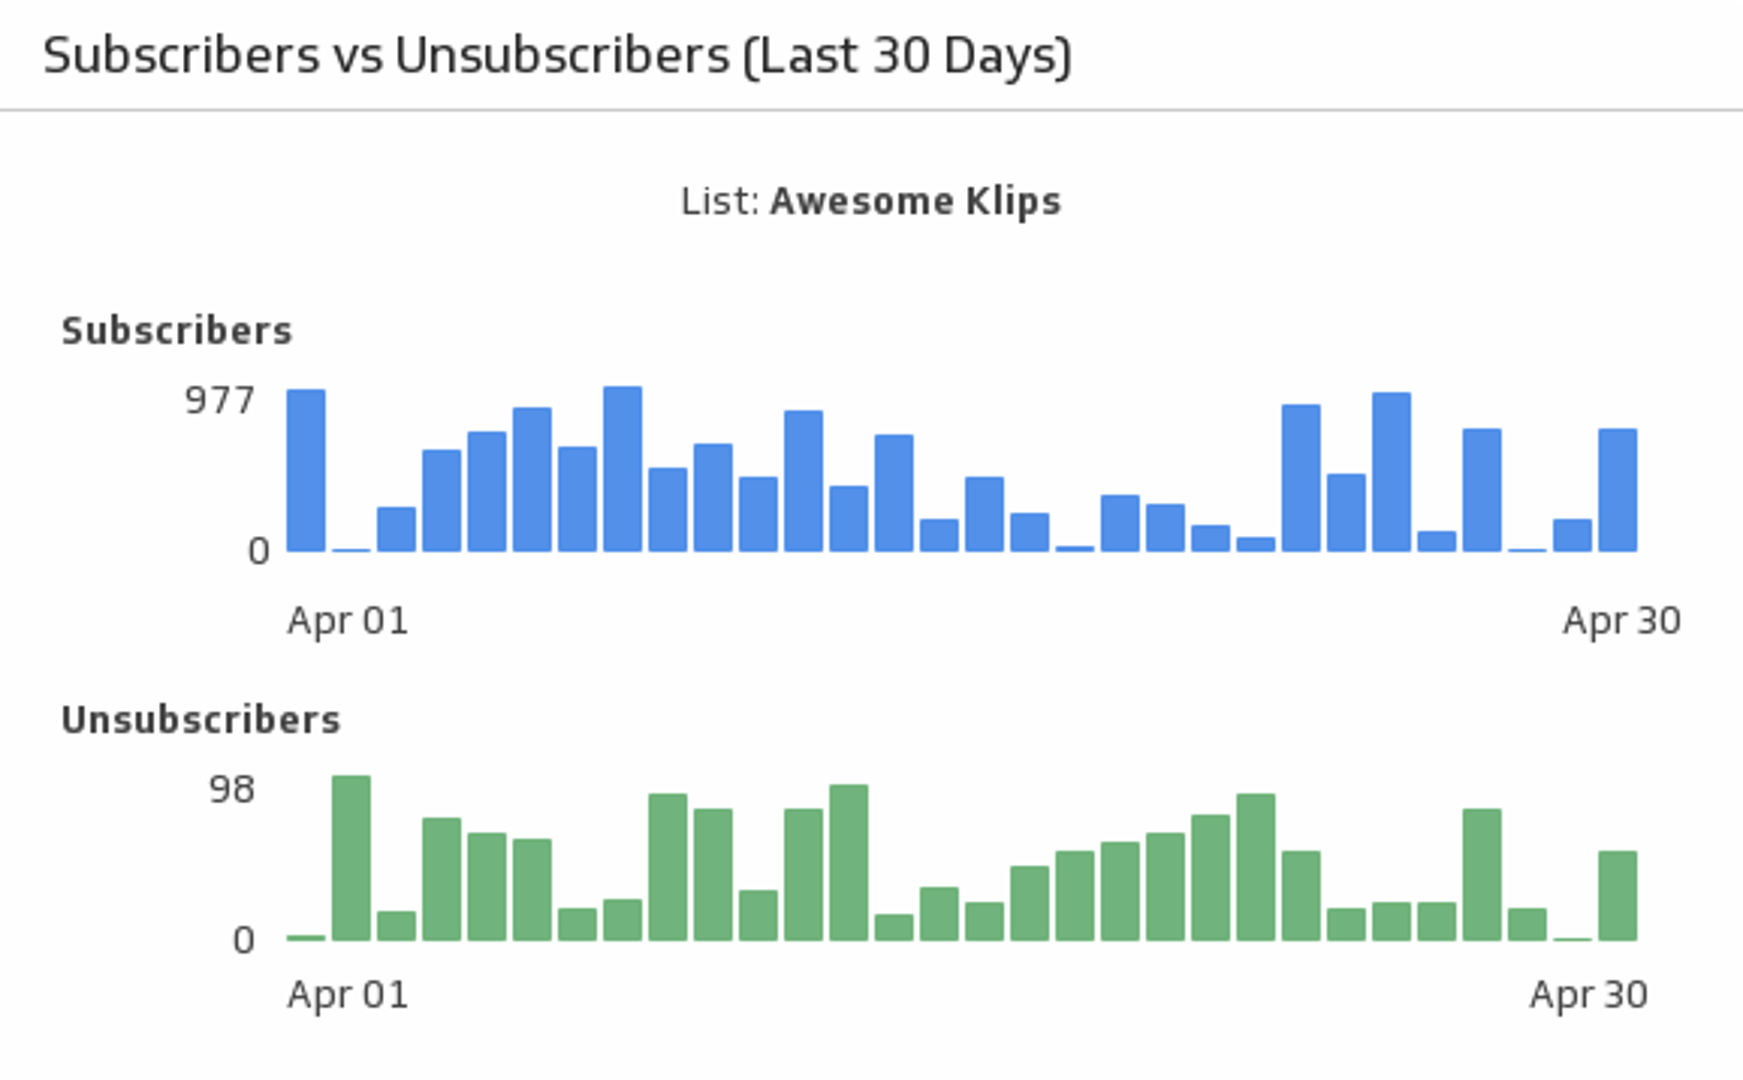
Subscribers vs. Unsubscribers (Last 30 Days)
Compare your email marketing subscribers to unsubscribers over the past 30 days.
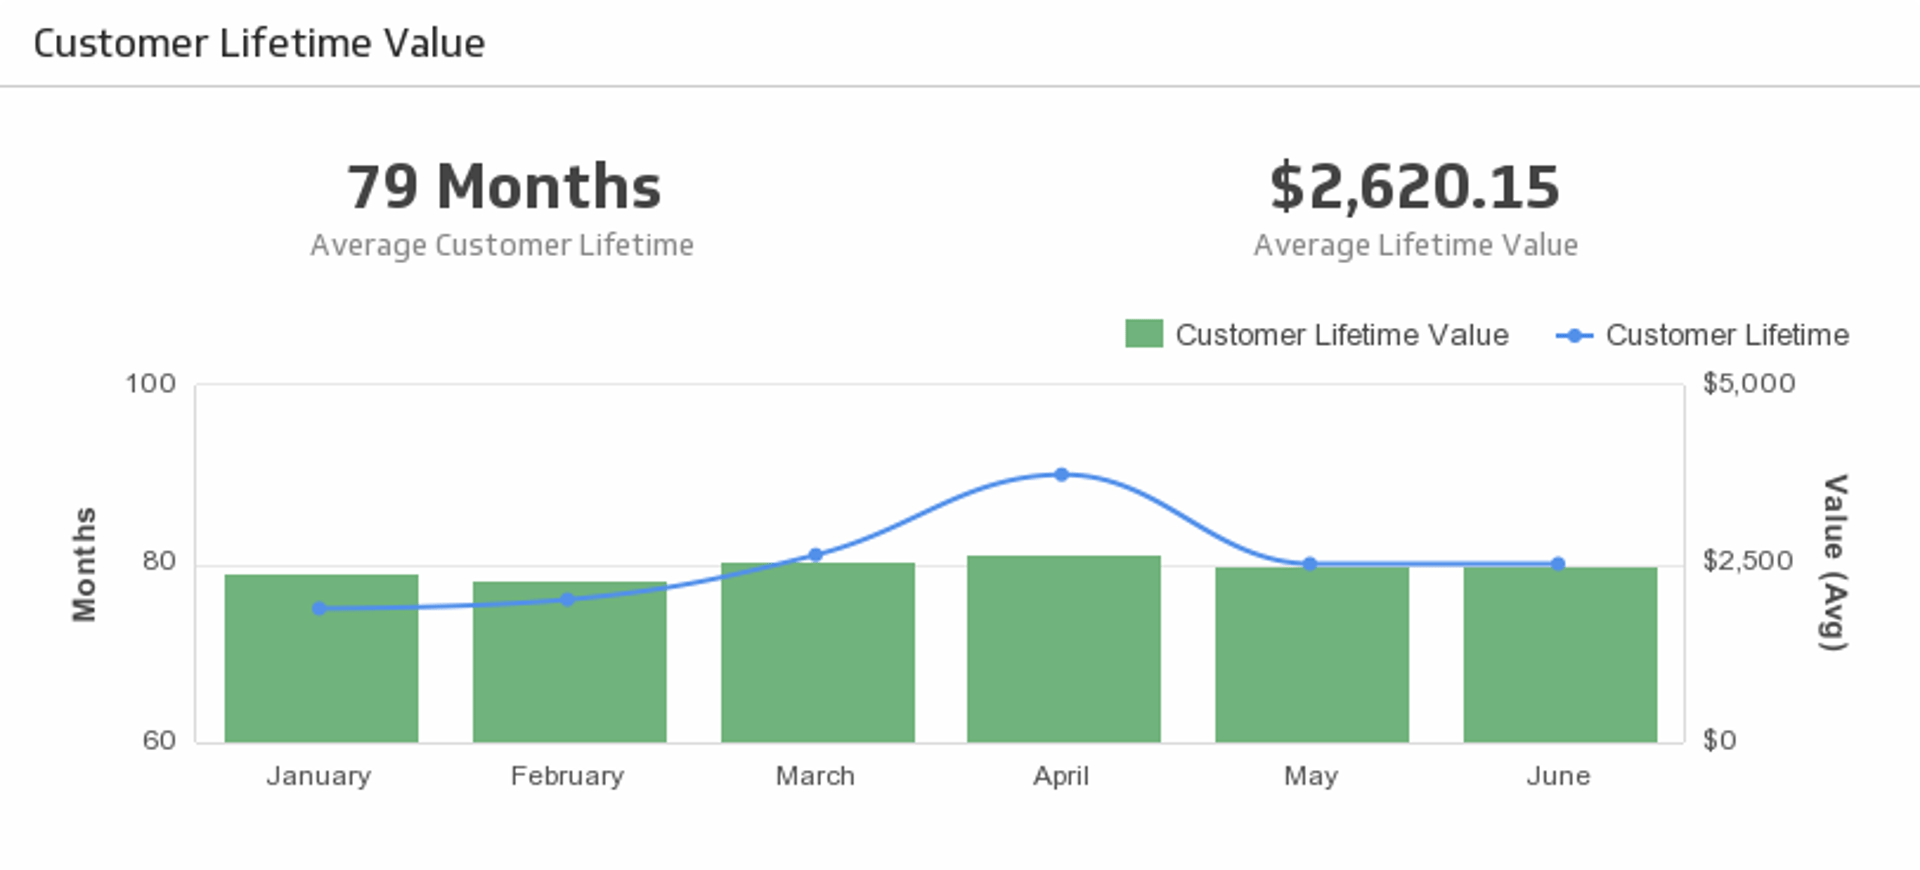
Customer Lifetime Value
The longer customers stick with you, the more valuable they are. Monitor Customer Lifetime Value, and at the same time, compare with the historical trend.
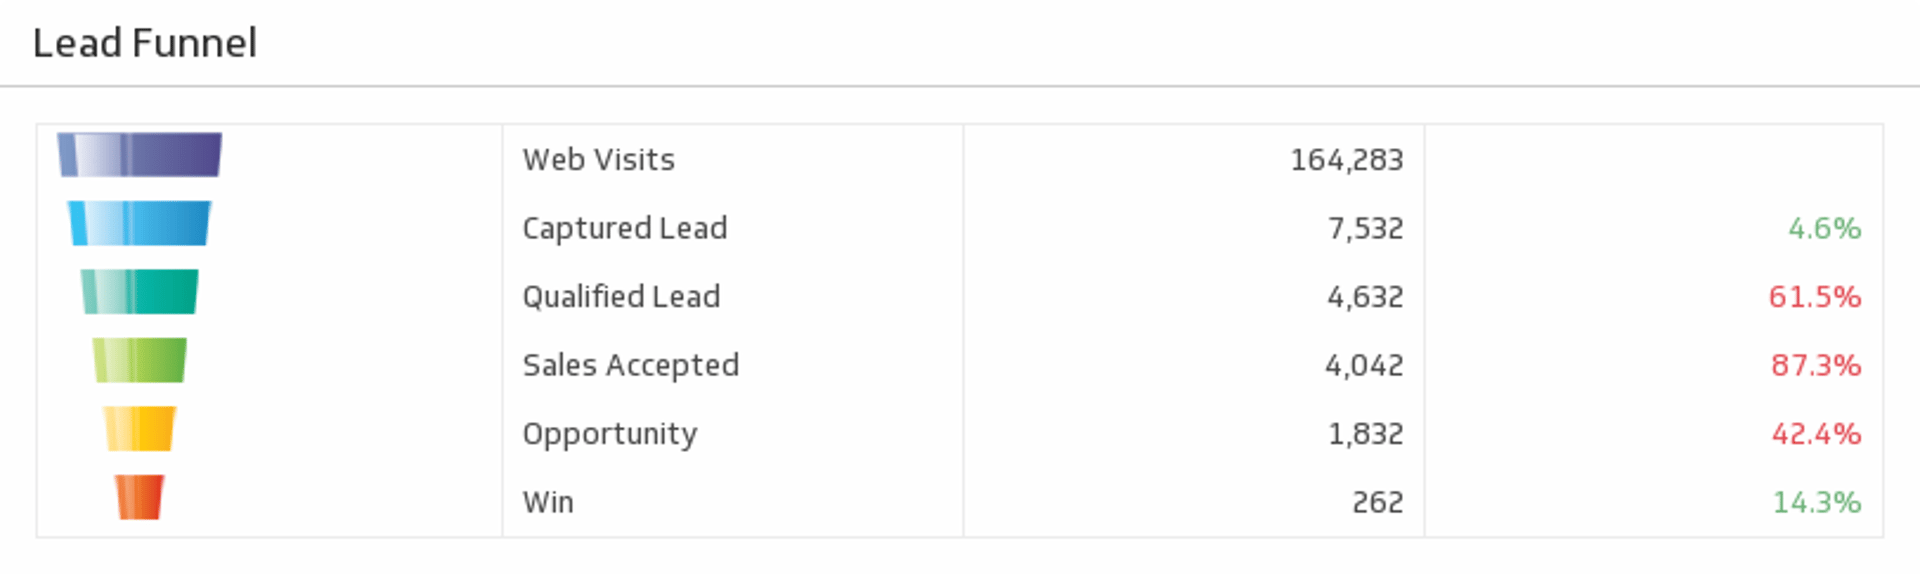
Sample: Lead Funnel
Measure the volume throughout each stage of your funnel, and focus in on the stages that matter most to you to improve your processes.
Sample: Lead to Win Conversion
Use a line chart to track your lead to win conversion rate over time.
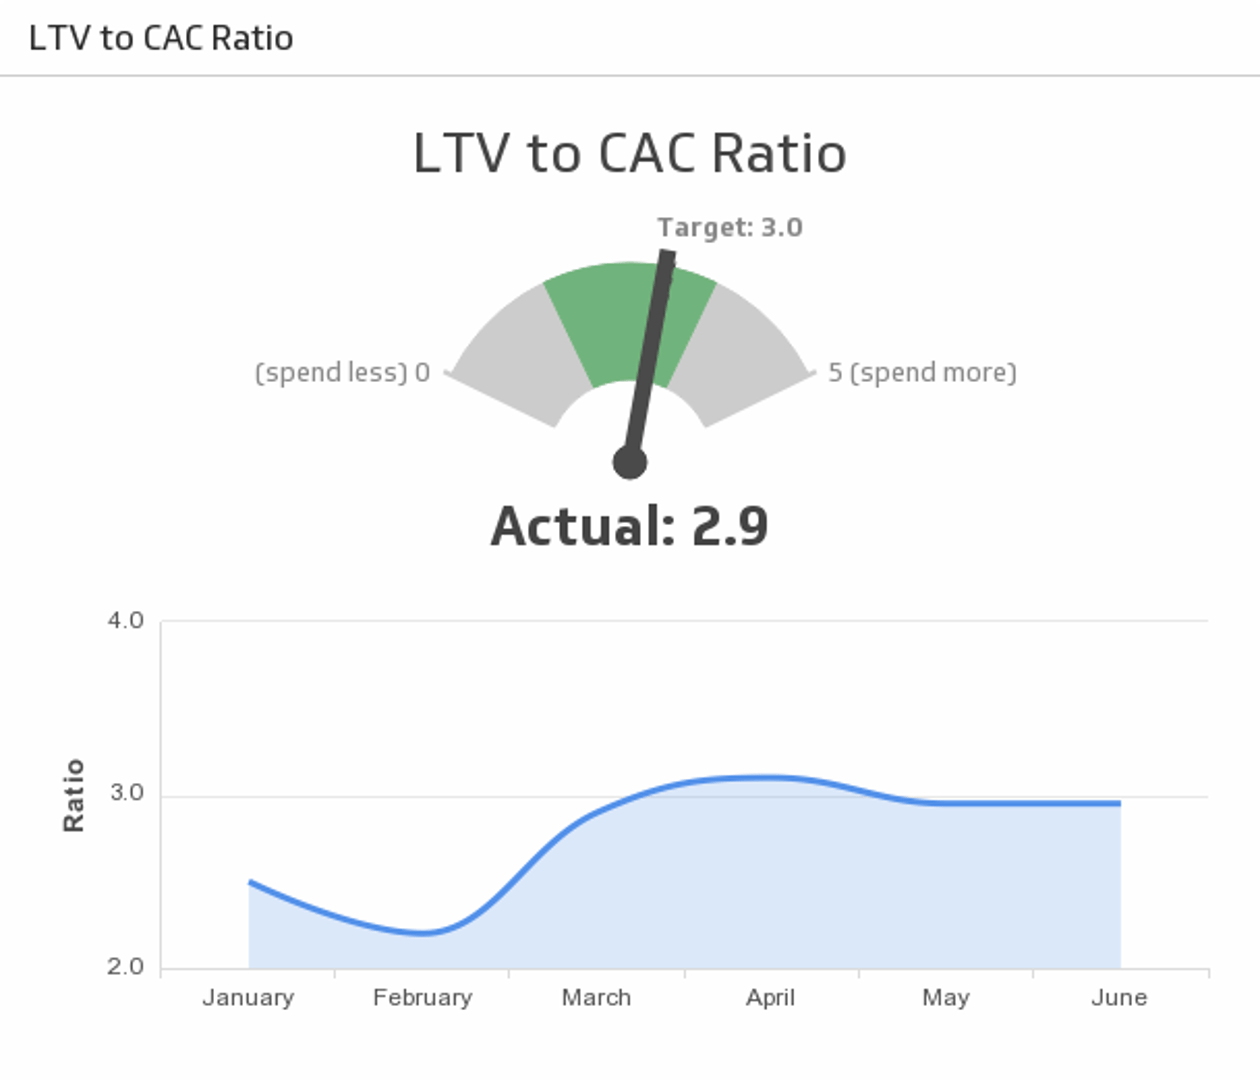
Sample: LTV to CAC Ratio
Ensure your marketing spend is optimized. Track the ratio between the lifetime value of a customer and the cost of acquiring that customer (LTV to CAC) against the historical trend.
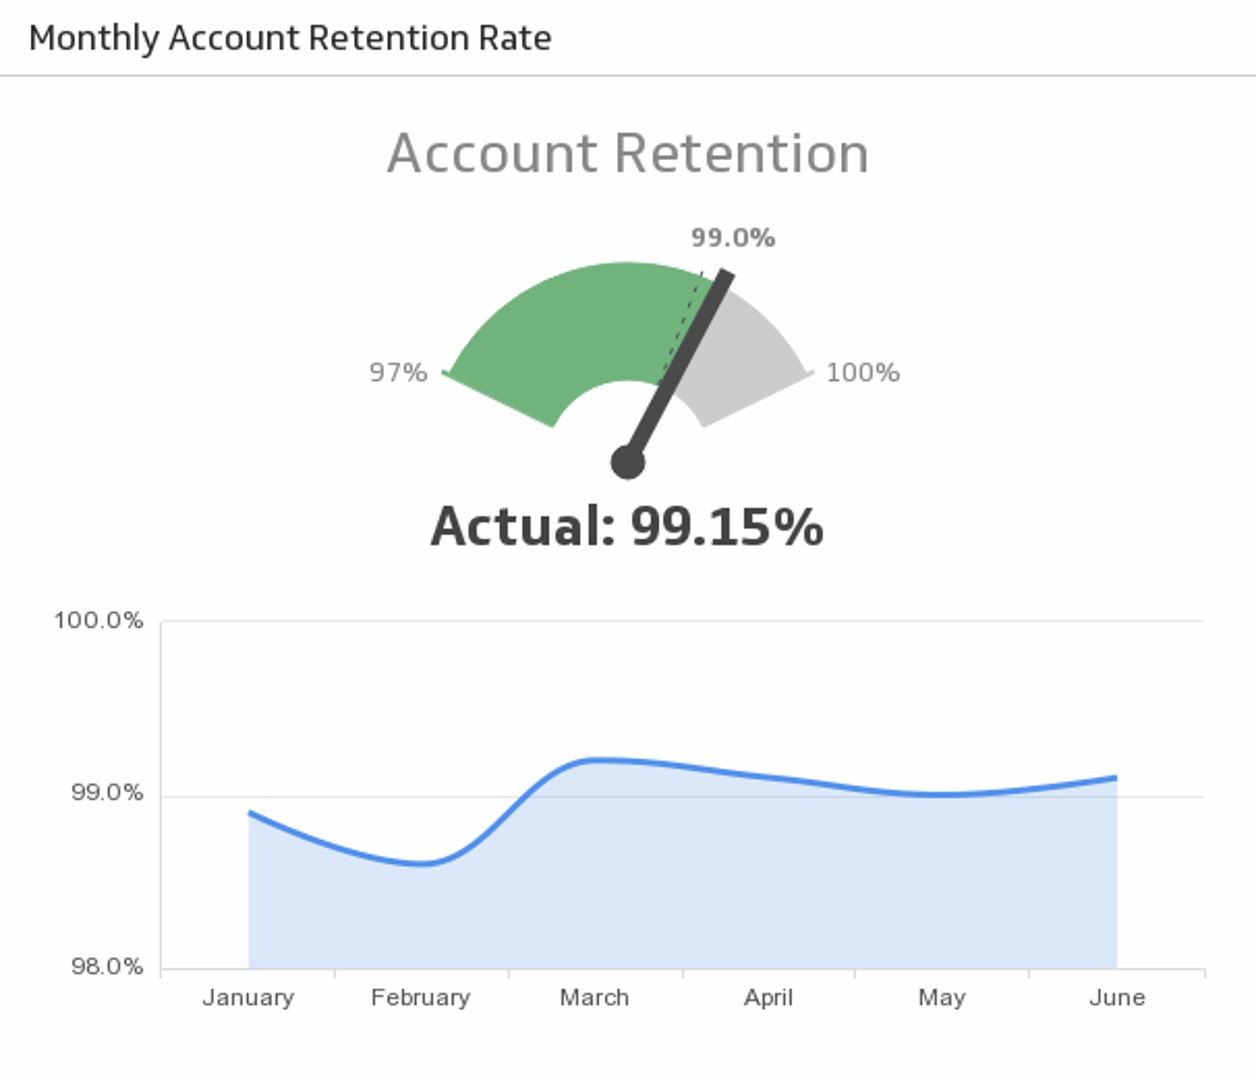
Sample: Monthly Account Retention Rate
Reach your Monthly Account Retention Rate target and compare it to the trend.
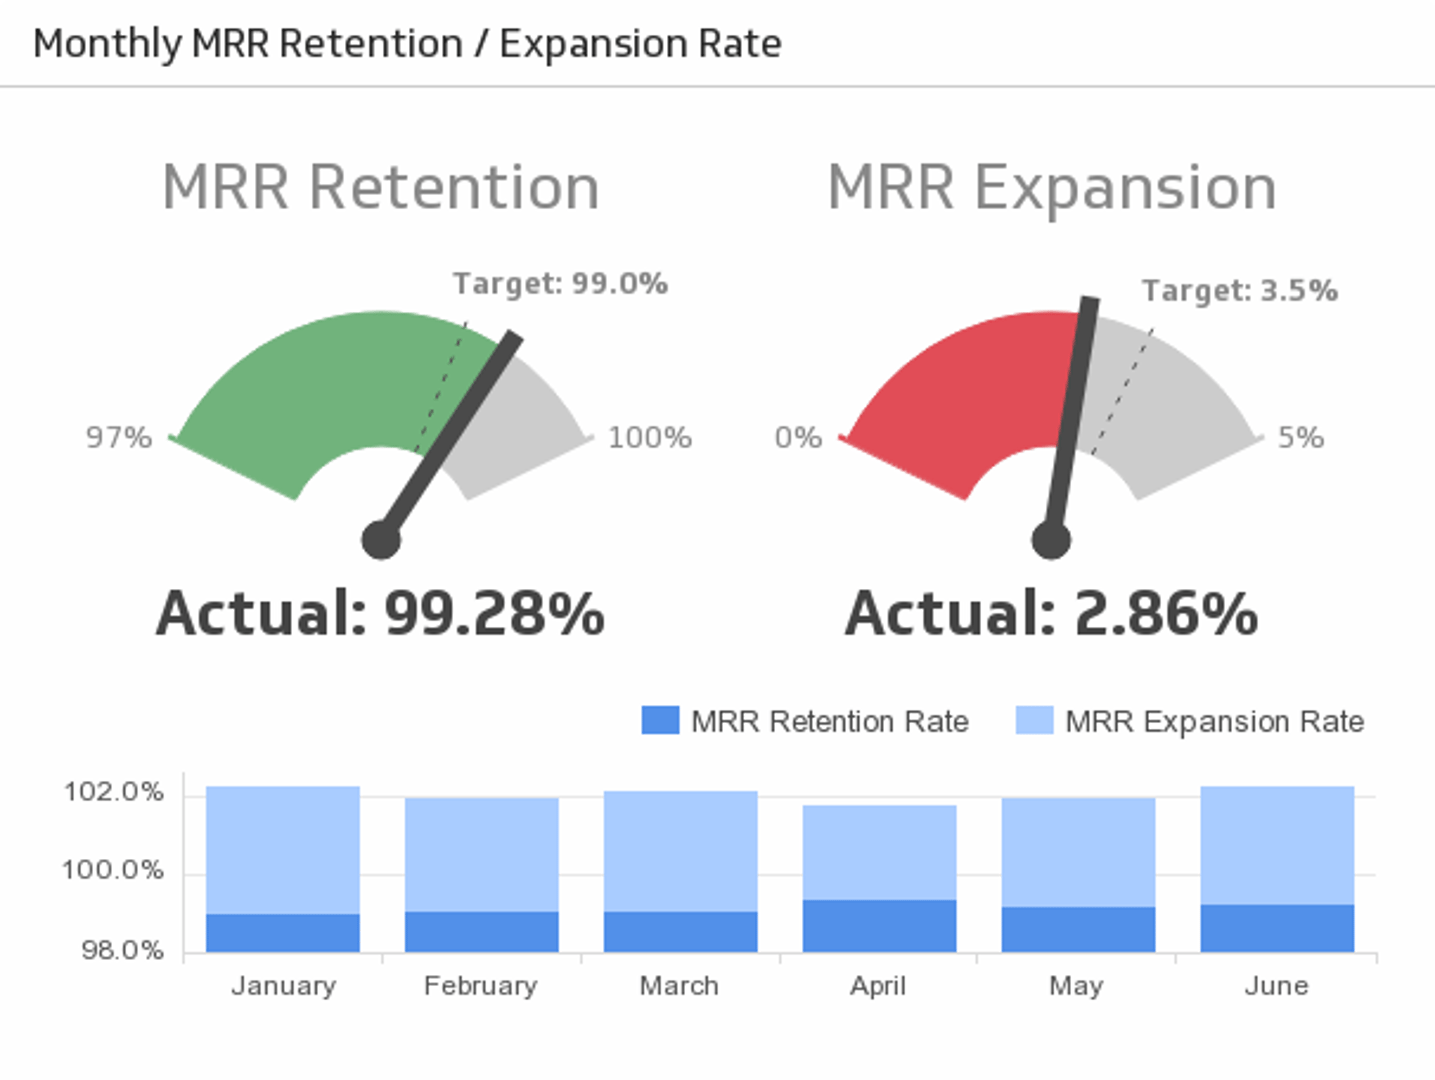
Sample: MRR Retention / Expansion Rate
Monthly Recurring Revenue (MRR) is a central facet to many businesses. Track how effective your organization is at retaining and growing expected monthly revenue.
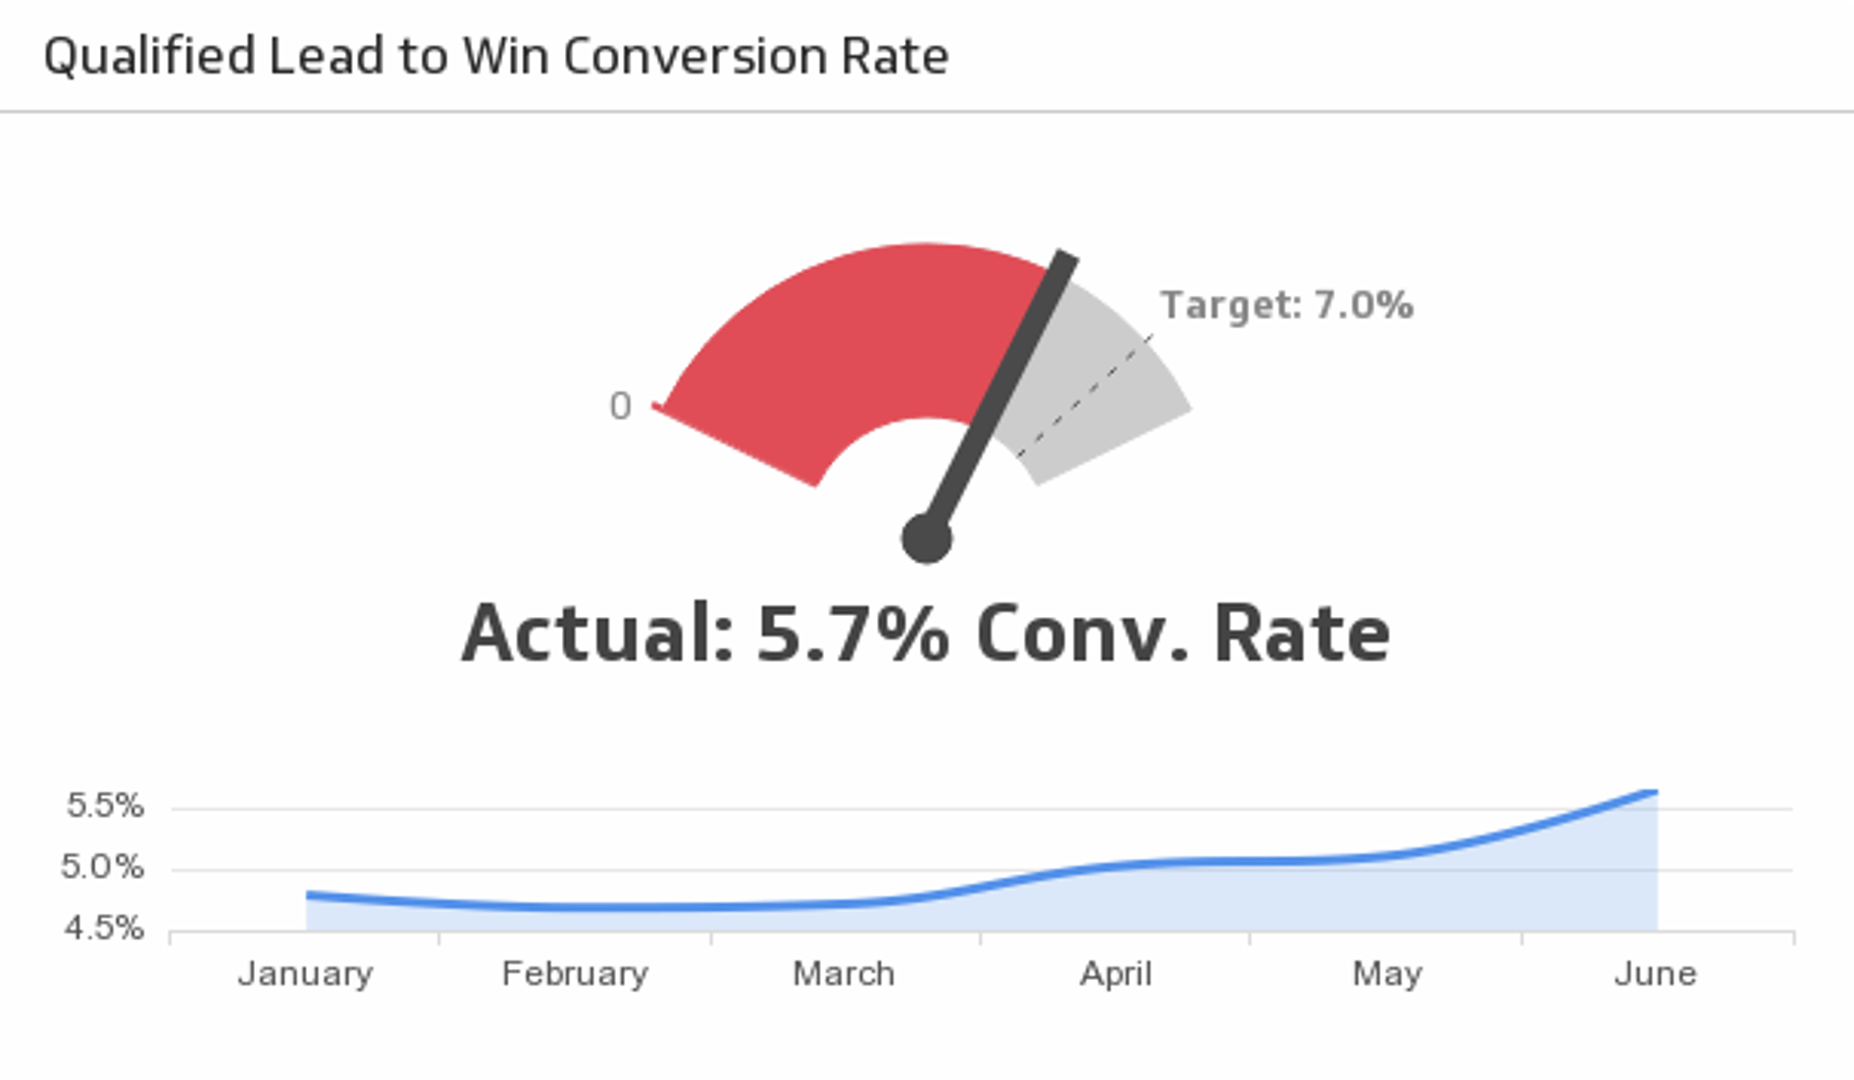
Sample: Qualified Lead to Win Conversion Rate
Reach your lead to win conversion rate target and compare it to the trend.
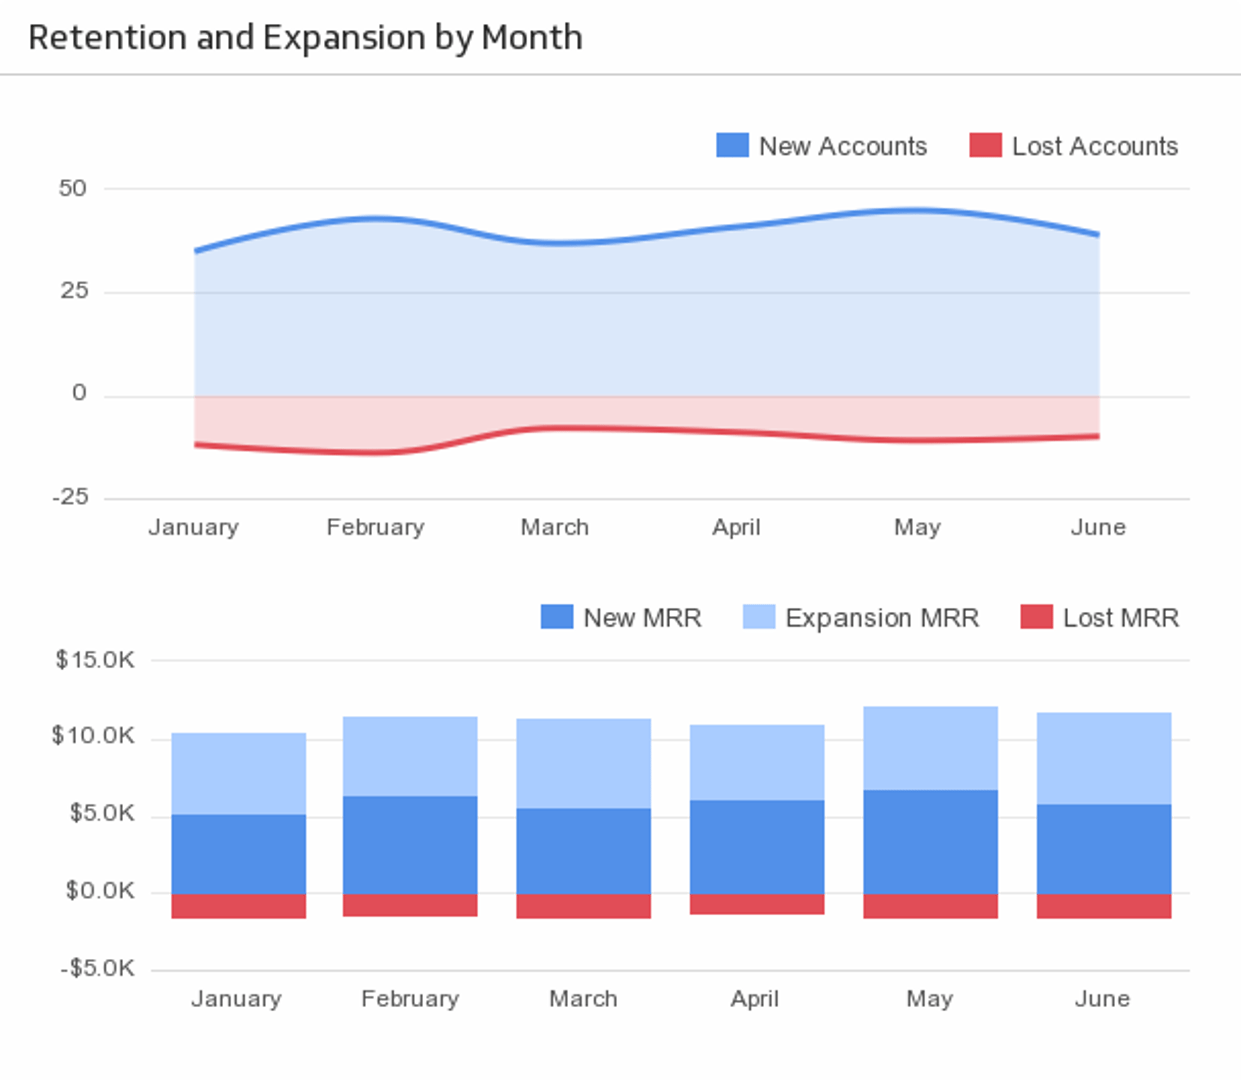
Sample: Retention and Expansion by Month
Monitor business retention and expansion on a month-to-month basis, and keep the pulse of your business in check.
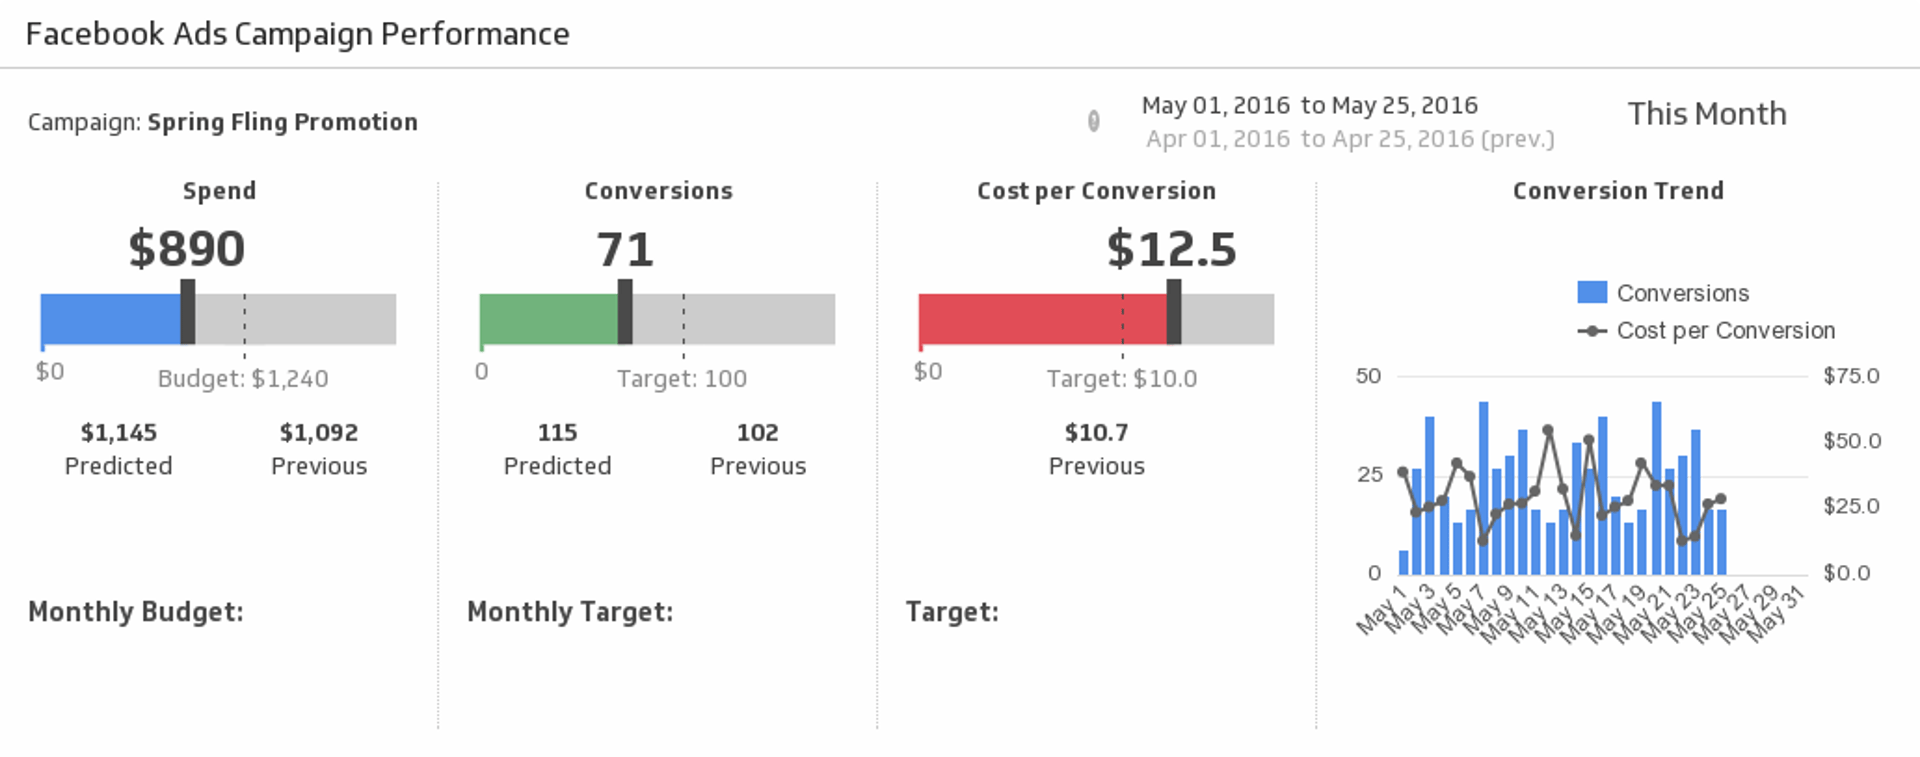
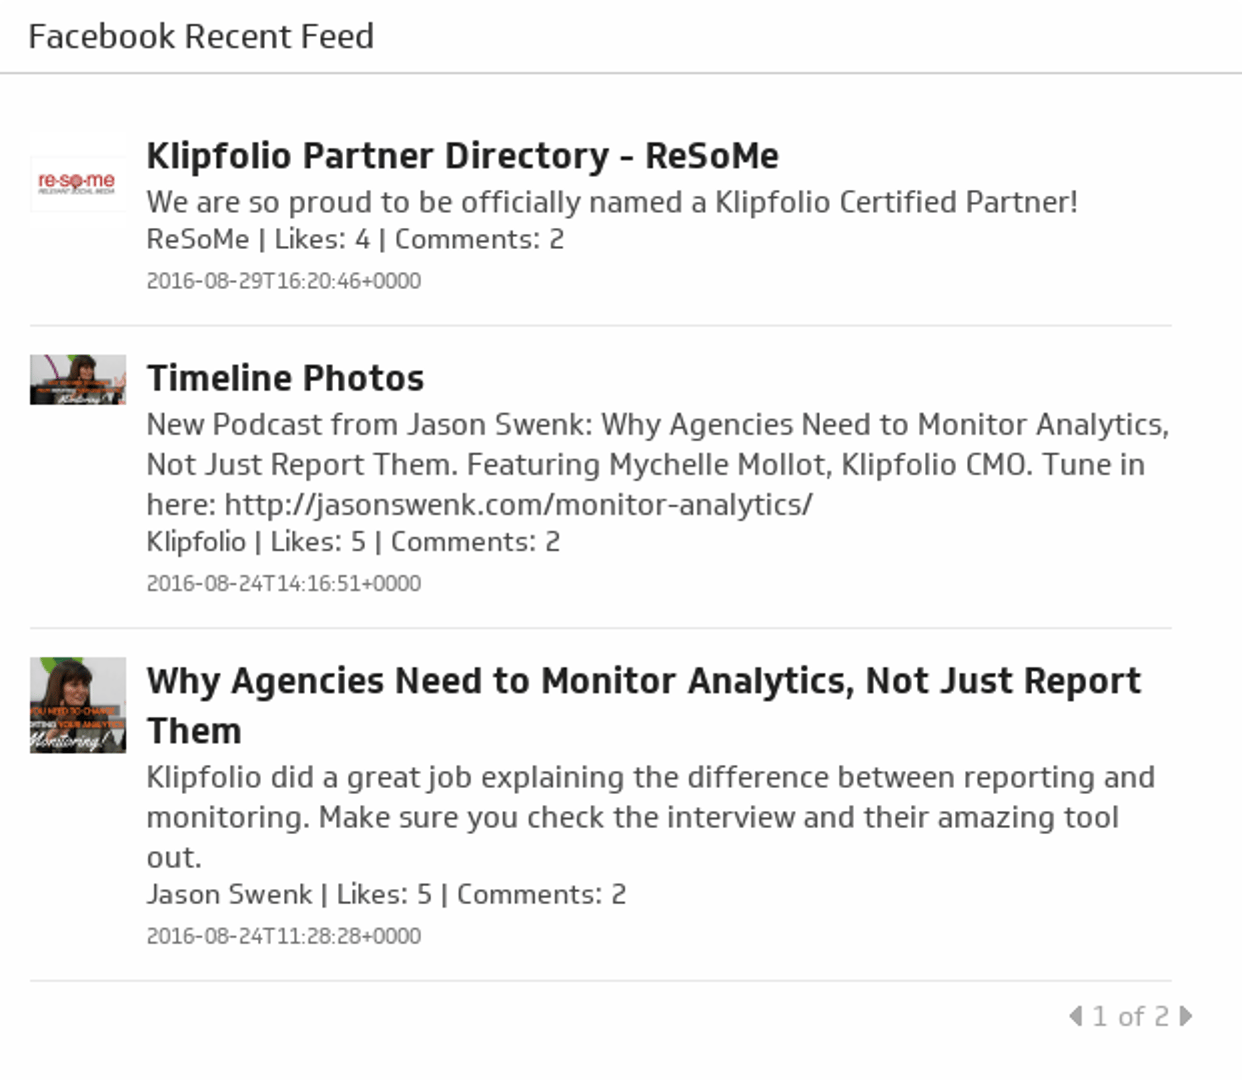
Facebook Campaign Performance
Make sure your message is reaching the right audience by measuring your Facebook Ads campaign performance for the date range of your choice.
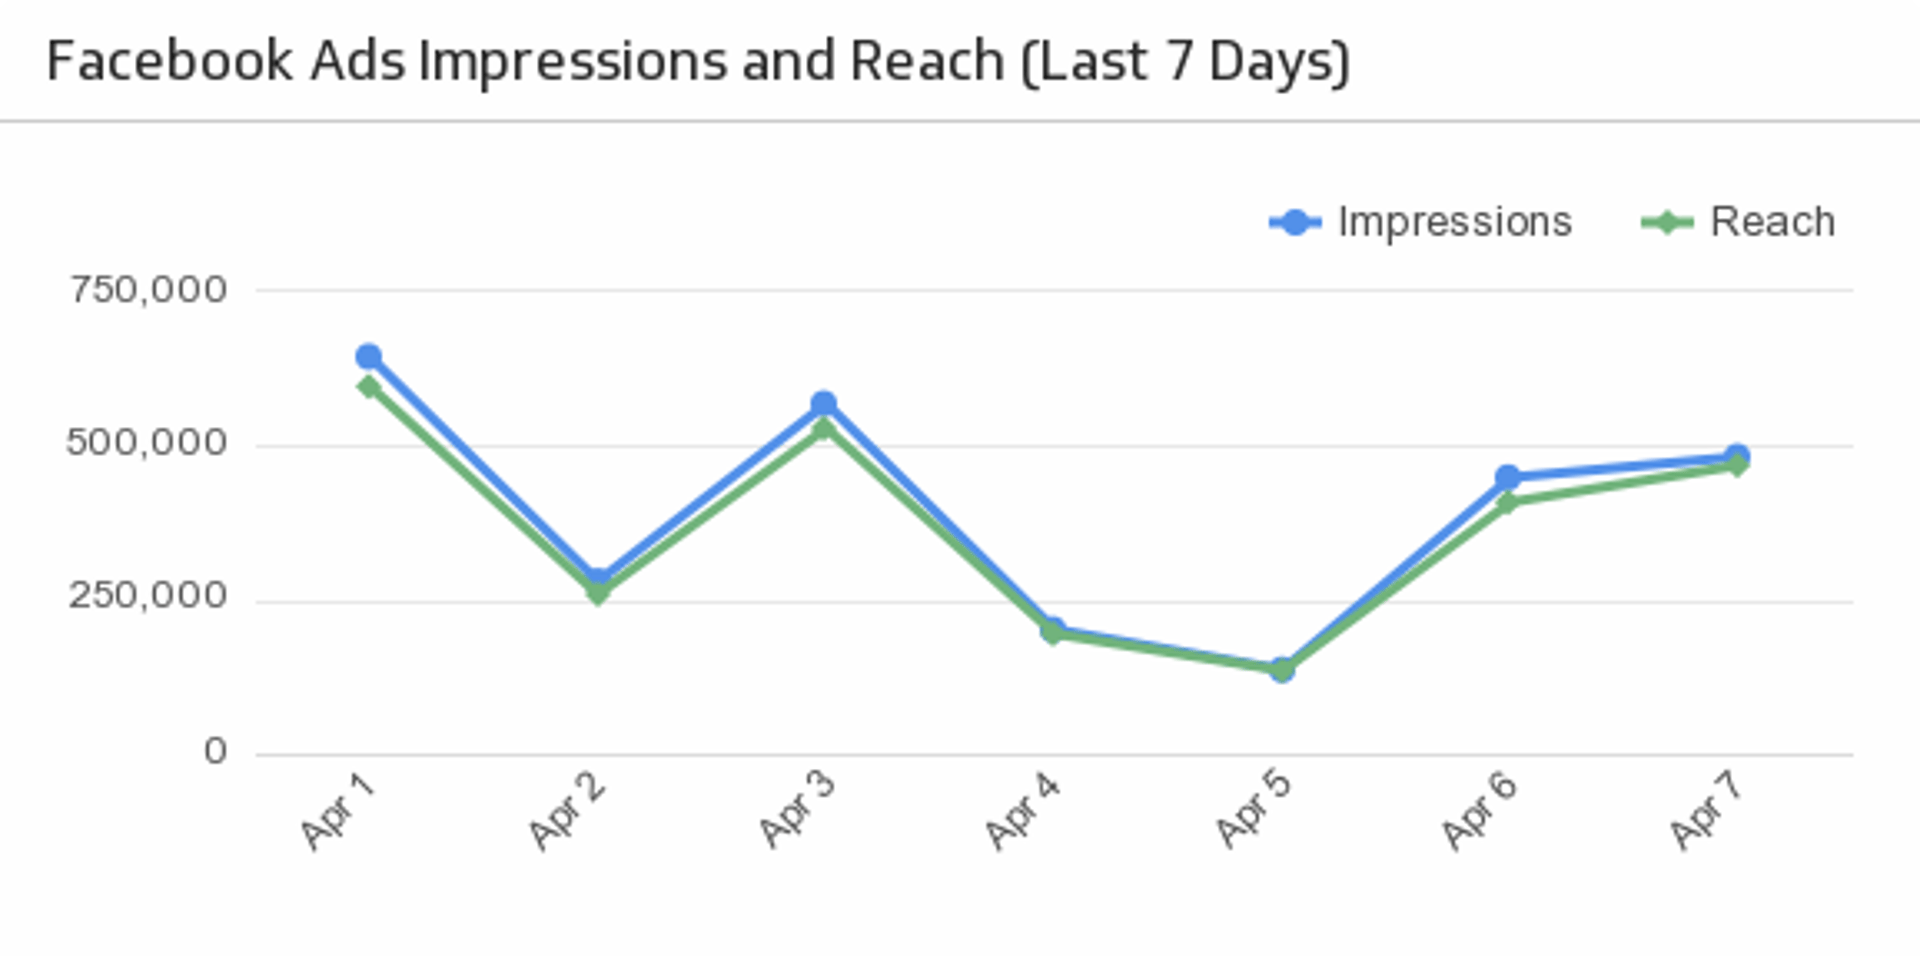
Impressions and Reach (Last 7 Days)
Compare your Facebook Ad impressions with reach over the past 7 days.
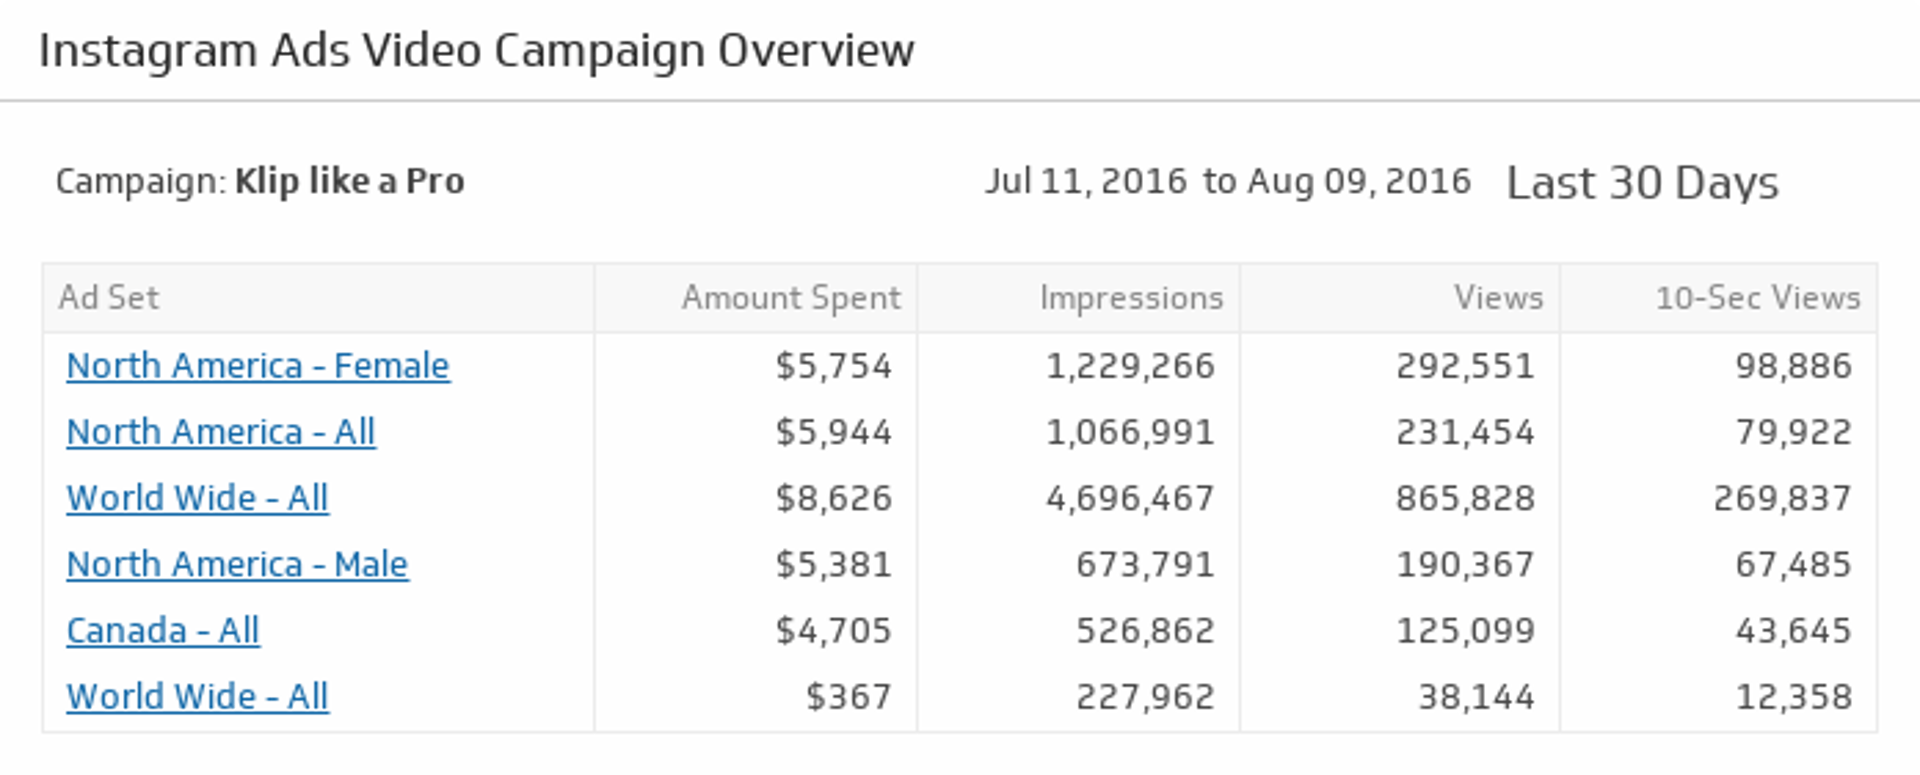
Instagram Ads Video Campaign Overview
Make sure your Instagram Ads are attracting attention. Drill down and get detailed metrics on each video campaign by clicking on an Ad Set name.
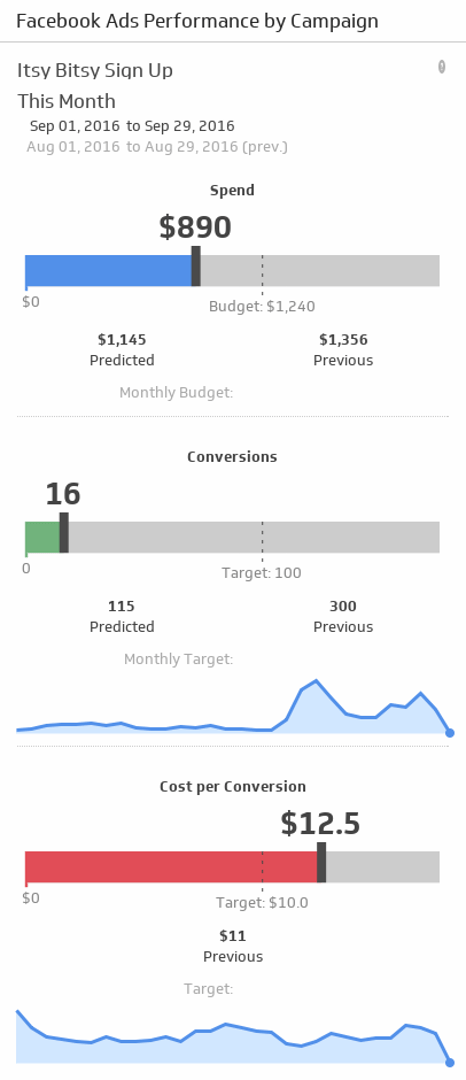
Performance by Campaign
Is your campaign on budget and meeting your conversion targets? Make sure your message is reaching the right audience by monitoring your Facebook Ads campaign performance for the date range and campaign of your choice.
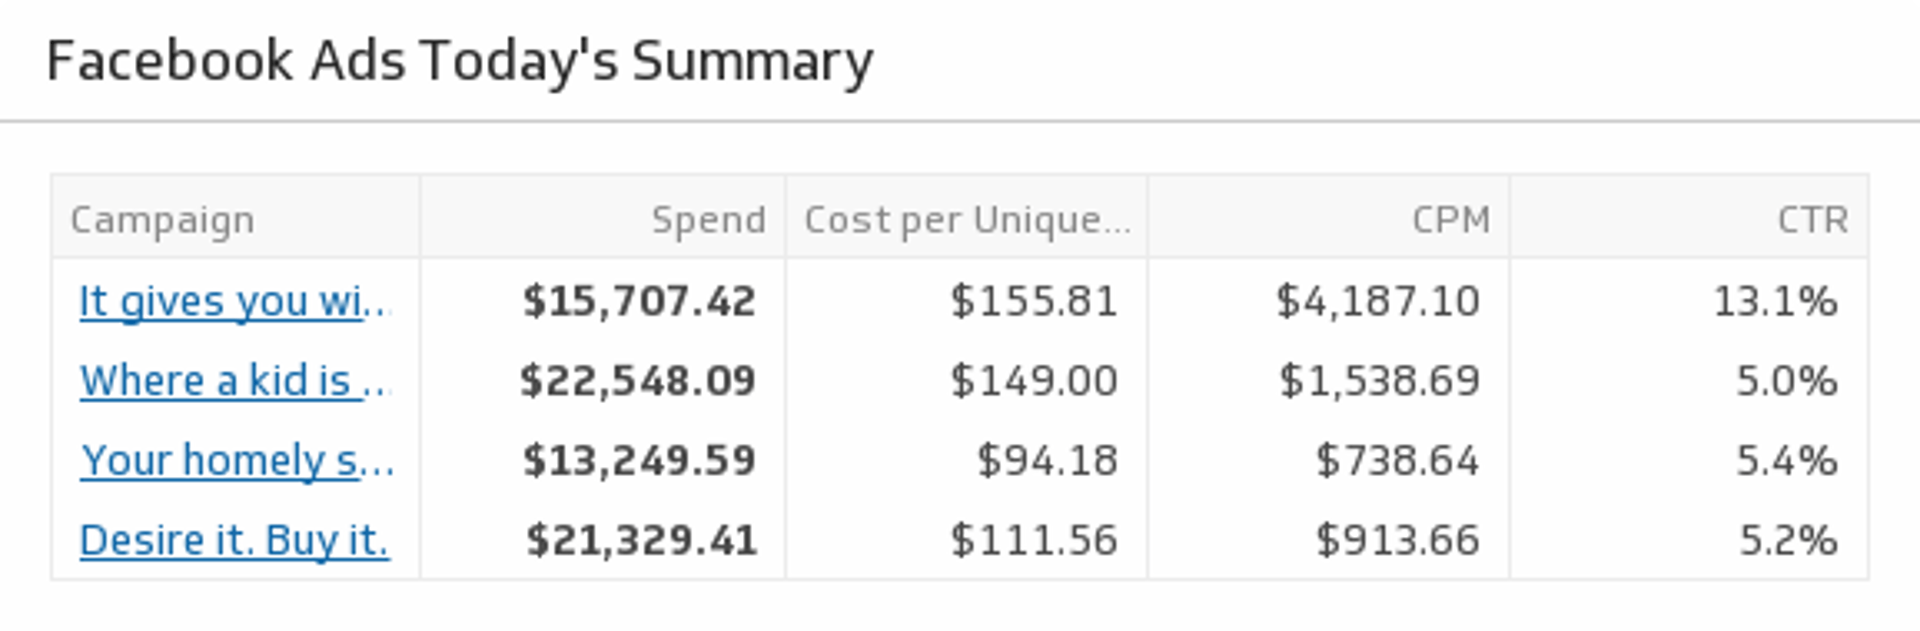
Today's Summary
Drill down into today's campaign metrics and monitor your Facebook Ad objectives.
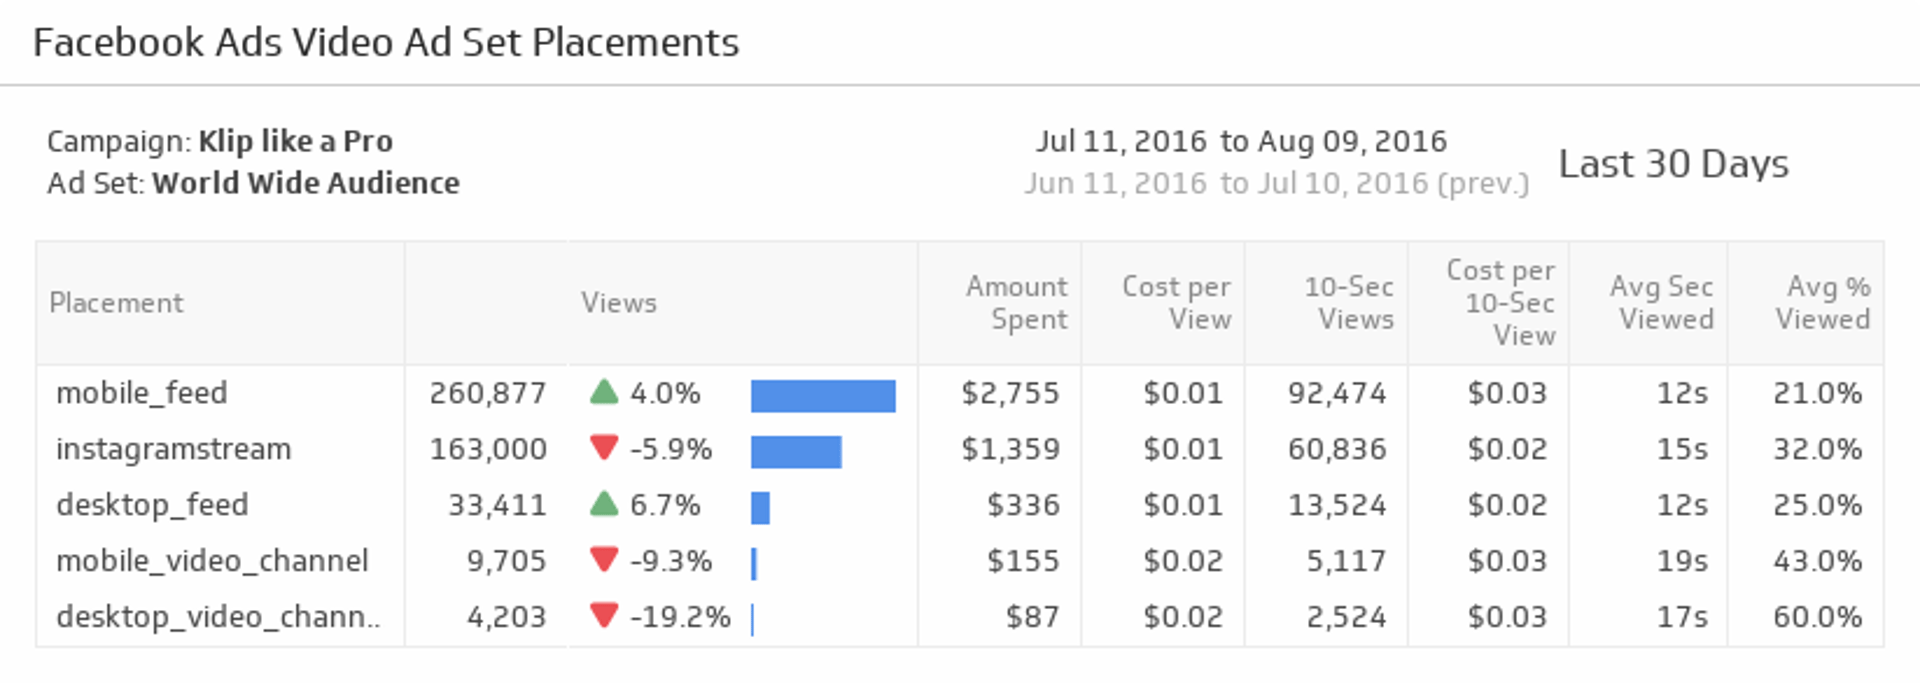
Video Ad Set Placements
Ensure you are reaching your audience across devices by monitoring success rates on each video ad placement.
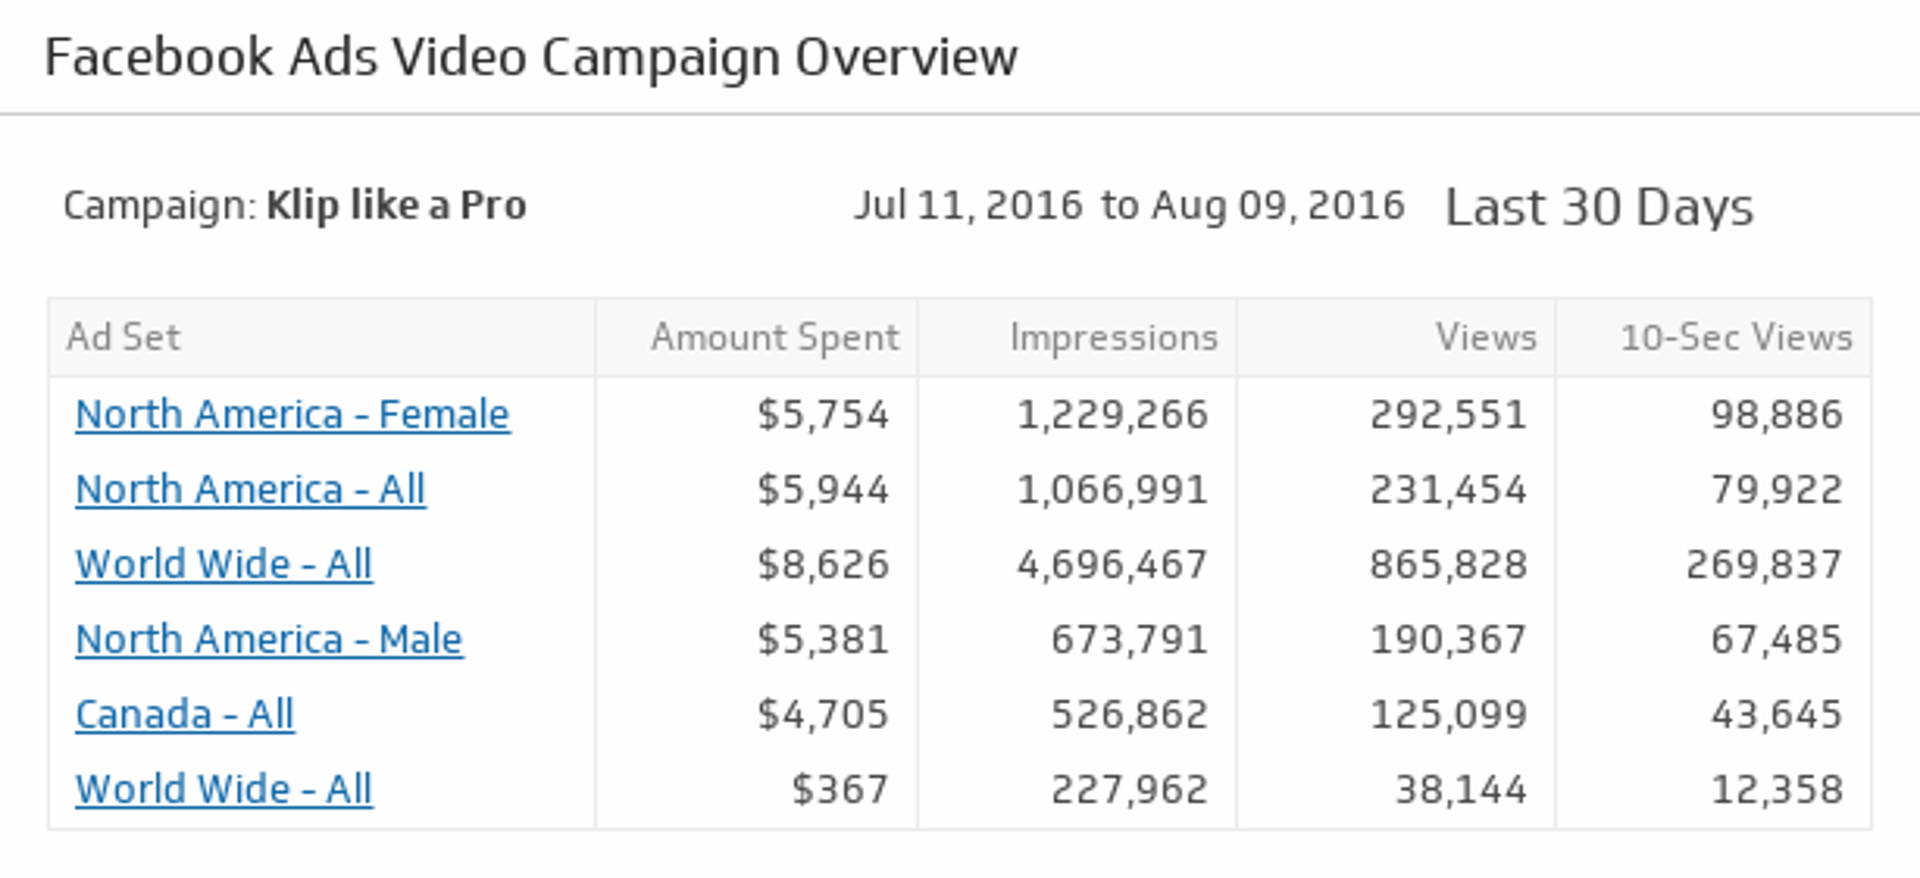
Video Campaign Overview
Quickly find your best performing ad sets and see which videos are resonating with your audience.
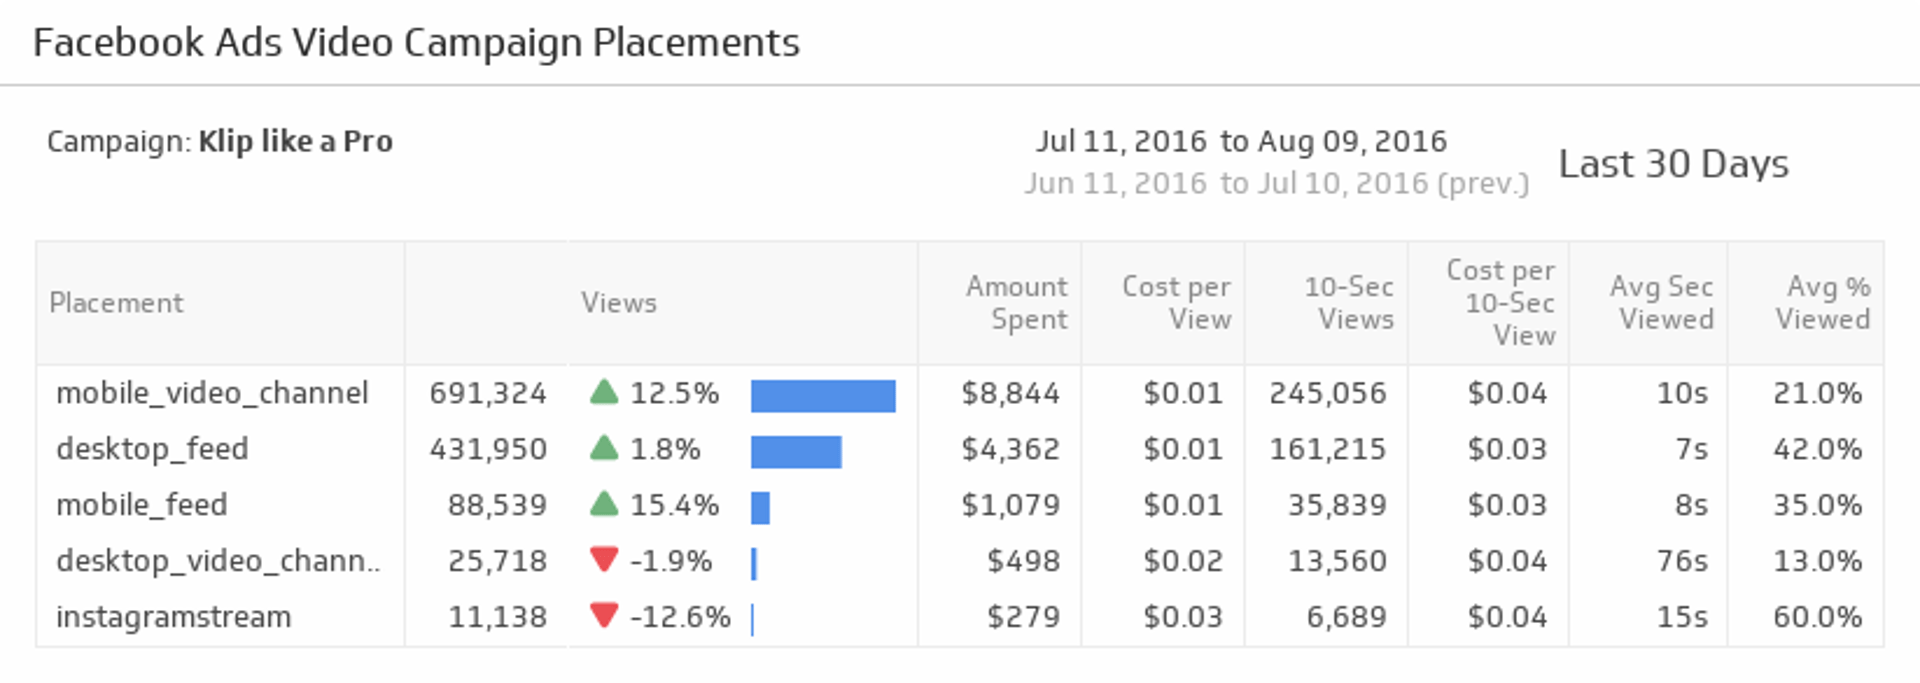
Video Campaign Placements
Track your Facebook video campaign placements so you can optimize your ads, costs and views based on device.
Clicks
See total clicks over the past 30 days and compare it to the previous 30 days. The sparkline shows the trend over the past 30 days.
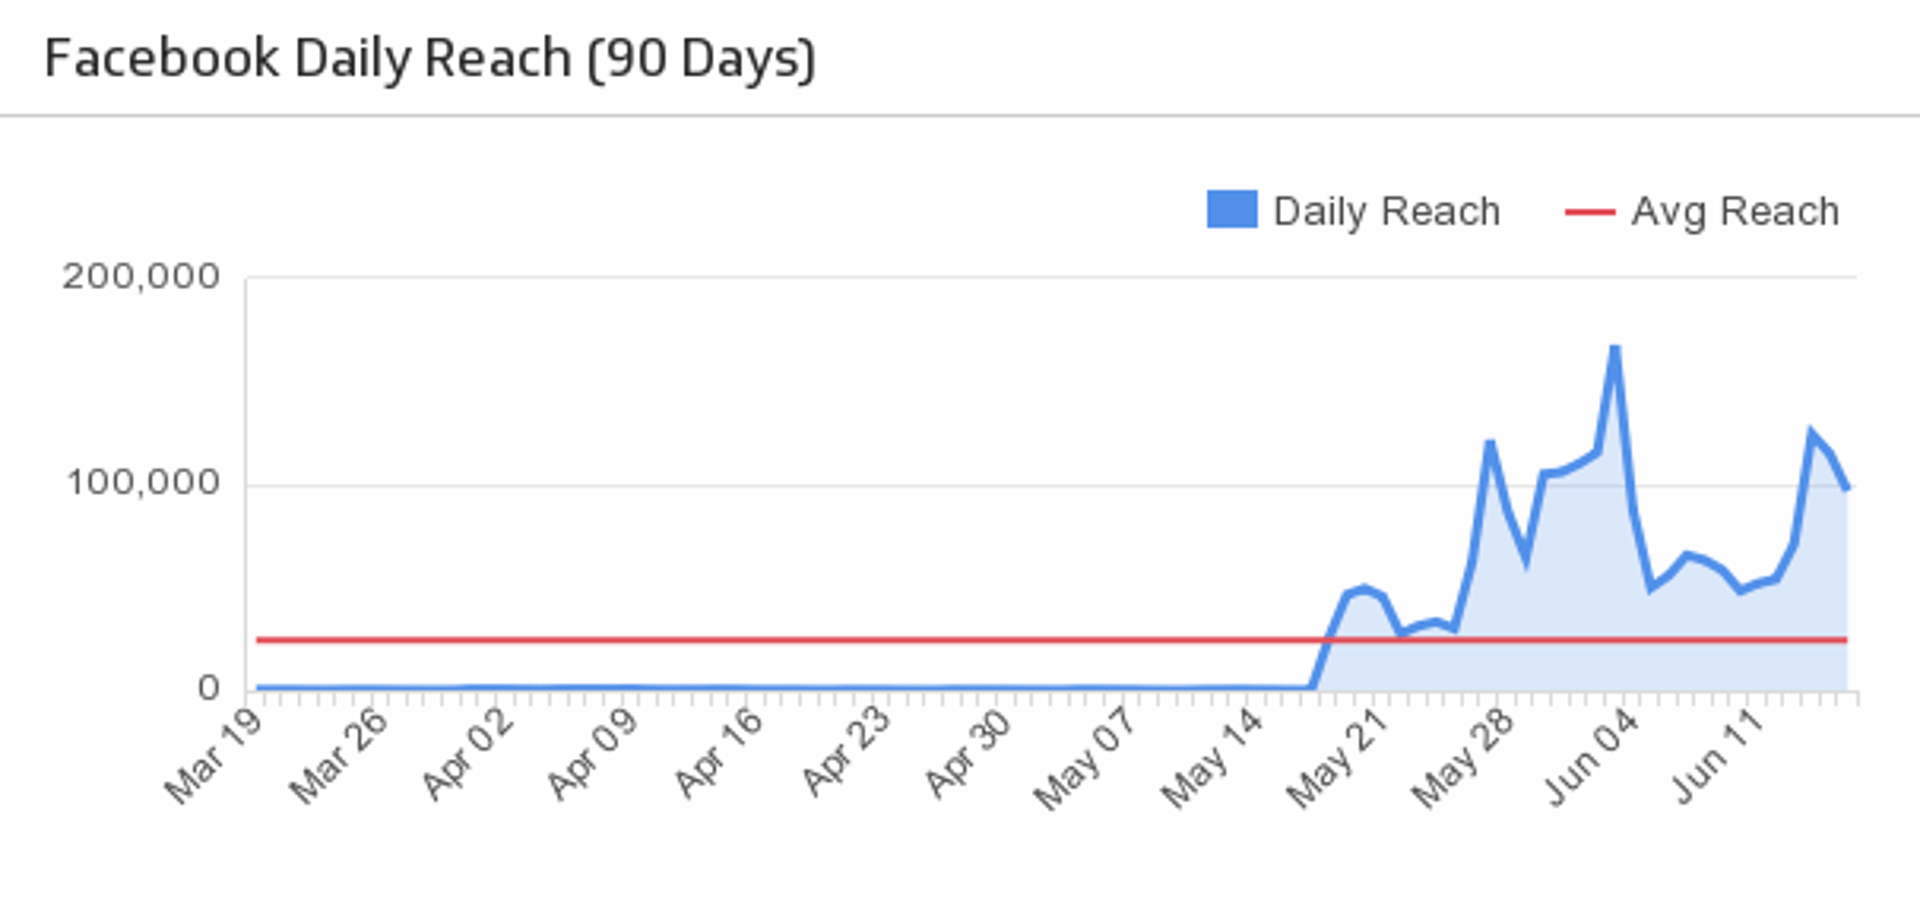
Daily Reach
Track the number of people who have seen posts from your Facebook company page.
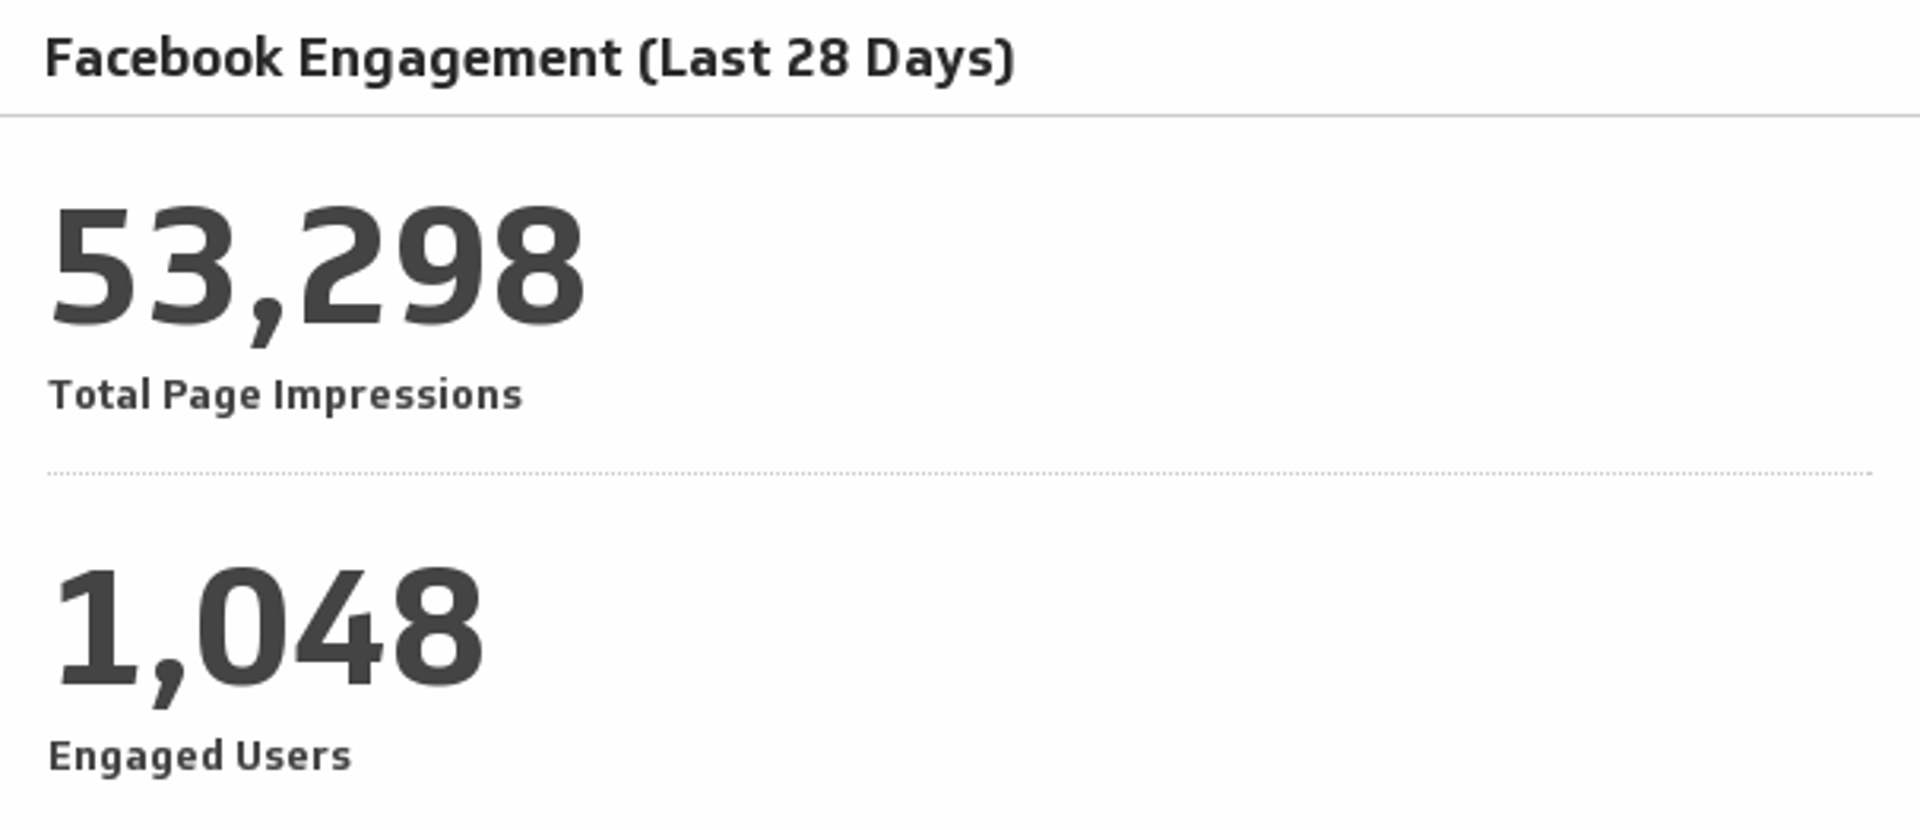
Facebook Engagement
Monitor total page impressions and engaged users over the past 30 days.
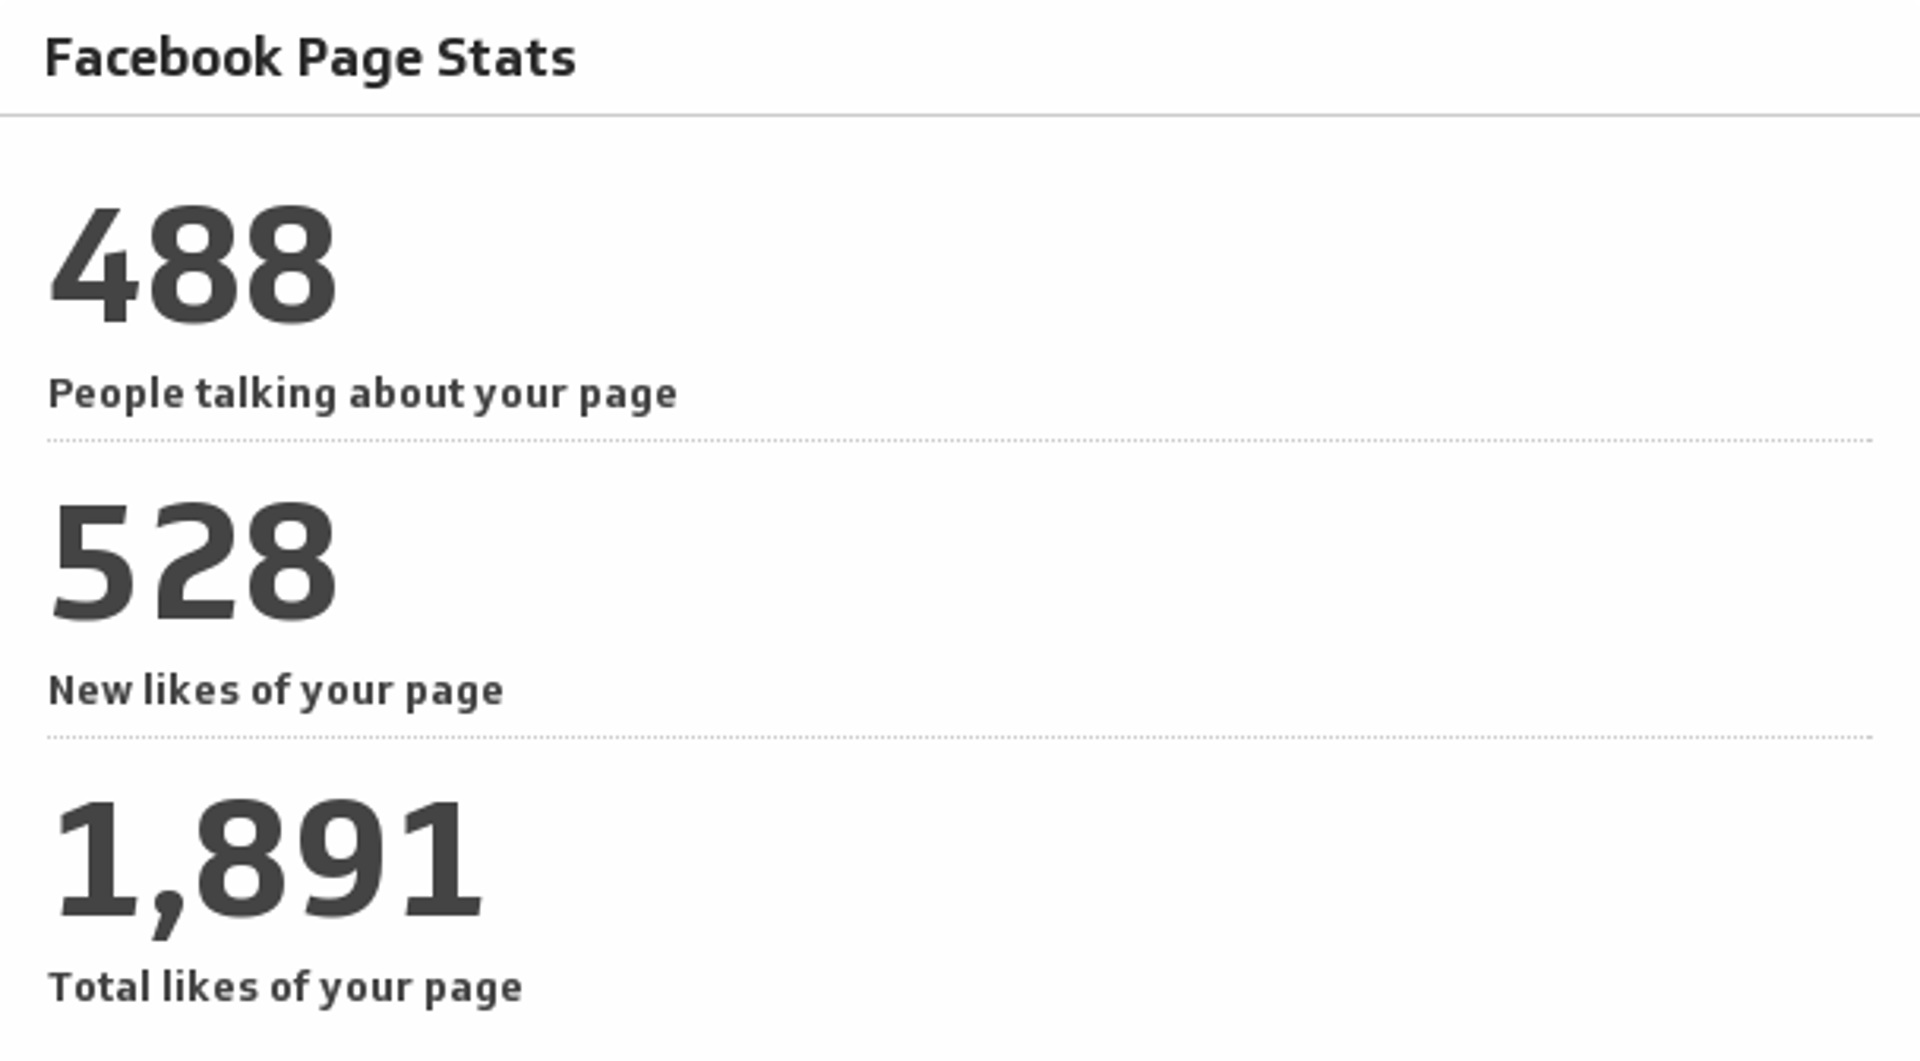
Facebook Page Stats
Always know where you stand on Facebook by monitoring the key metrics of your company page.
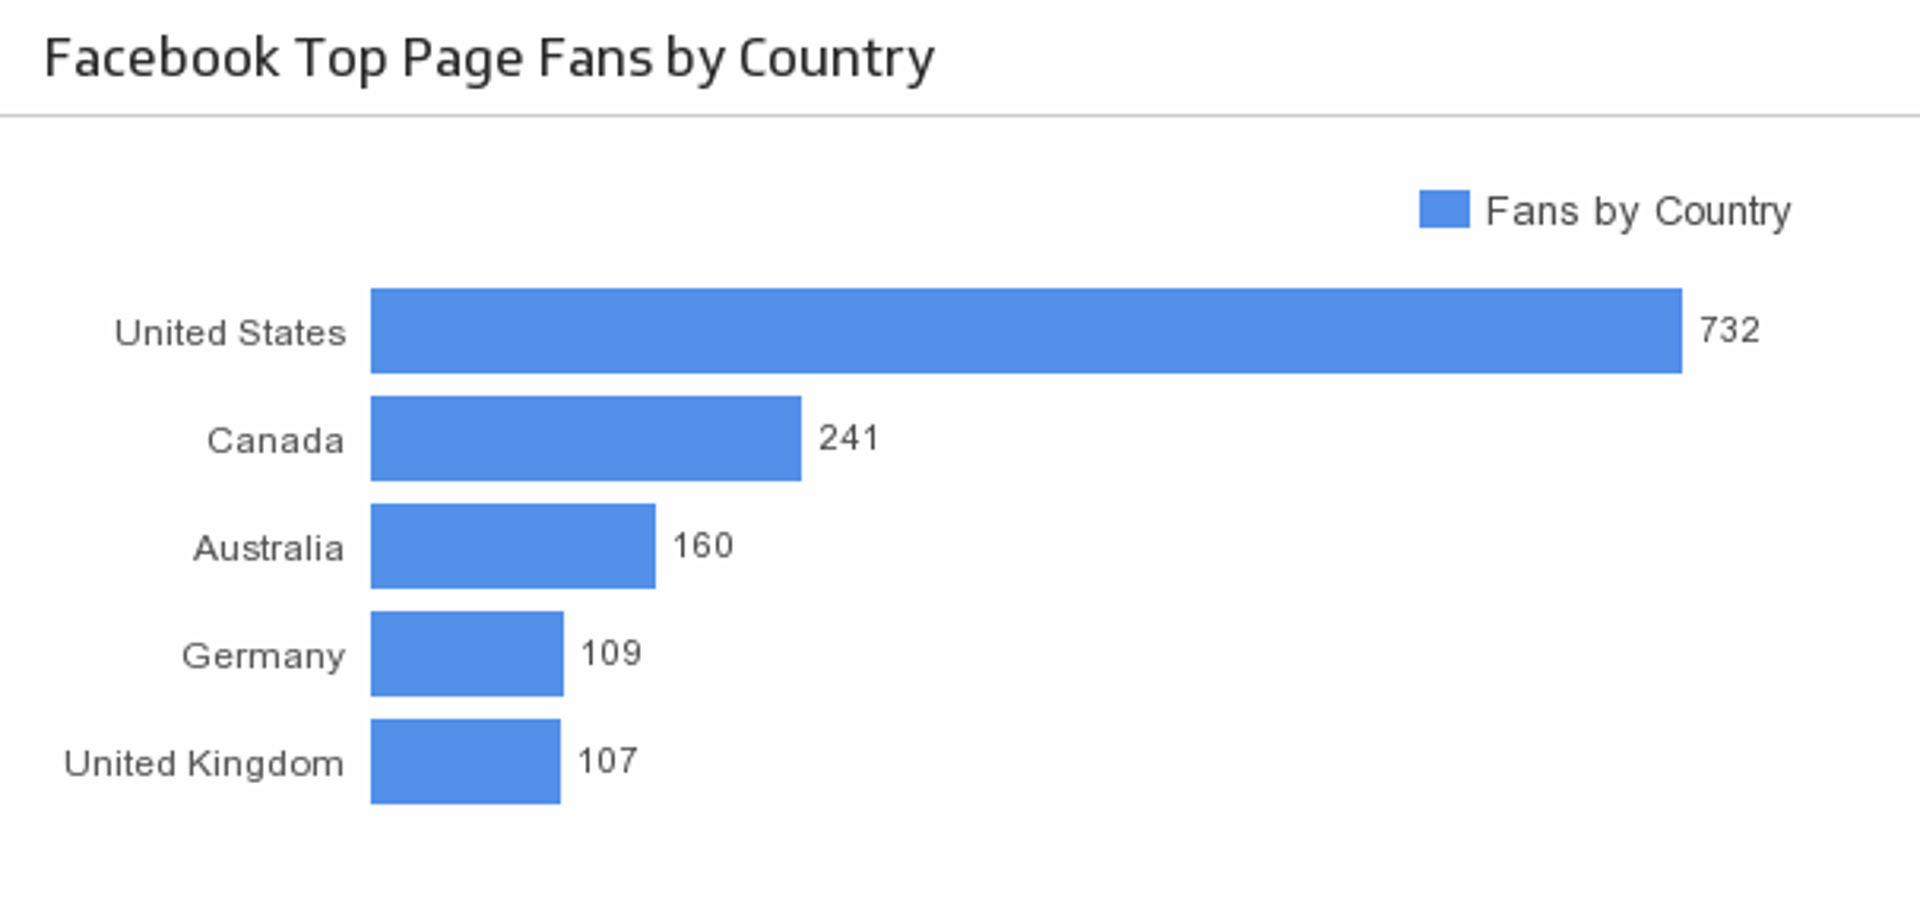
Fans by Country
Discover the top five countries that your Facebook fans are from.

Page Likes
Every Facebook page owner’s first stop is to find out how many people liked their page. And that includes you! See your total Facebook likes and compare it to the last seven days.
Page Visits
Discover total and average page visits by monitoring your Facebook company page traffic over the past 90 days.
Facebook Ads CPM and CPP (Last 7 Days)
Compare cost per impressions and cost per 1000 people reached over the past 7 days.
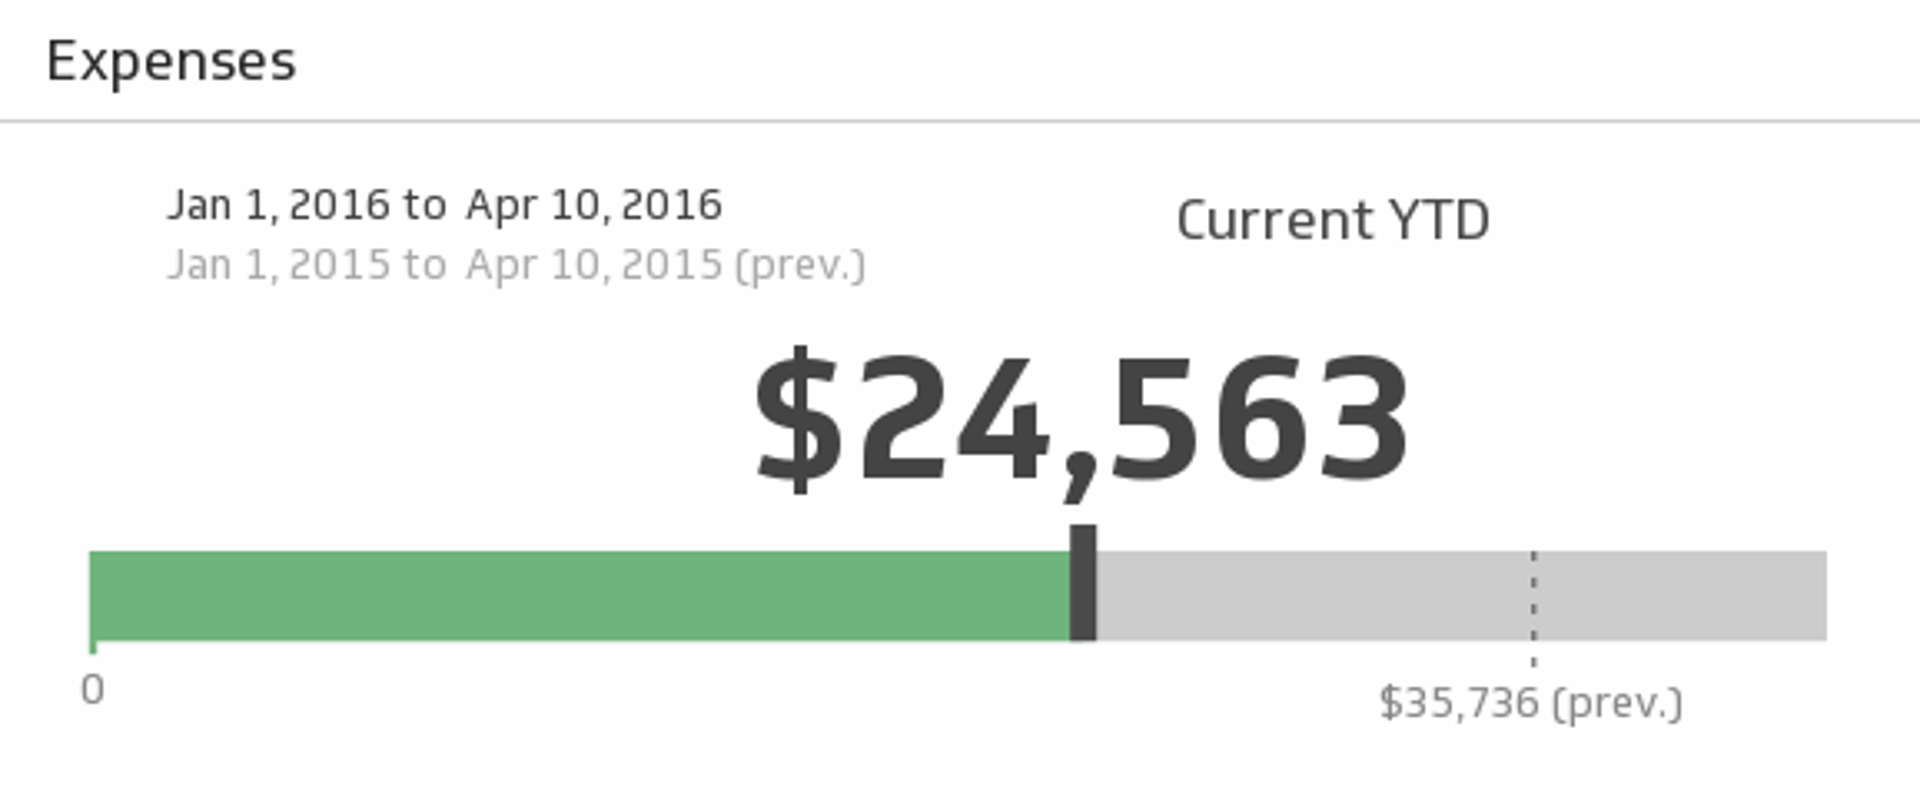
FreshBooks Expenses
Monitor your business expenses for the time period of your choice and see if you spent as much during the previous period.
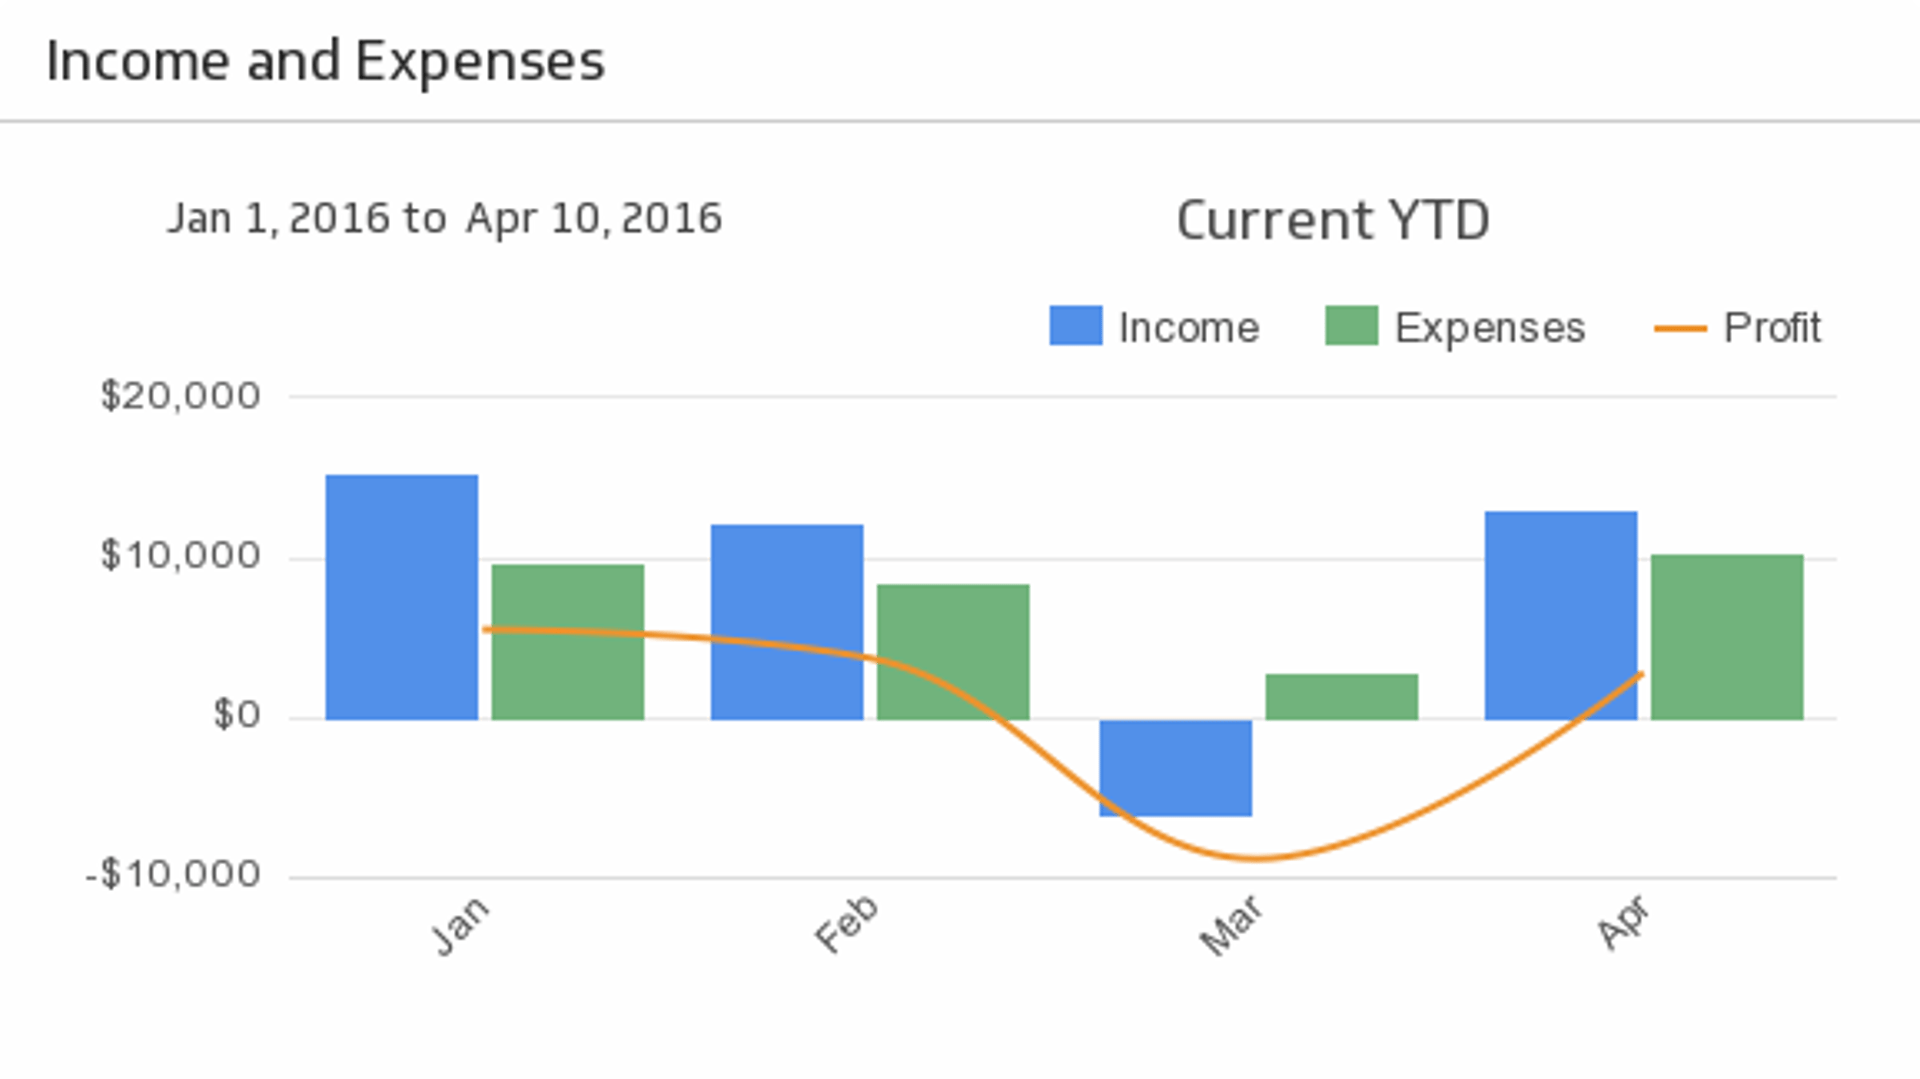
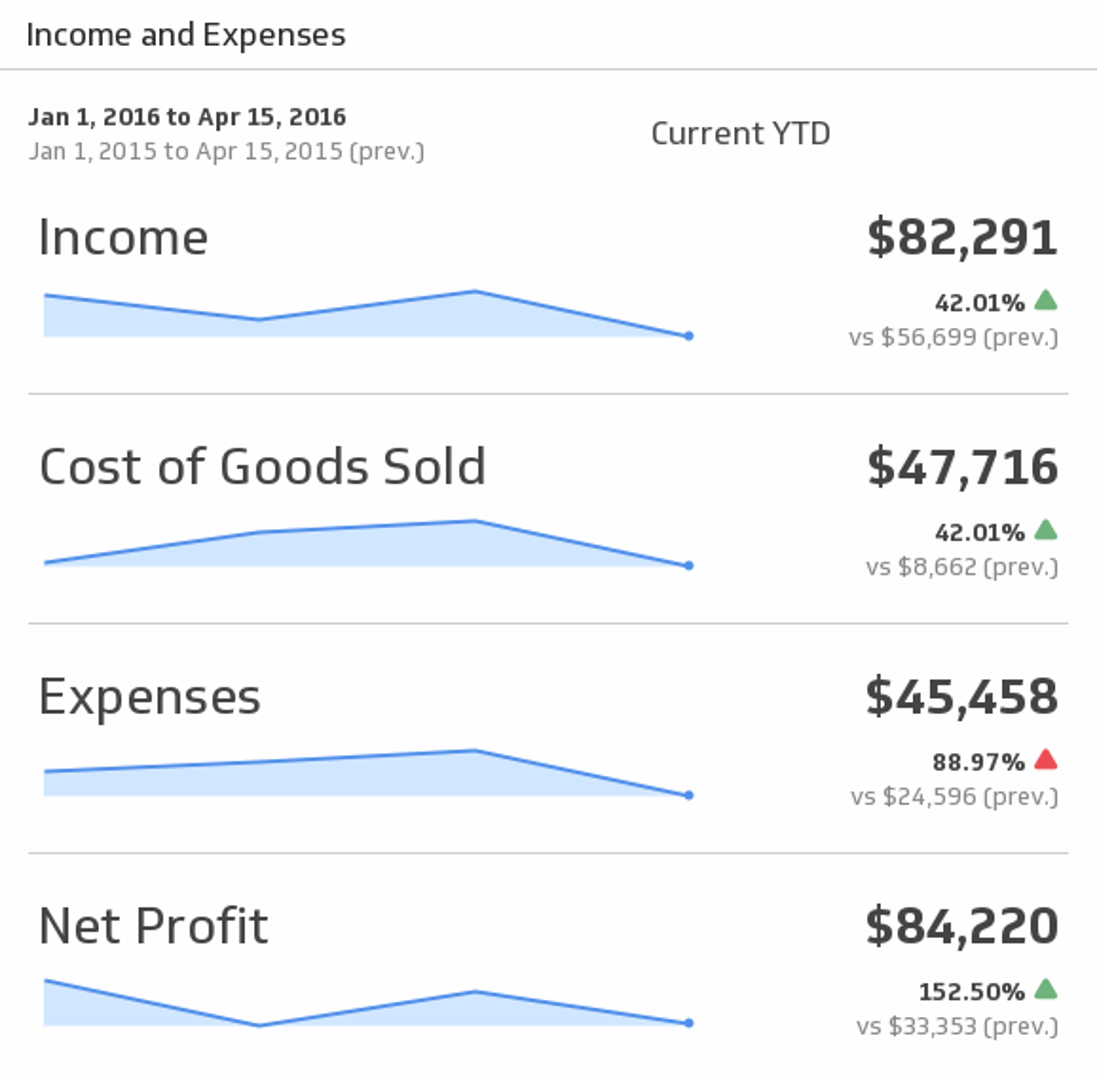
FreshBooks Income and Expenses
Bring your key accounting puzzle pieces - Income, Expenses, and Profit - together to help you make actionable decisions. Choose the time period of your choice from the drop-down menu, and compare to the previous period.
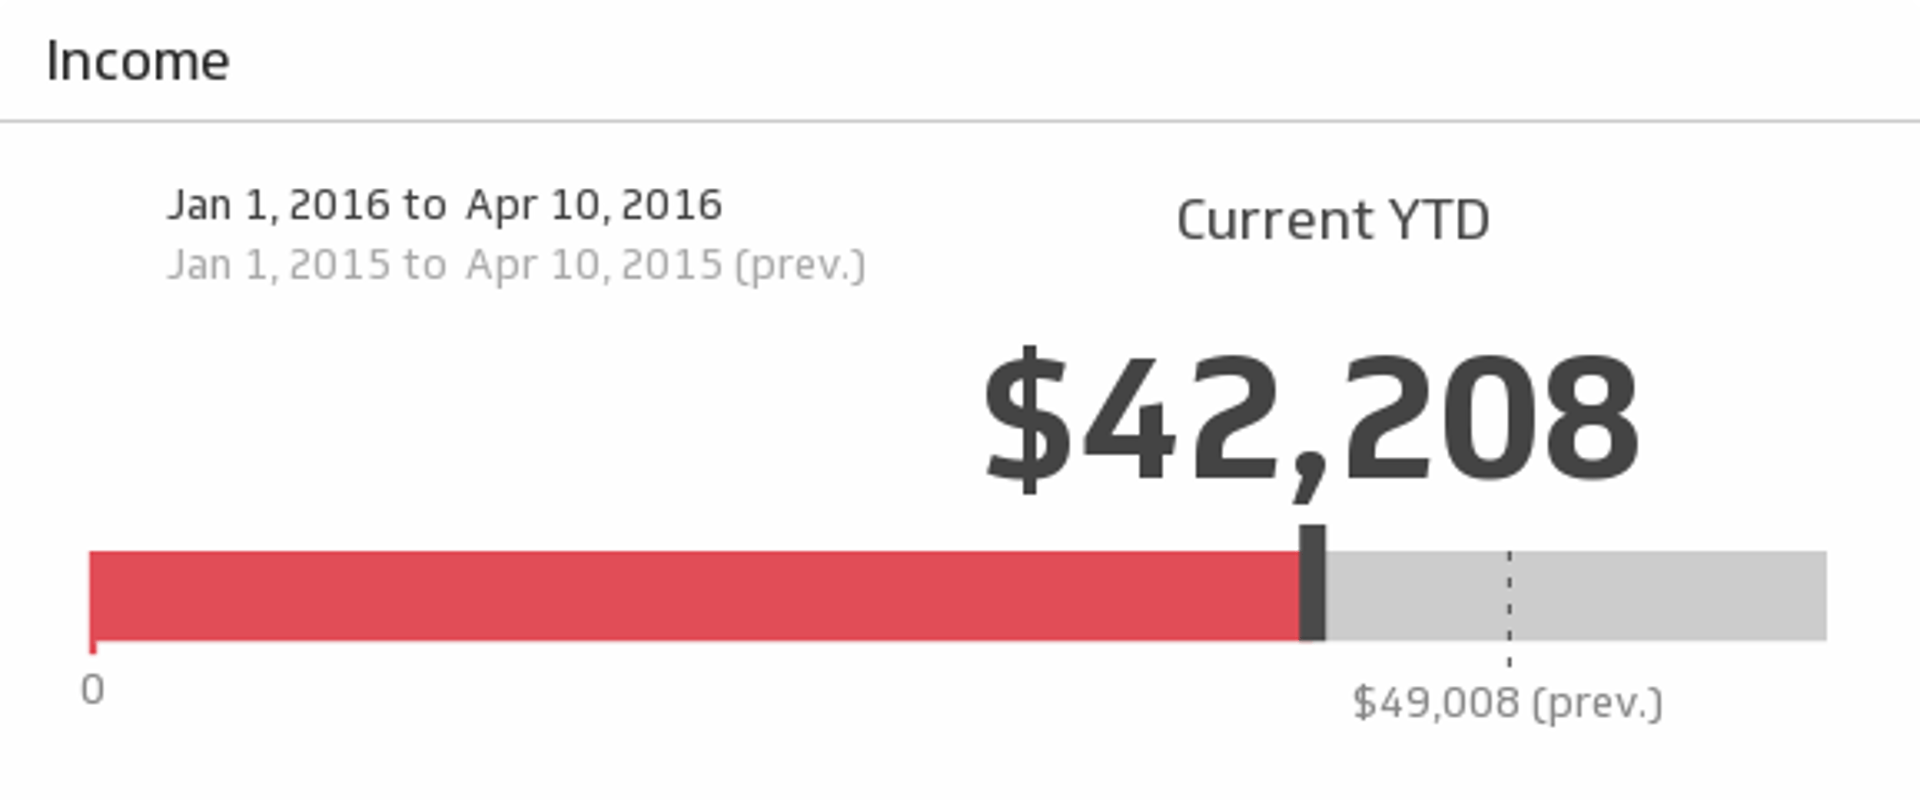
Income
Maintain the financial health of your business with this simple, real-time report on revenue for the time period of your choice.
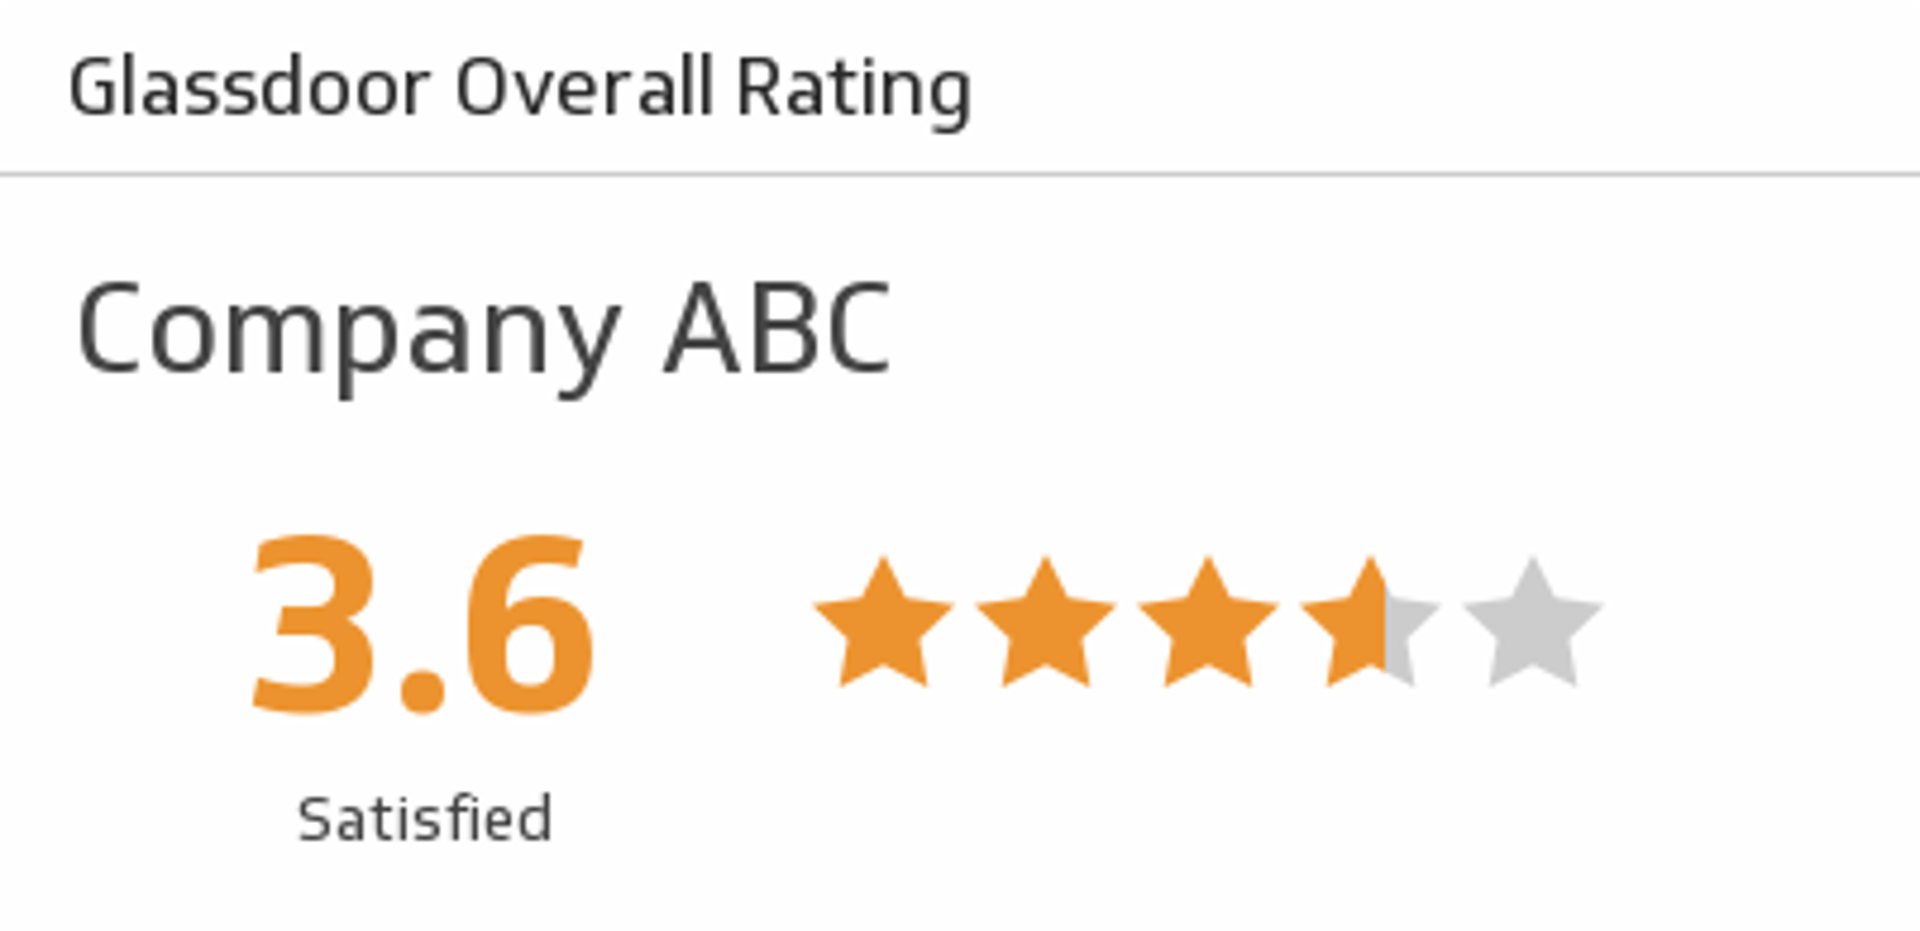
Overall Rating
Discover how a company is rated overall by past and present employees.
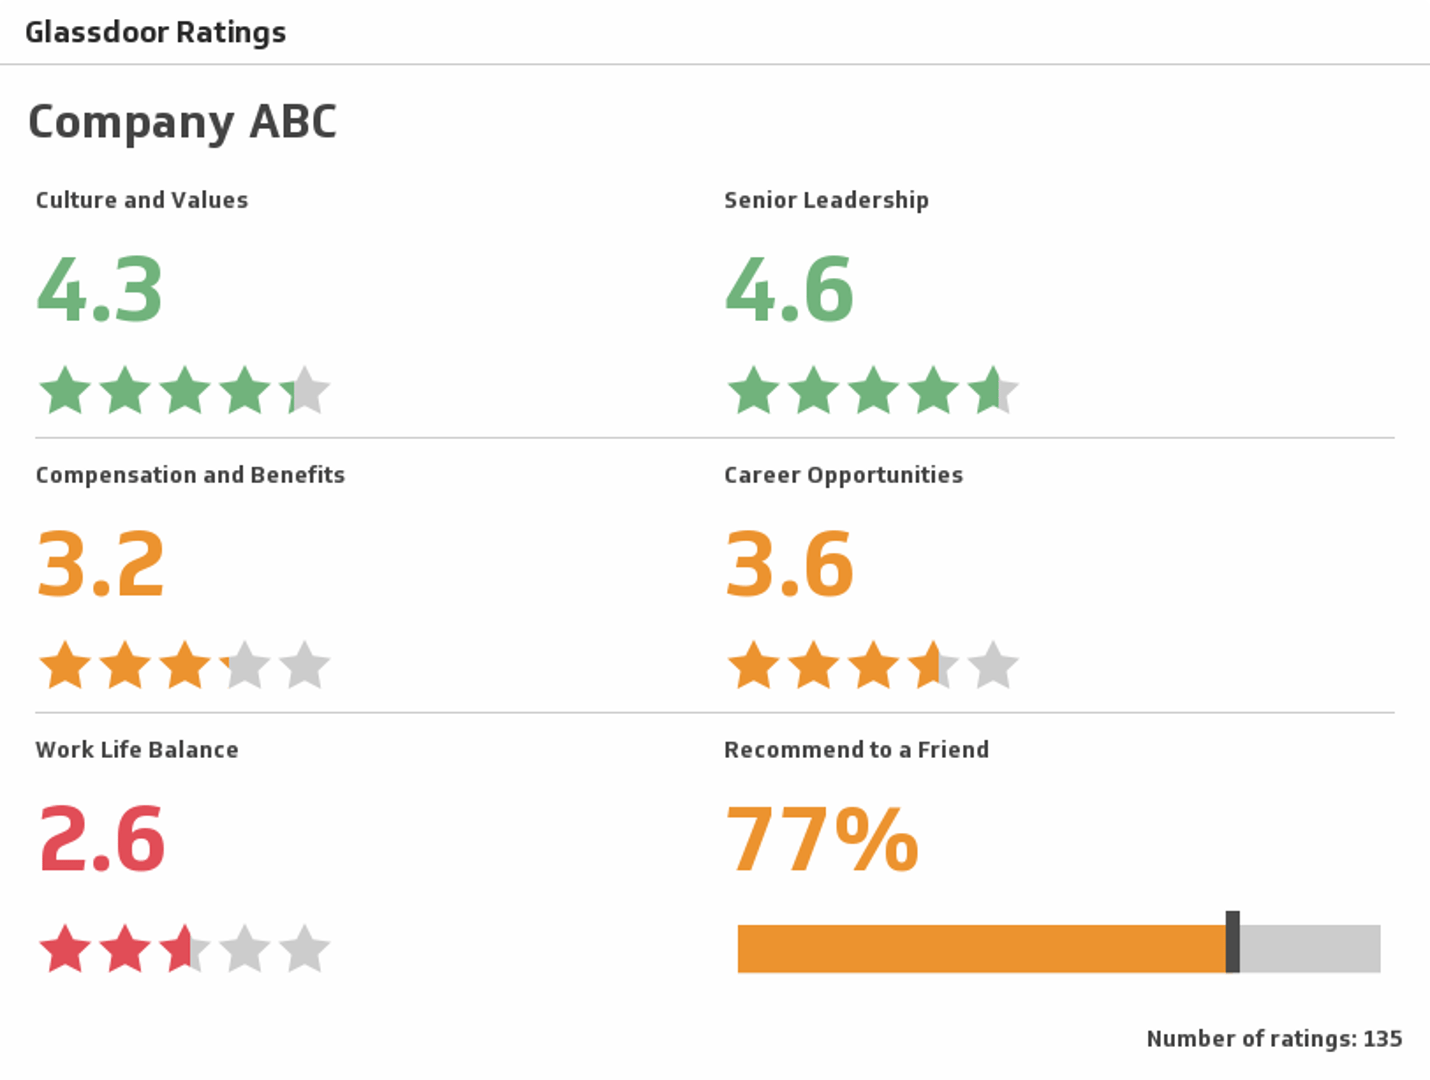
Ratings
Explore a company's ratings in various categories, from work life balance to senior leadership.
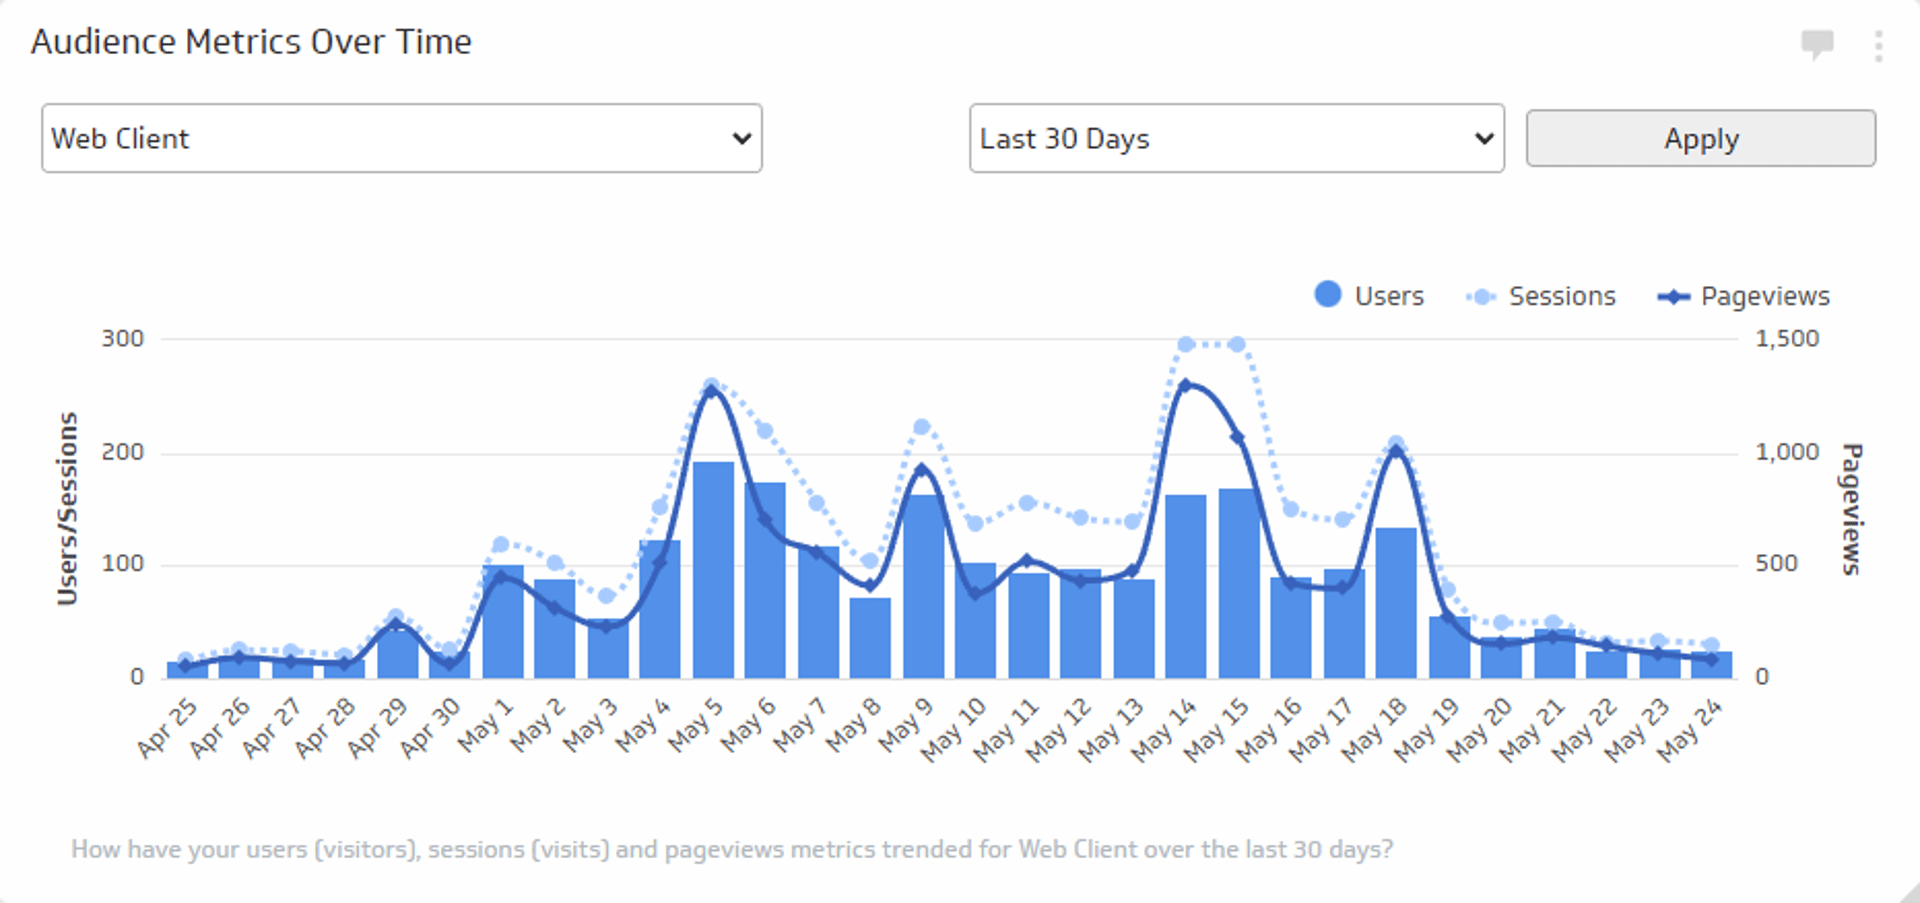
Audience Metrics Over Time
Track the total number of users, sessions, and views trend over time.
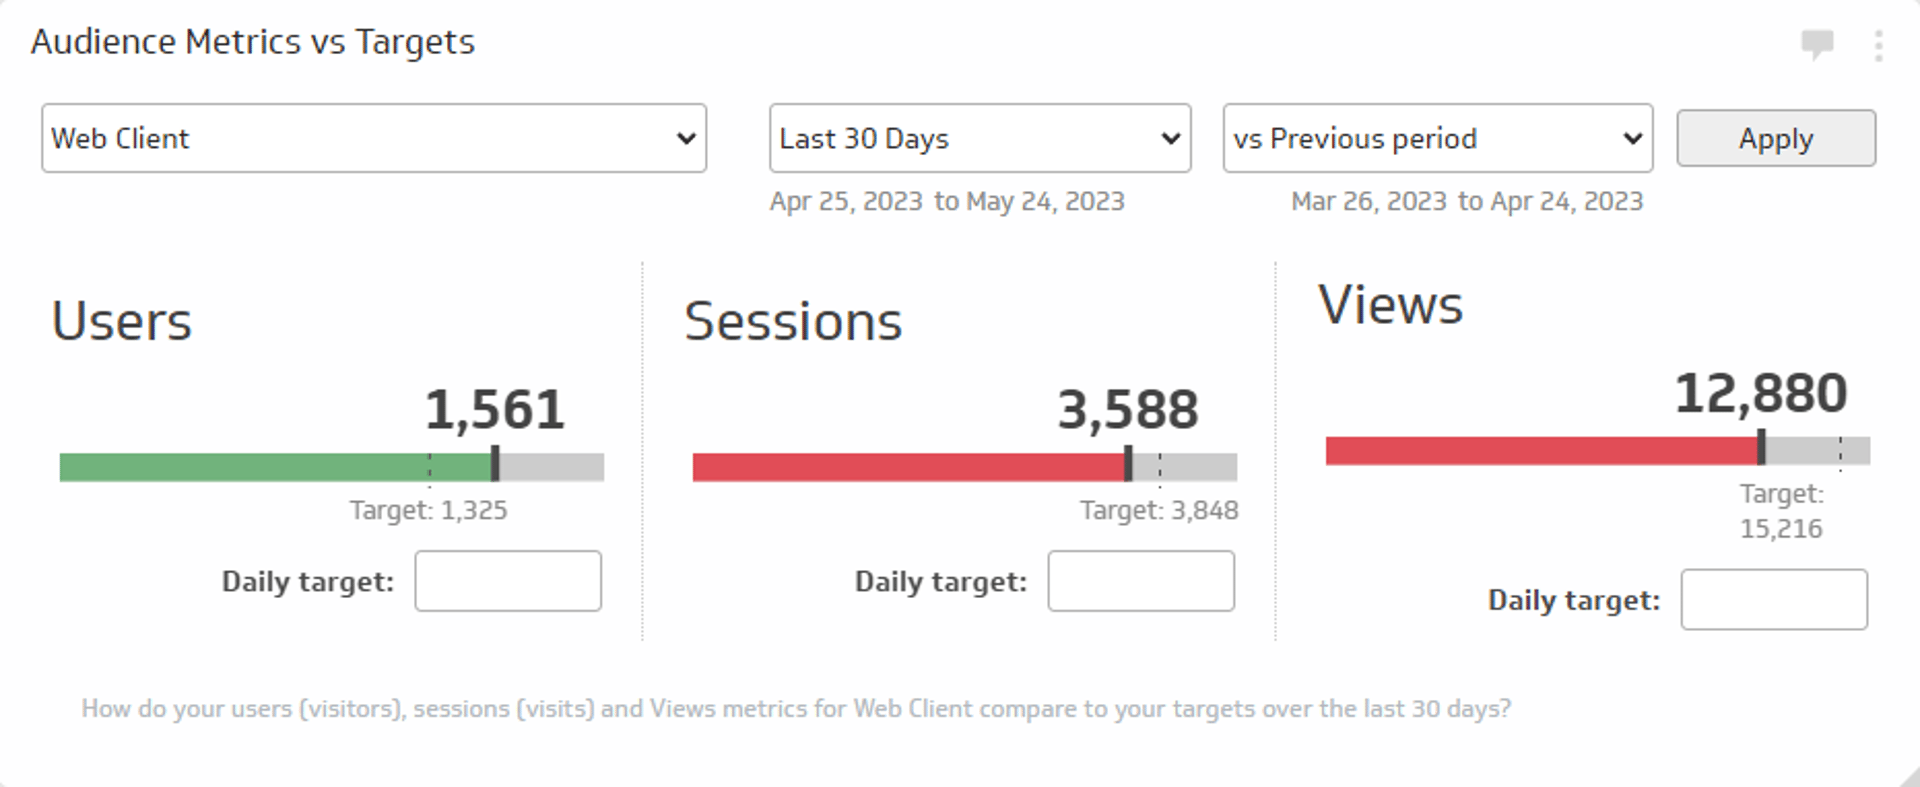
Audience Metrics vs. Targets
Track the total number of users, sessions, and views for a specific time period and compare those values to daily targets or to a previous period.
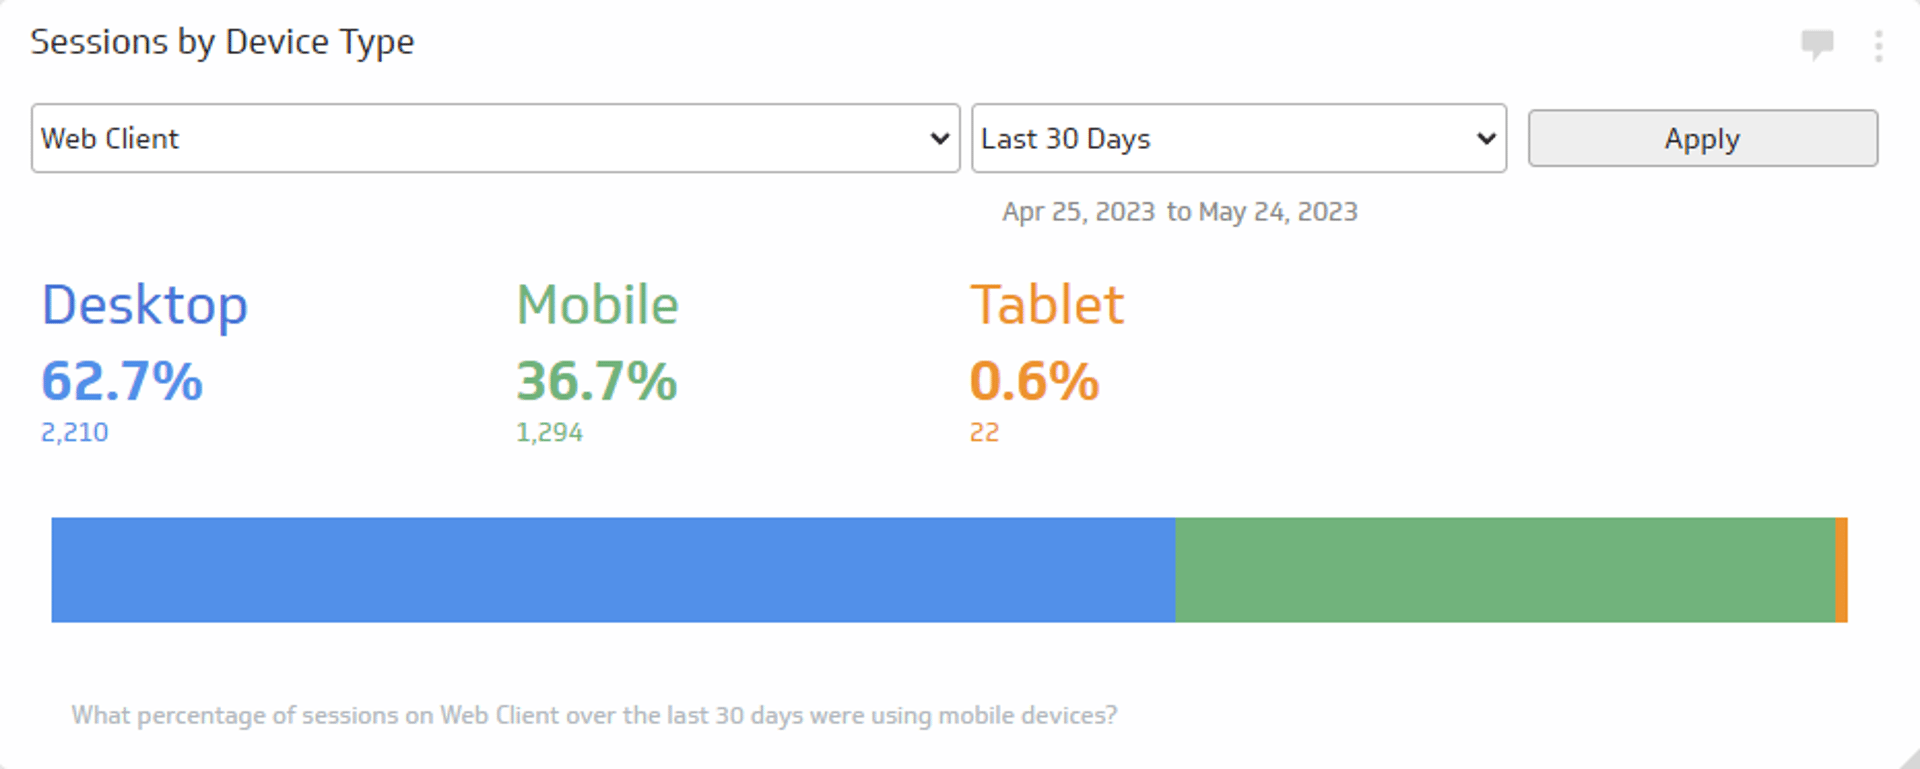
Sessions by Device Type
See what devices your website traffic is using for the time period of your choice.
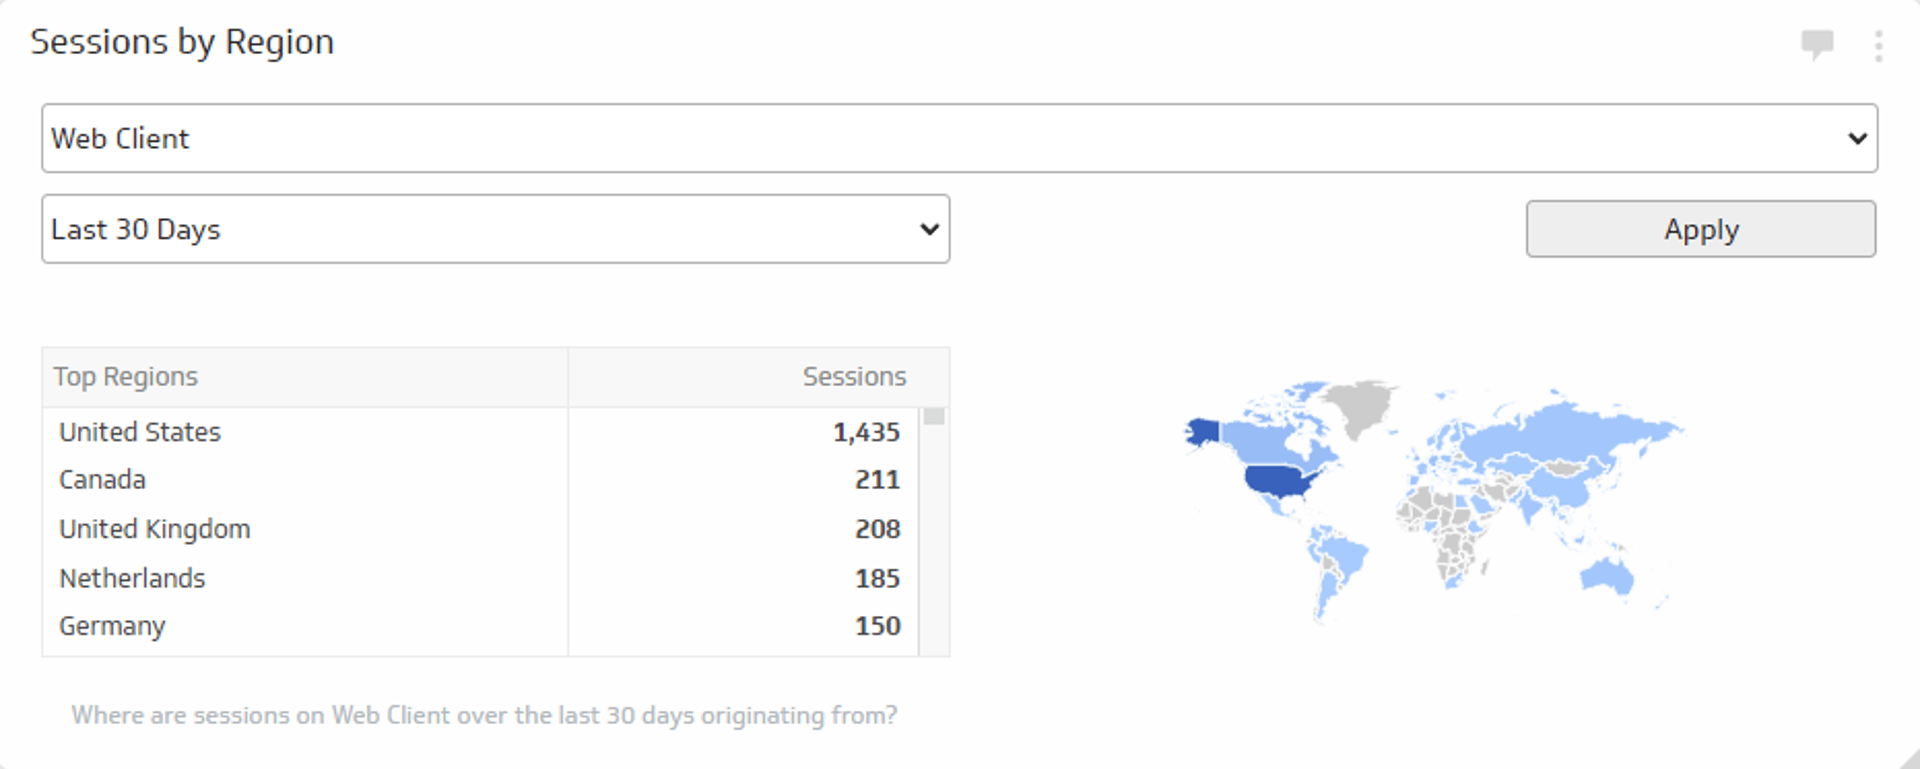
Sessions by Region
Track where around the world your website sessions are coming from during the time period of your choice.
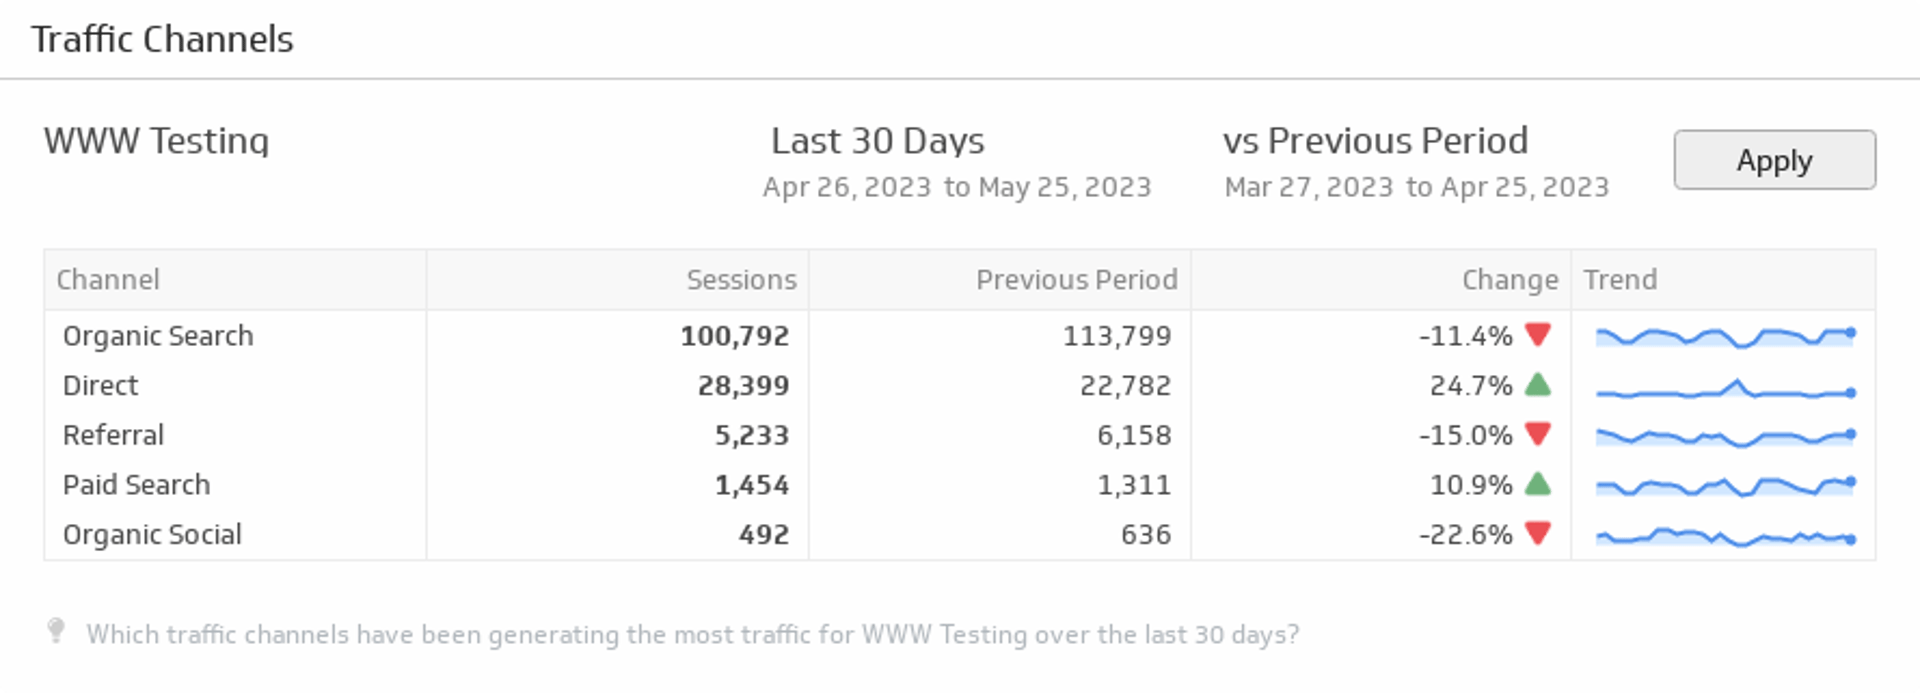
Traffic Channels
Displays the top online channels generating traffic to your website during the time period of your choice.
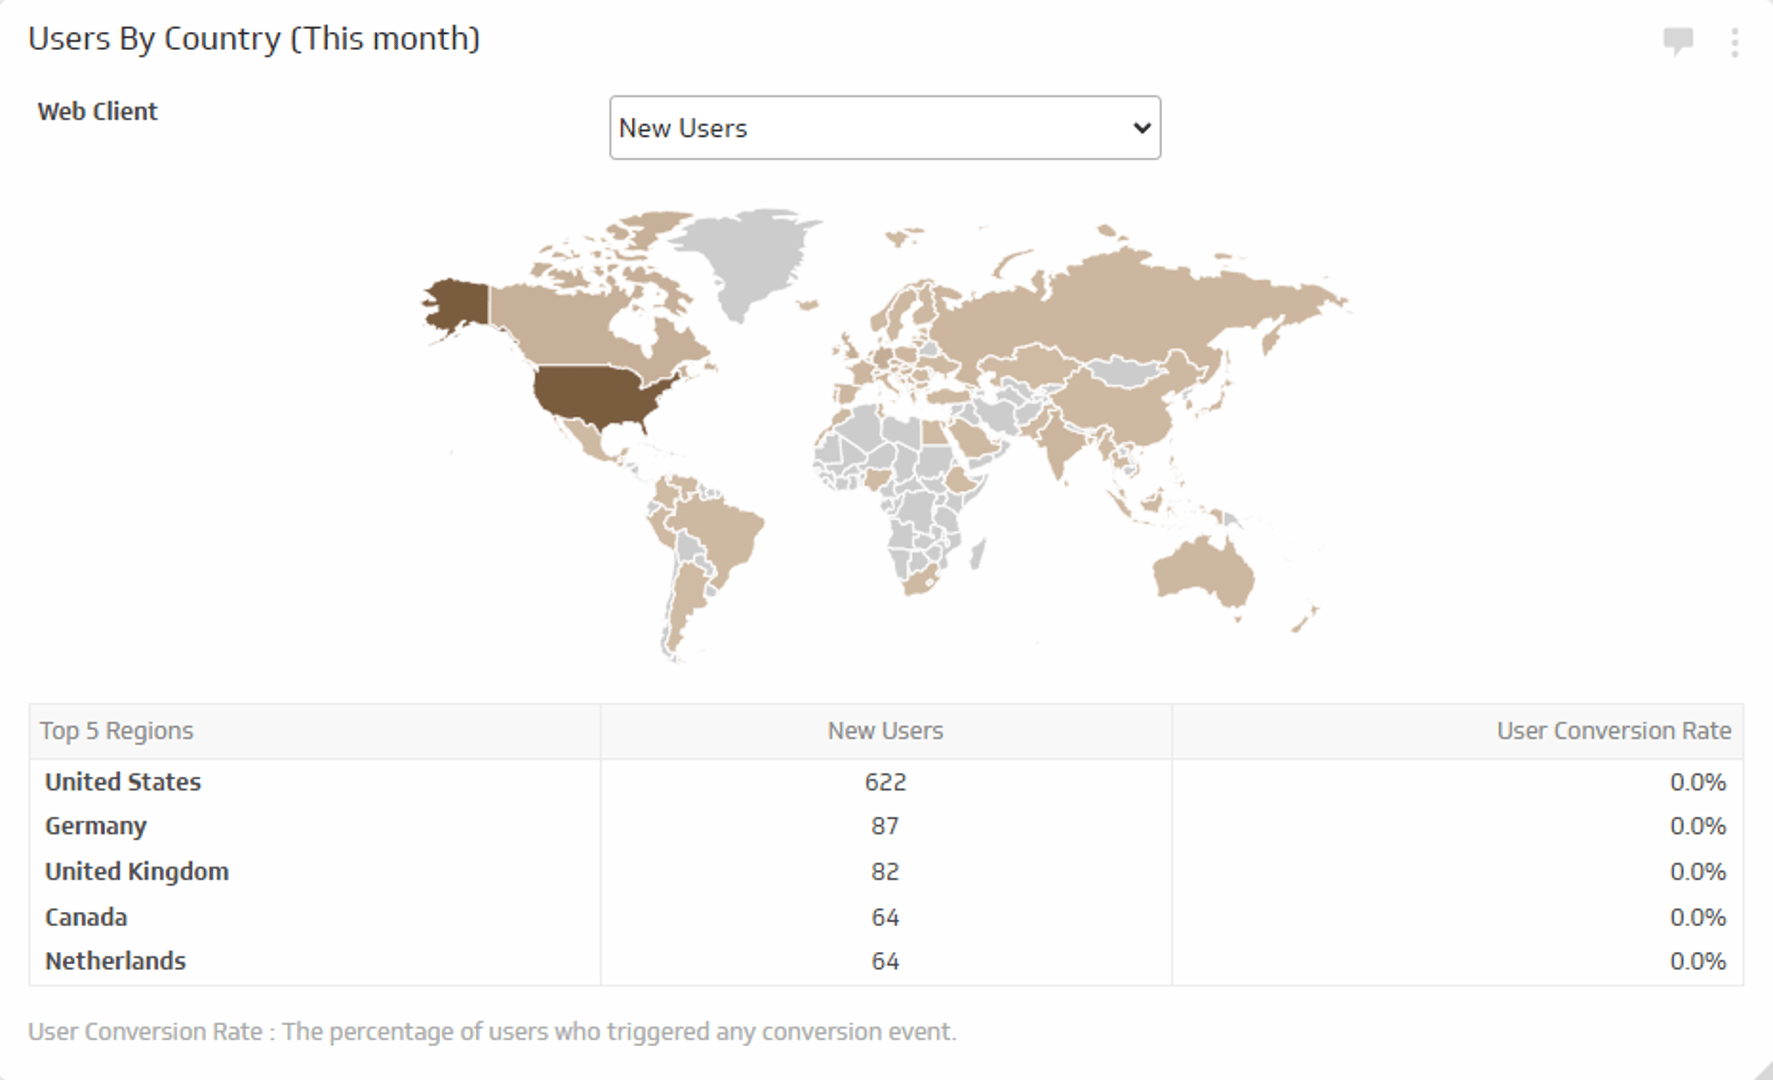
Users by Country - This Month
Track the number of new users and total users and their conversion rate for this month.
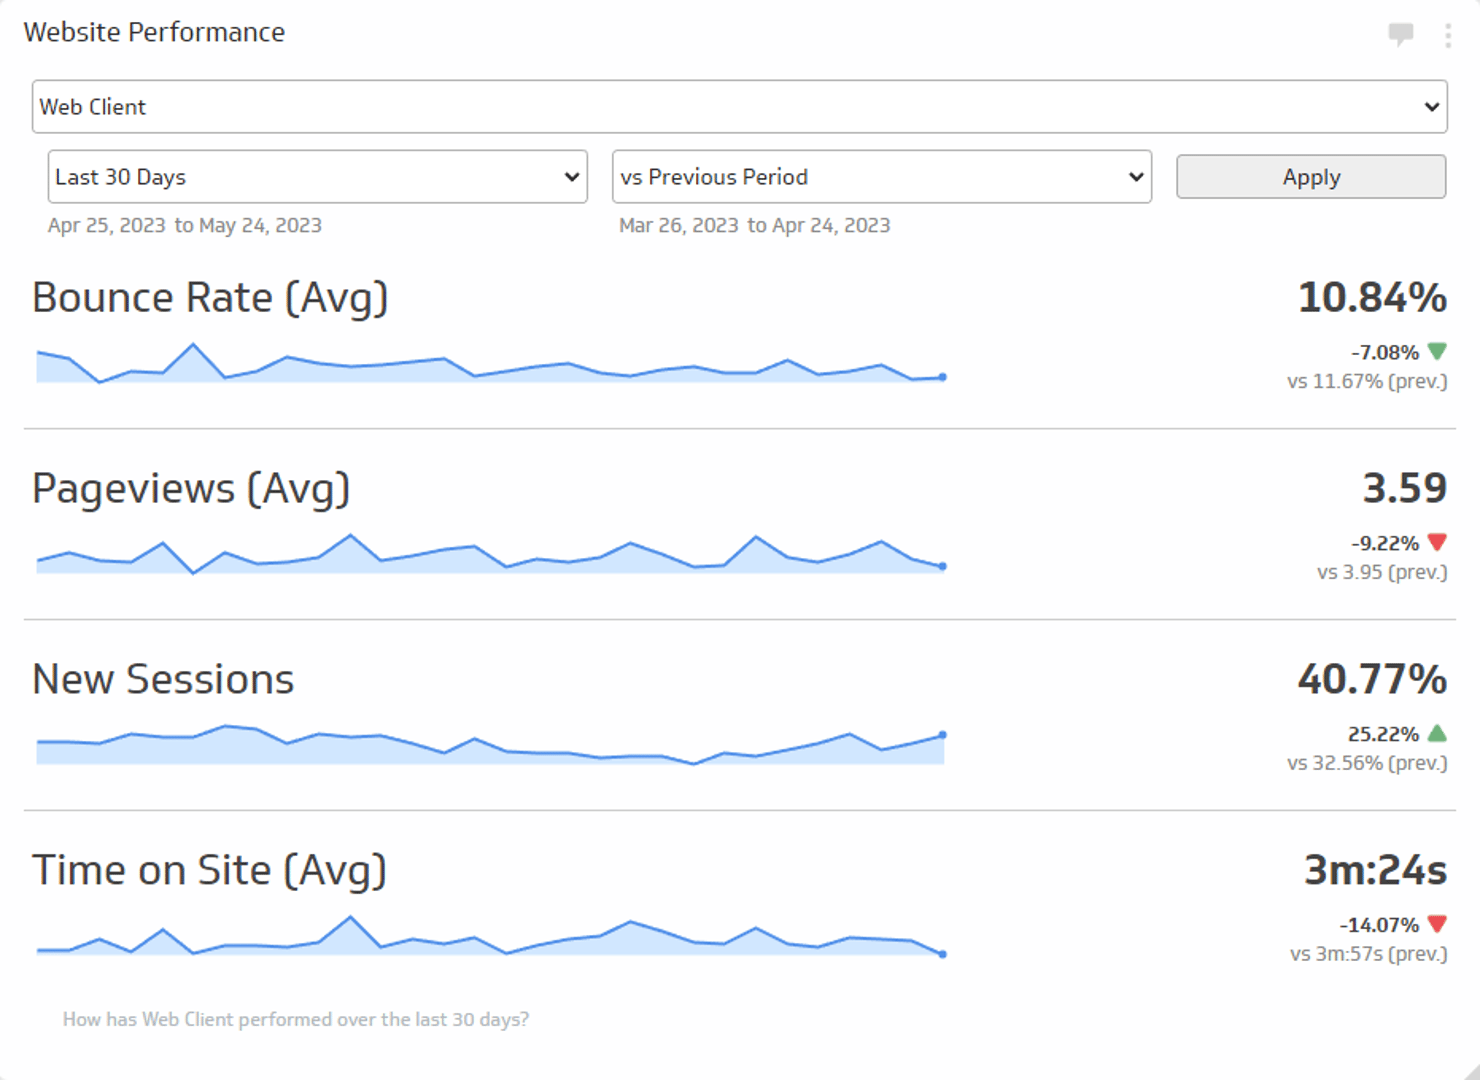
Website Performance
Track the average Bounce Rate, average Pageviews, new Sessions, and average Time on Site during the time period of your choice.
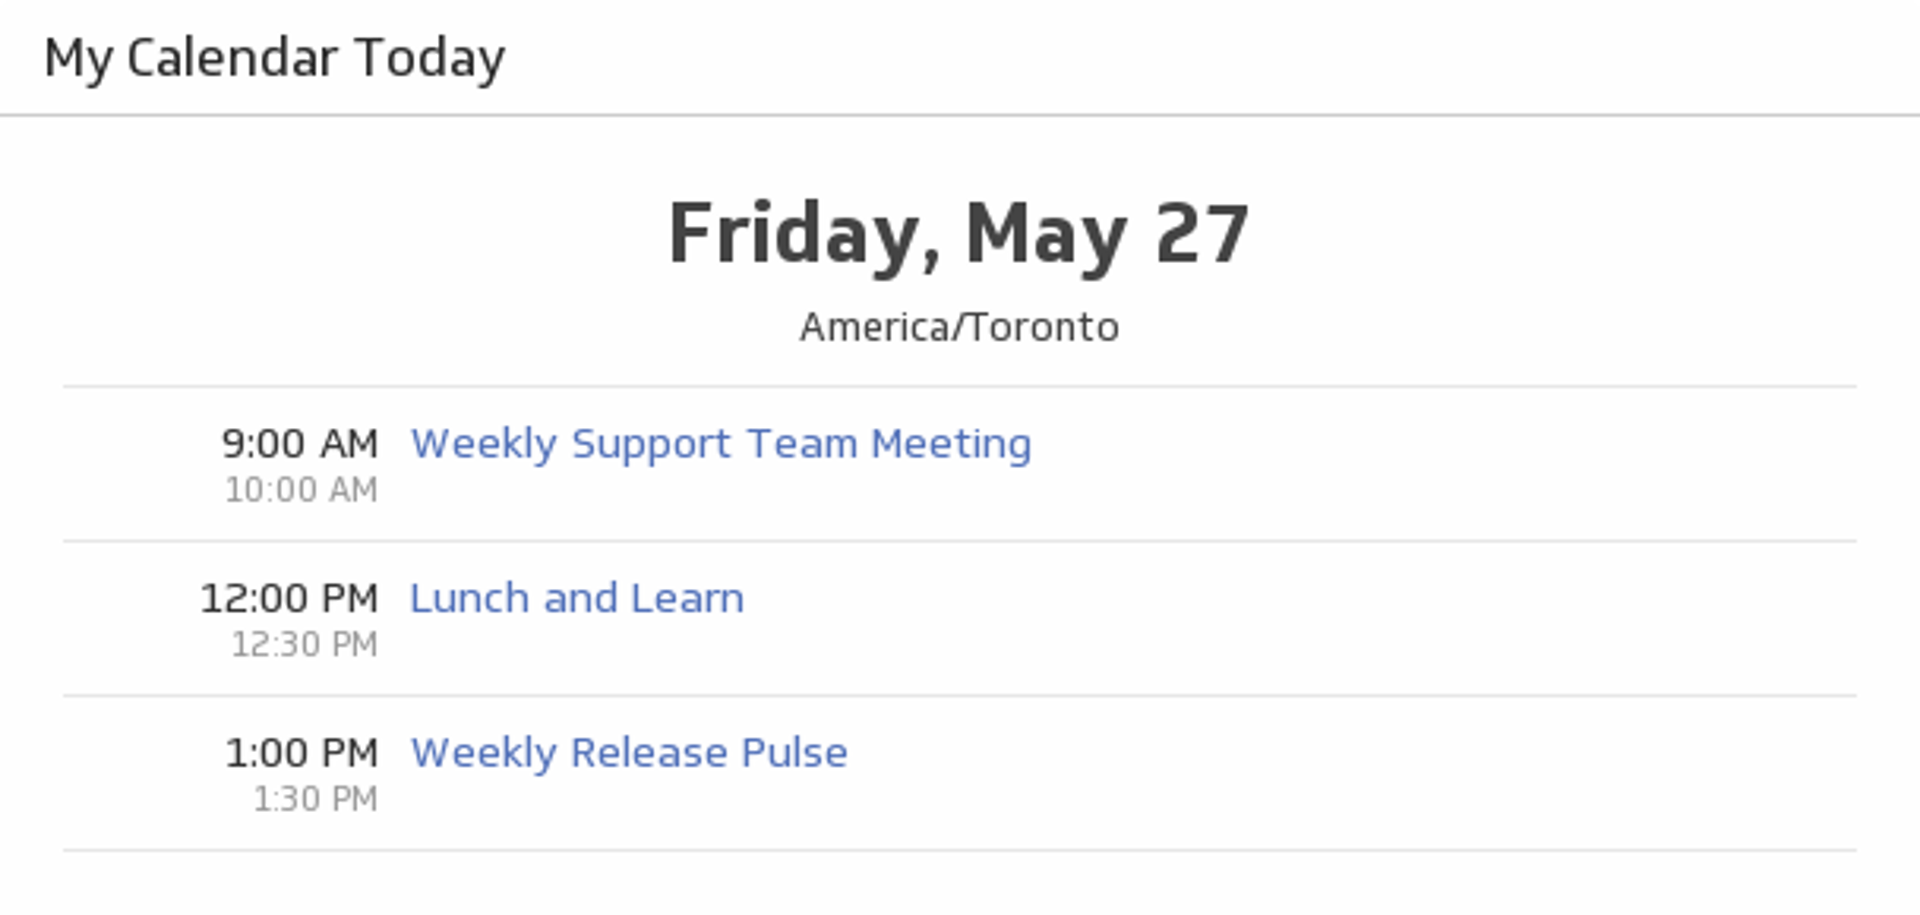
My Calendar Today
See what Google Calendar events you have today and never miss a meeting.
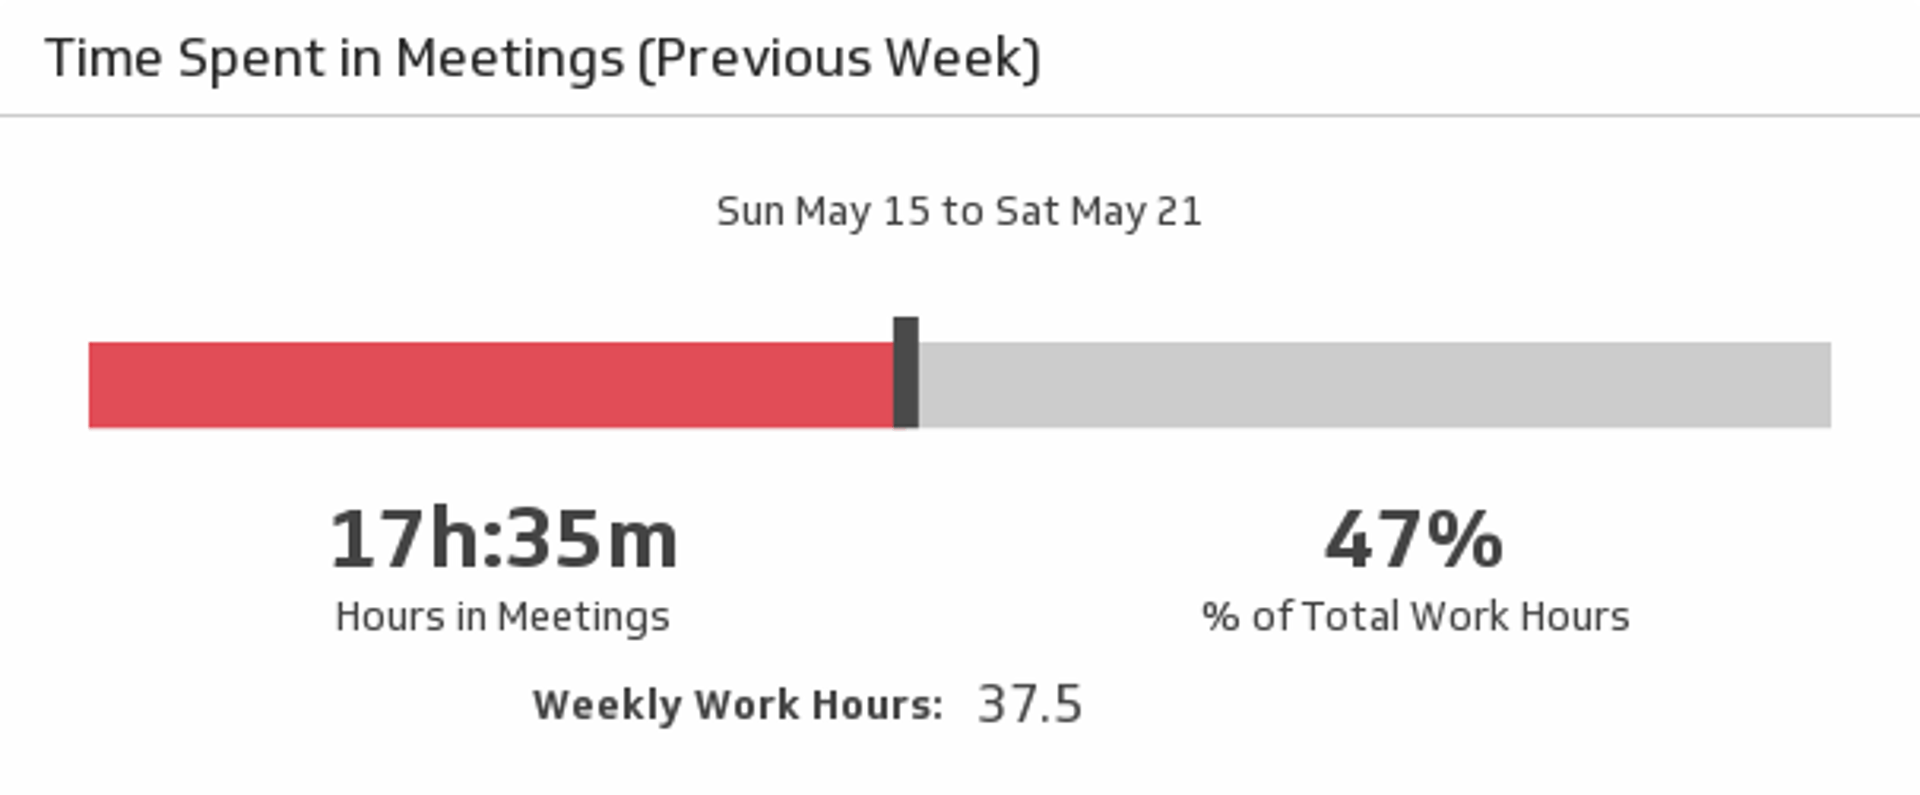
Time Spent in Meetings (Previous Week)
Meetings can take up a lot of your time. Track just how much of your week was spent in meetings, in both hours and percentage of total work hours, with this Google Calendar metric.
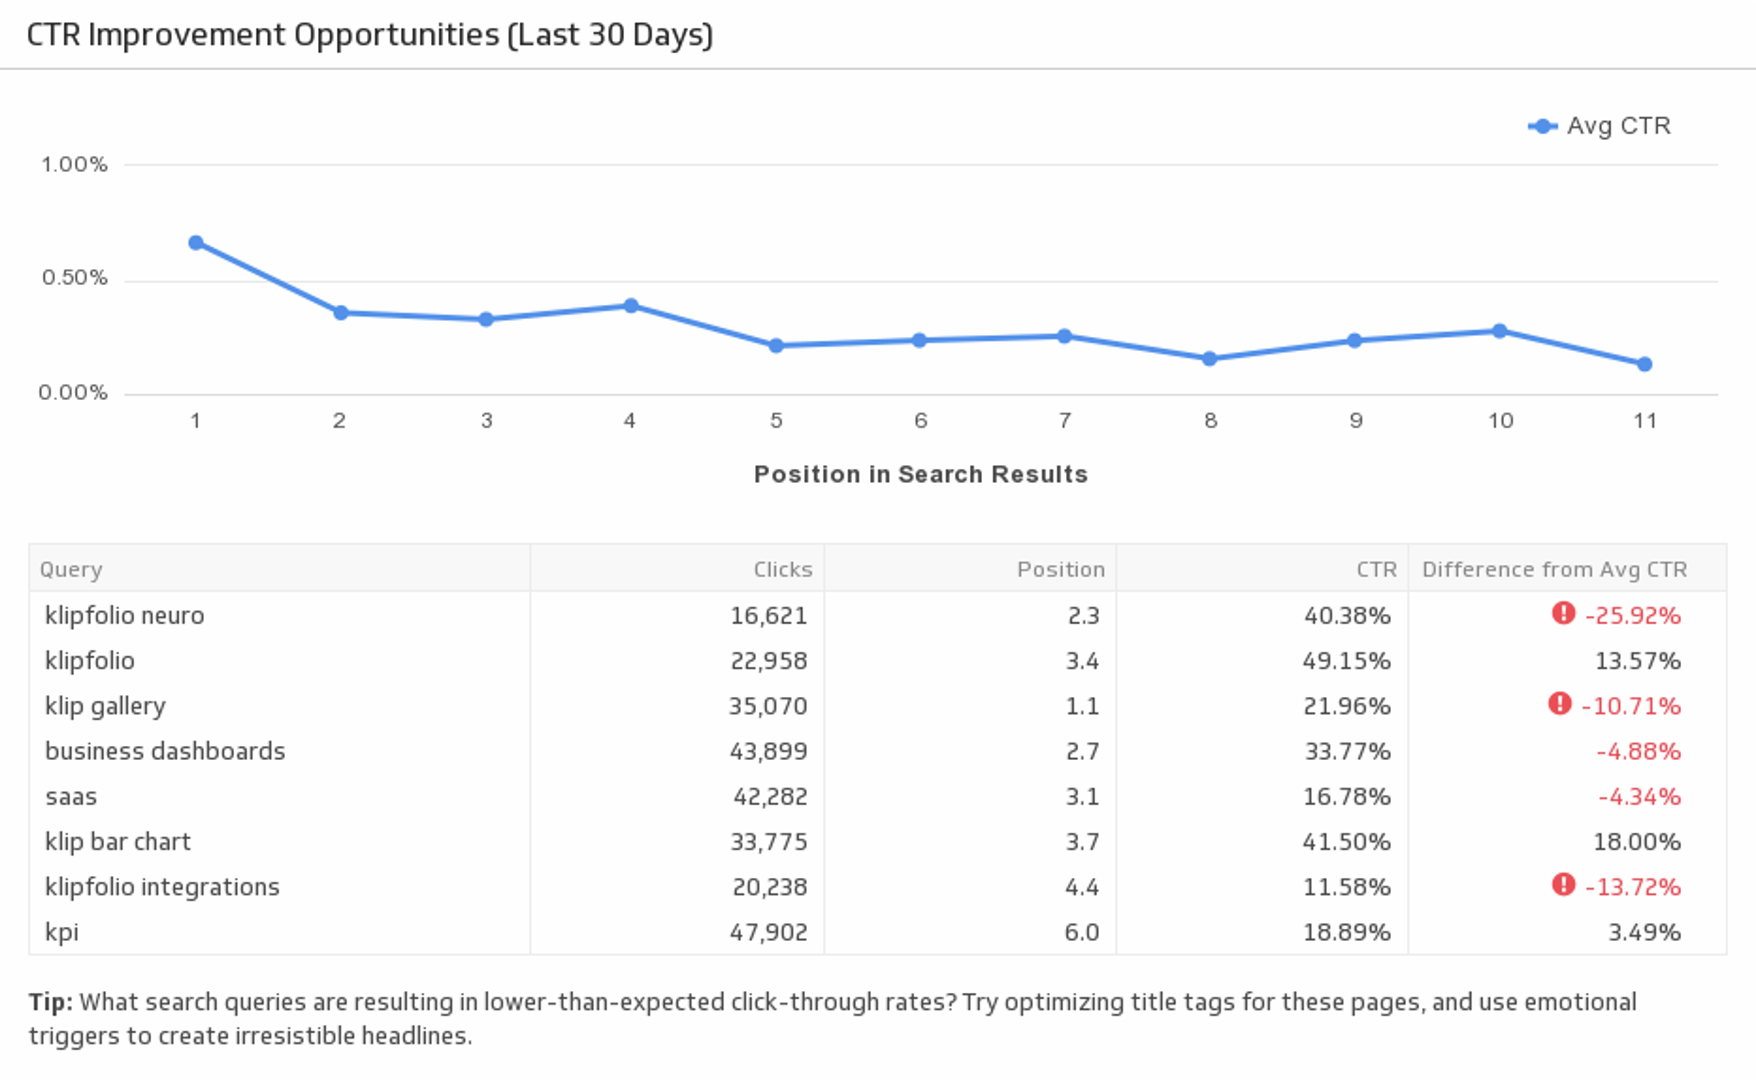
CTR Improvement Opportunities (Last 30 Days)
Improve your click-through rate by evaluating your organic keyword performance. This pre-built metric allows you to analyze different keyword rankings and shows you which areas to improve on.
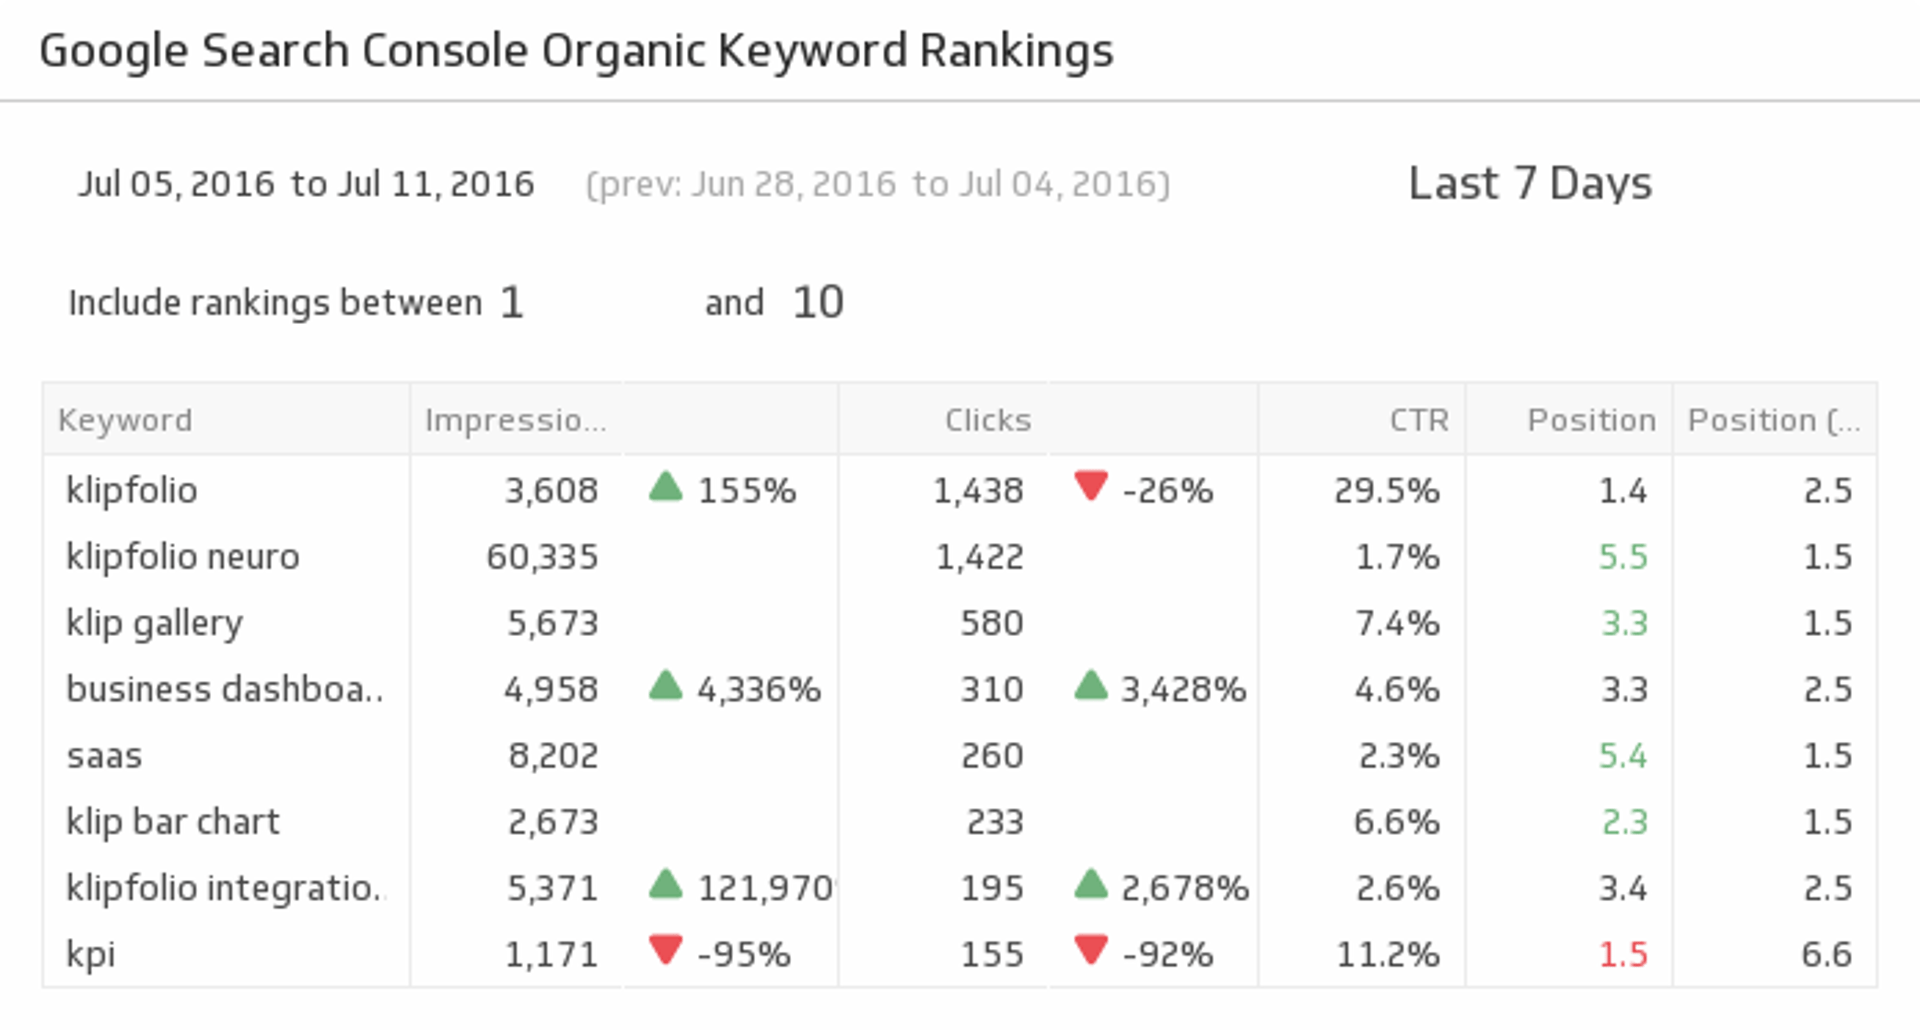
Organic Keyword Rankings
Are your SEO efforts paying off? This pre-built metric gives you the organic keyword rankings data you need to evaluate your performance and make proper adjustments.
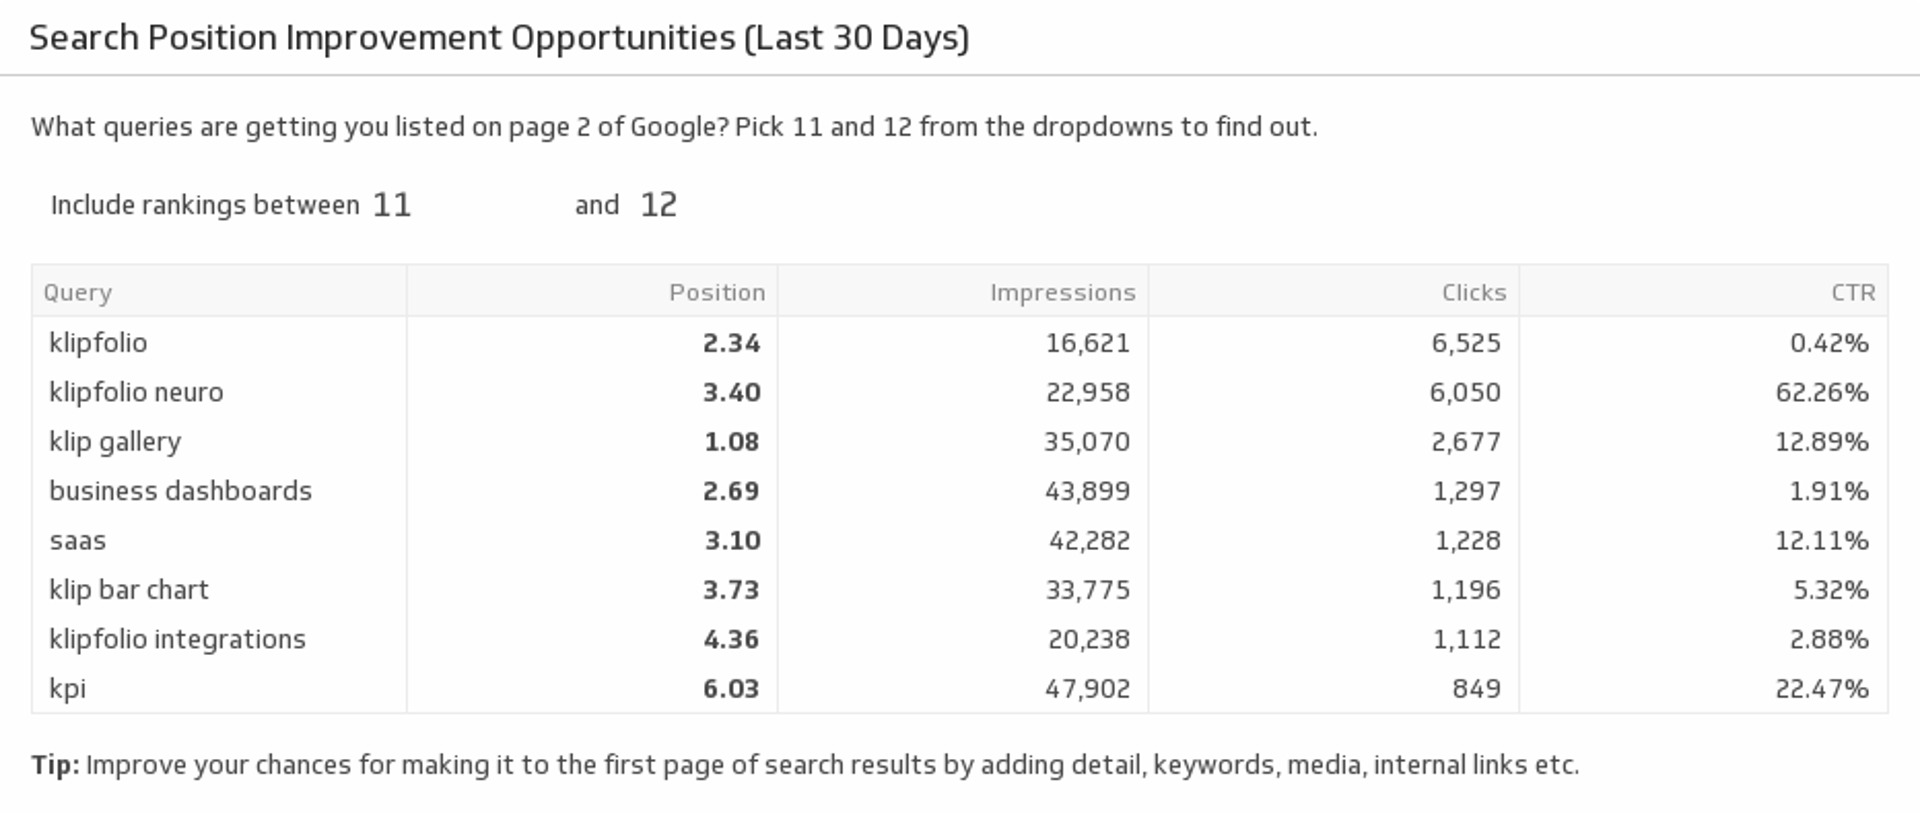
Search Position Improvement Opportunities (Last 30 Days)
Which search queries can you improve on? Use this pre-built metric to find your page 2 query results. Use best practice SEO tactics to improve those rankings to page one of Google.
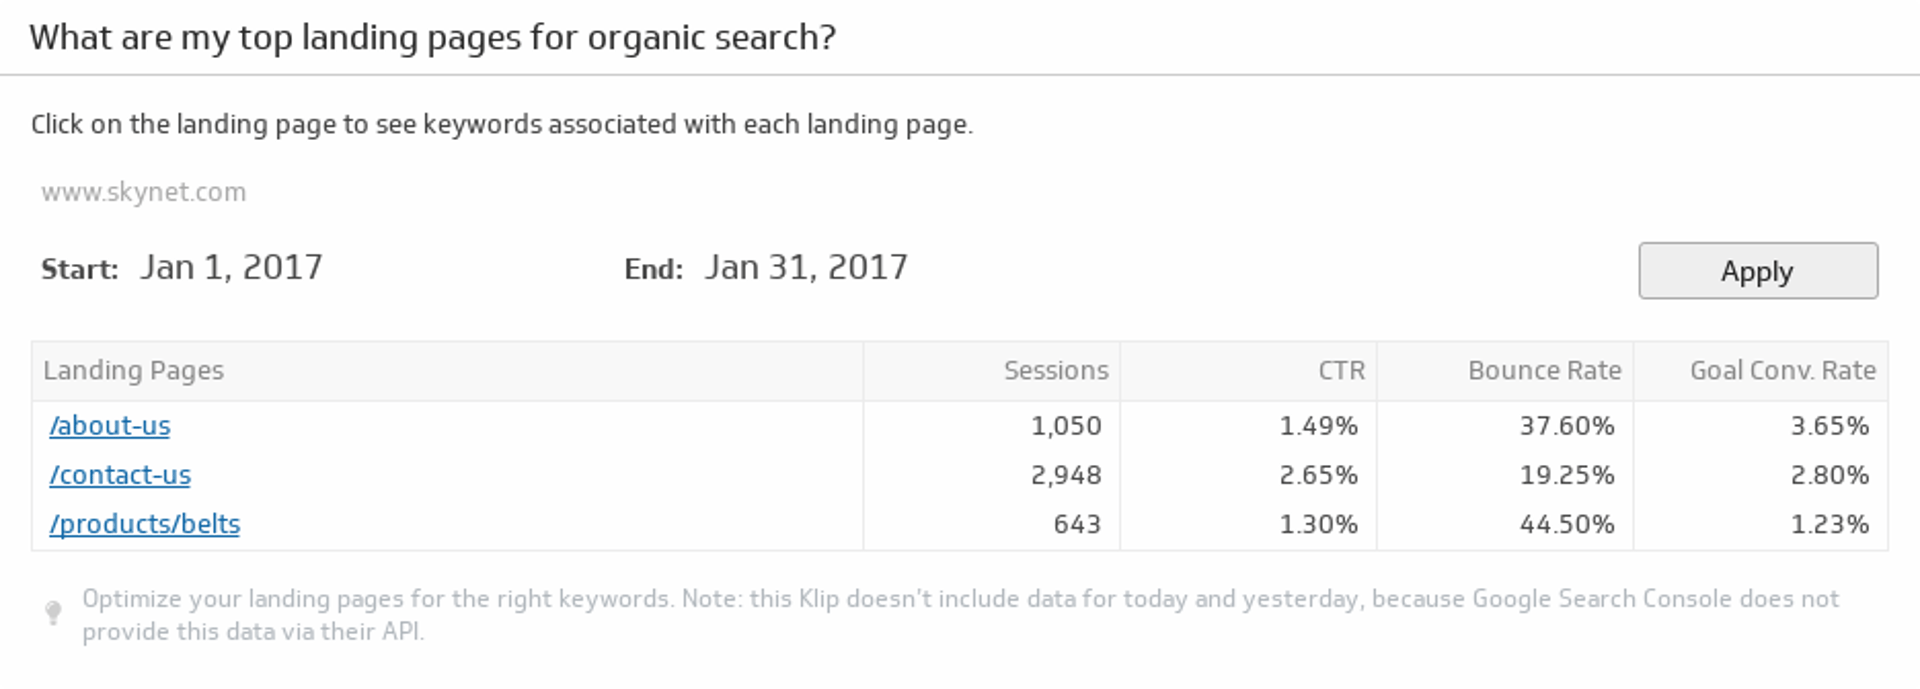
Top Landing Pages for Organic Search
Monitor your top ten landing pages based on organic search traffic.
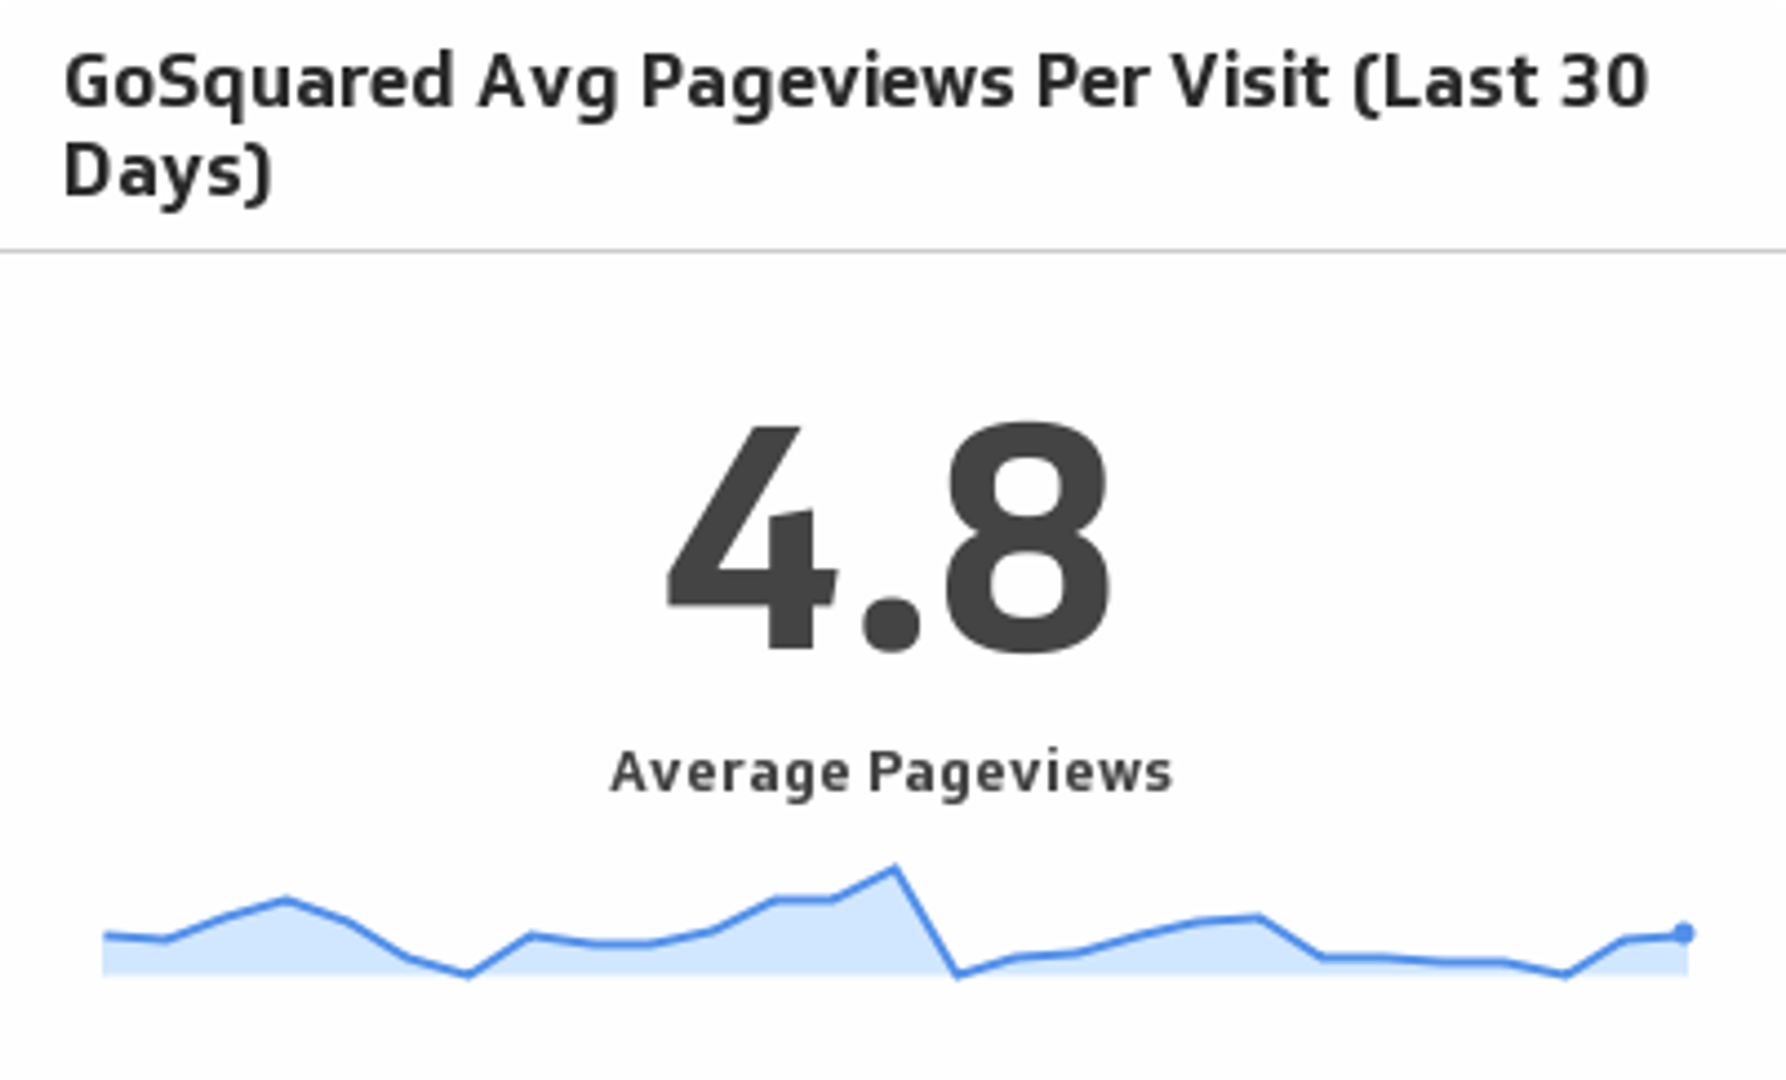
Avg Pageviews Per Visit (Last 30 Days)
See traffic trends unfold as you monitor average pageviews per visit over the past 30 days.
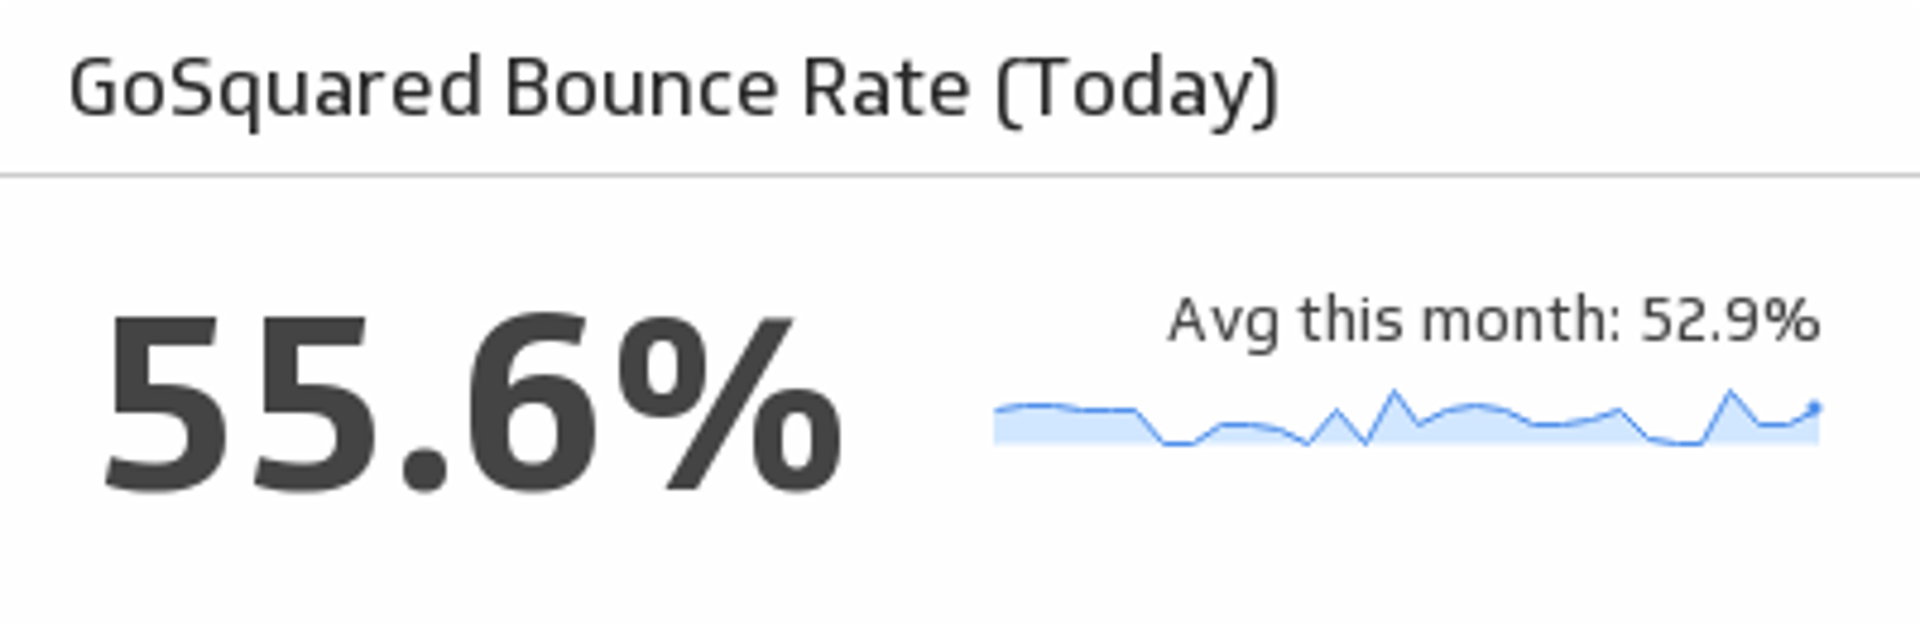
GoSquared Bounce Rate
Monitor your website’s bounce rate for the last 30 days.
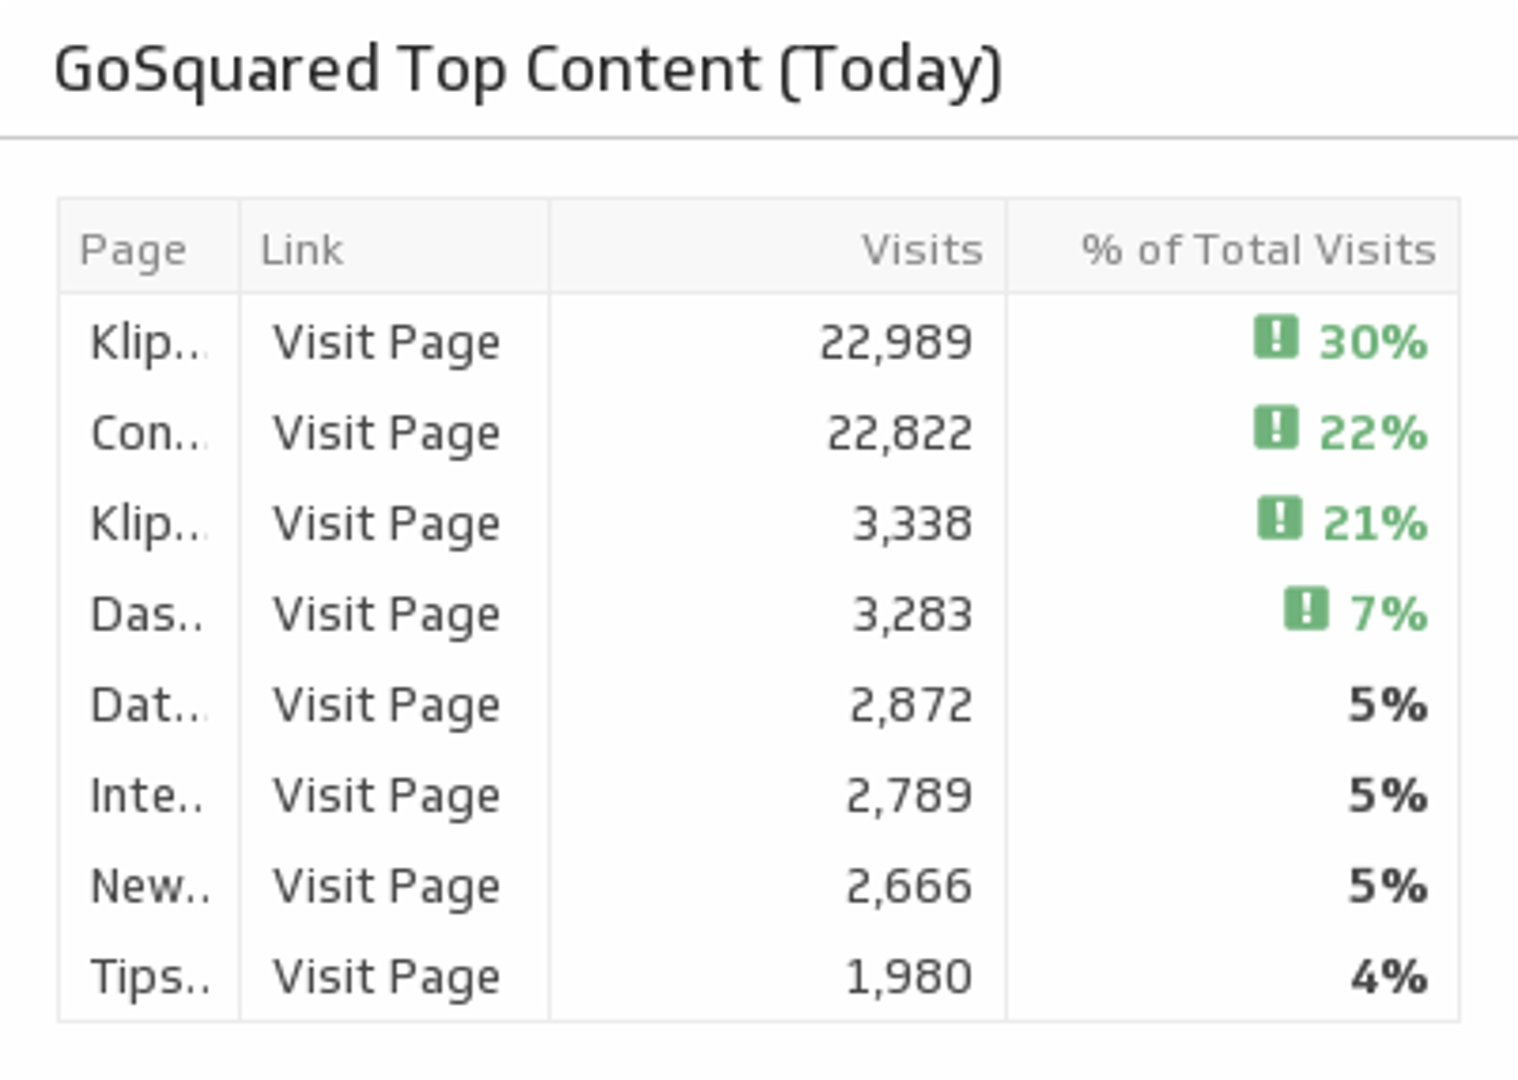
Top Content Today
Understand which website pages generated the most traffic in the last 30 days.
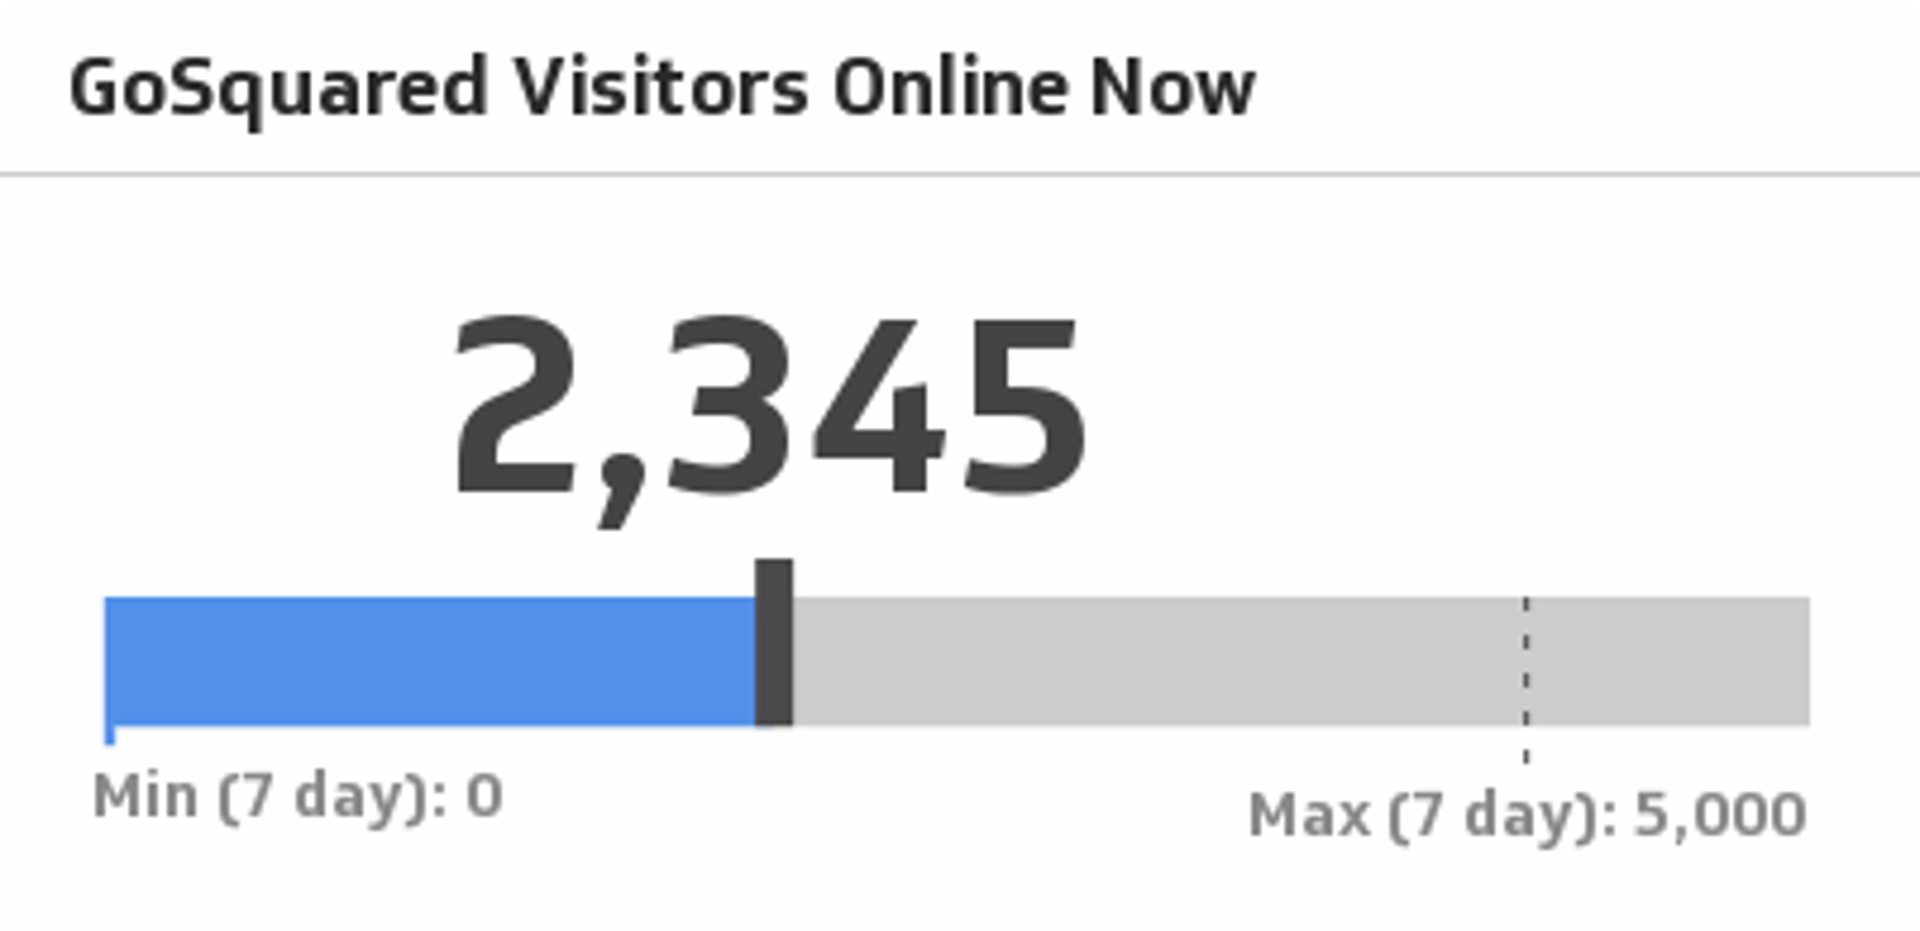
Visitors Online Now
Monitor your website's current number of online visitors.
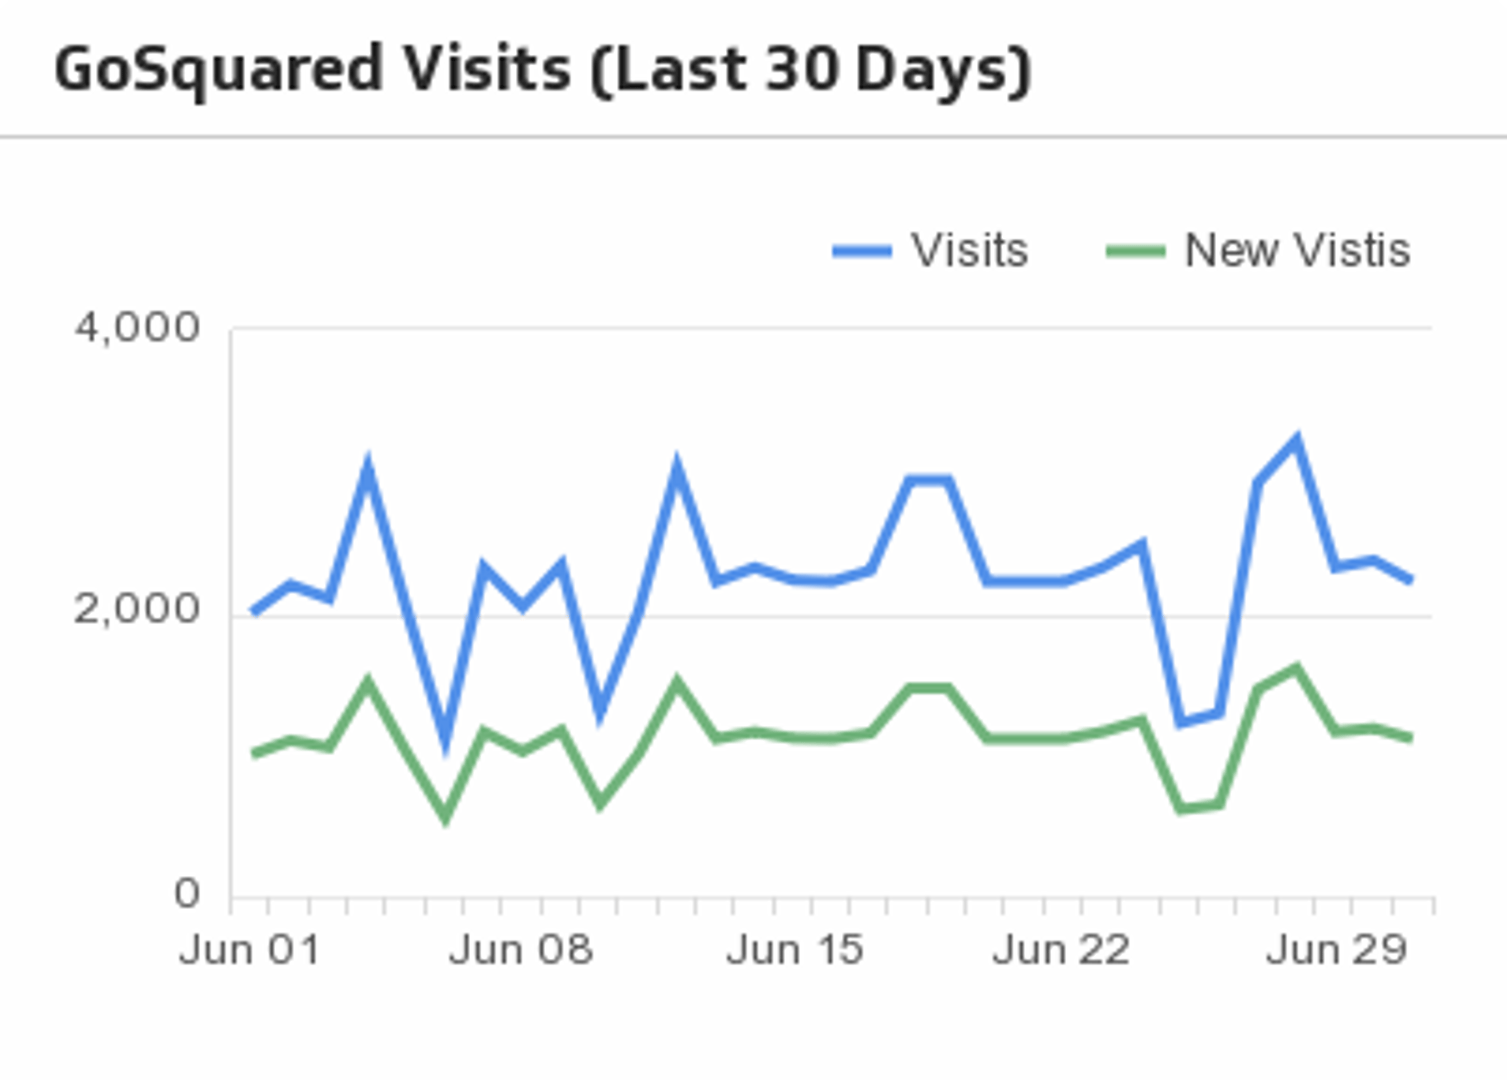
Visits (Last 30 Days)
Compare visits with new visits over the past 30 days.
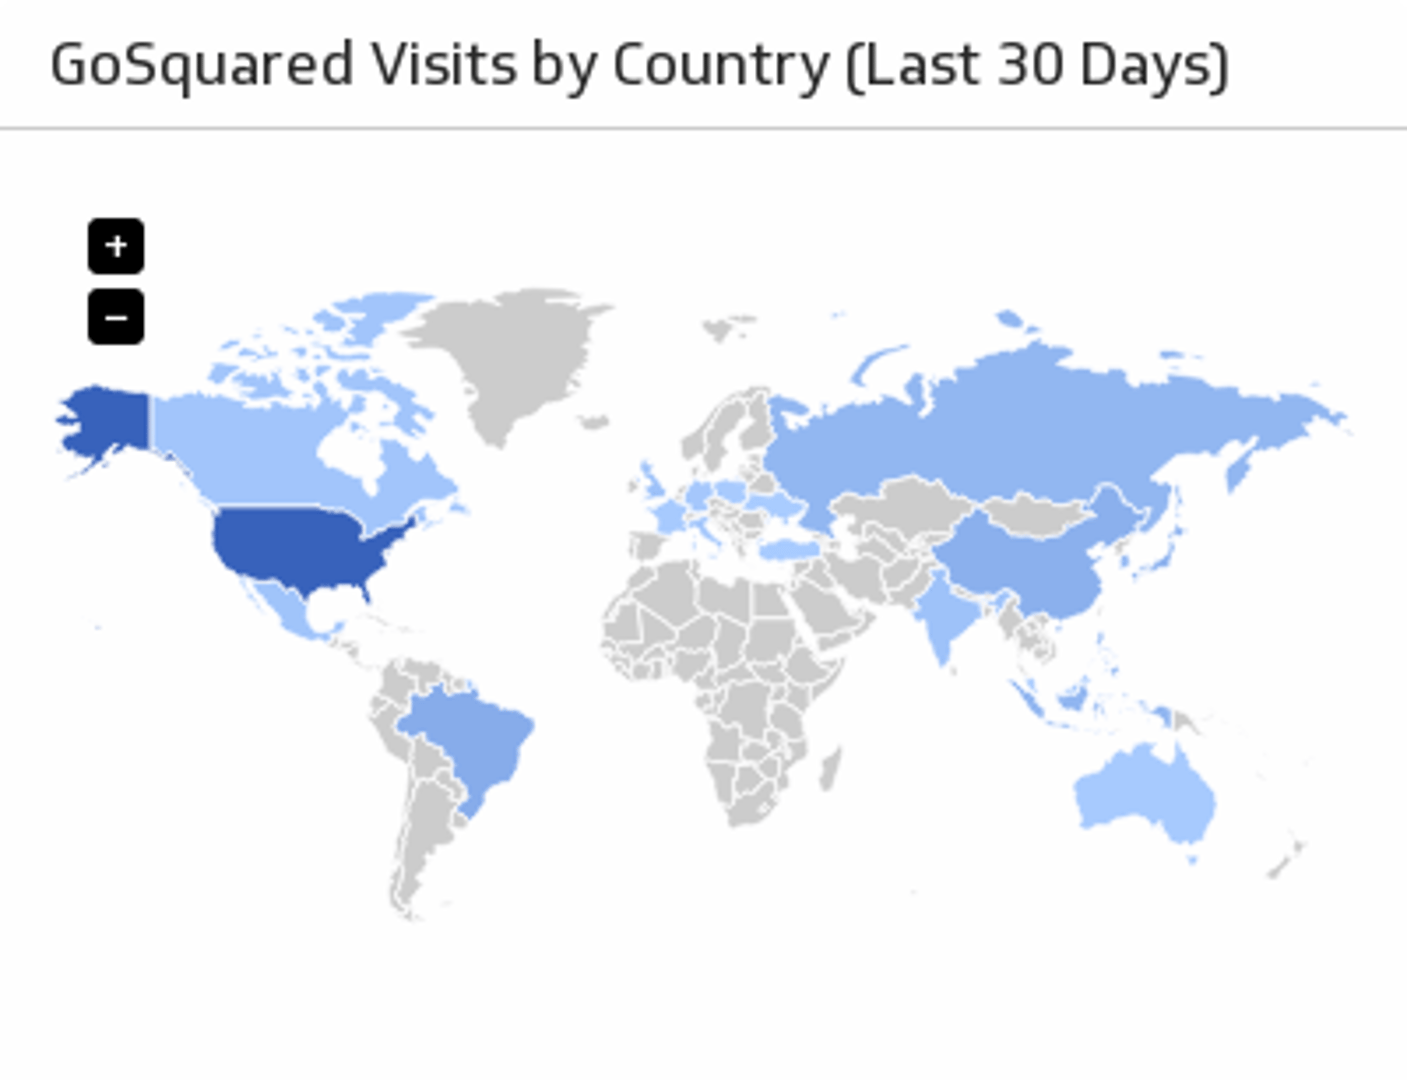
Visits by Country
Visualize visits to your website by country, for the last 30 days.
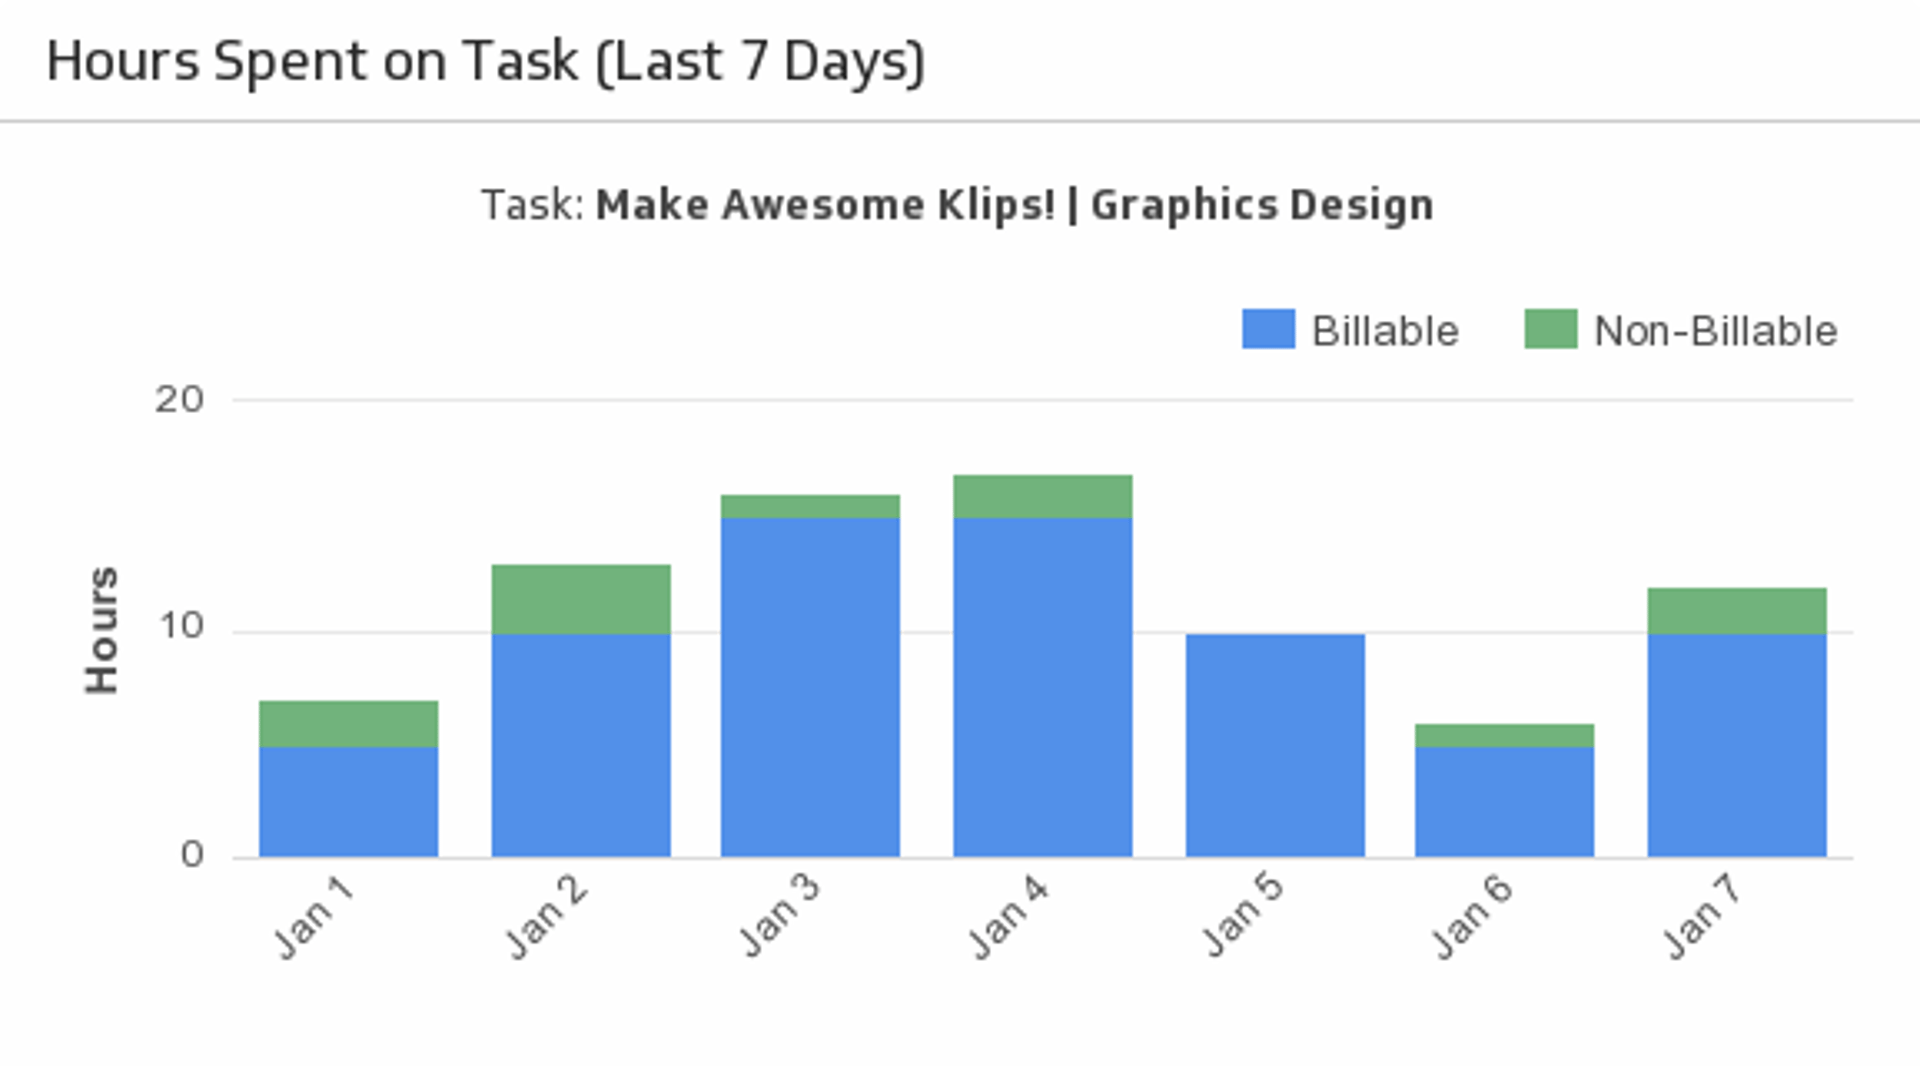
Hours Spent on Task (Last 7 Days)
Let this stacked bar chart make it easy to regularly check your project’s billable and non-billable hours.
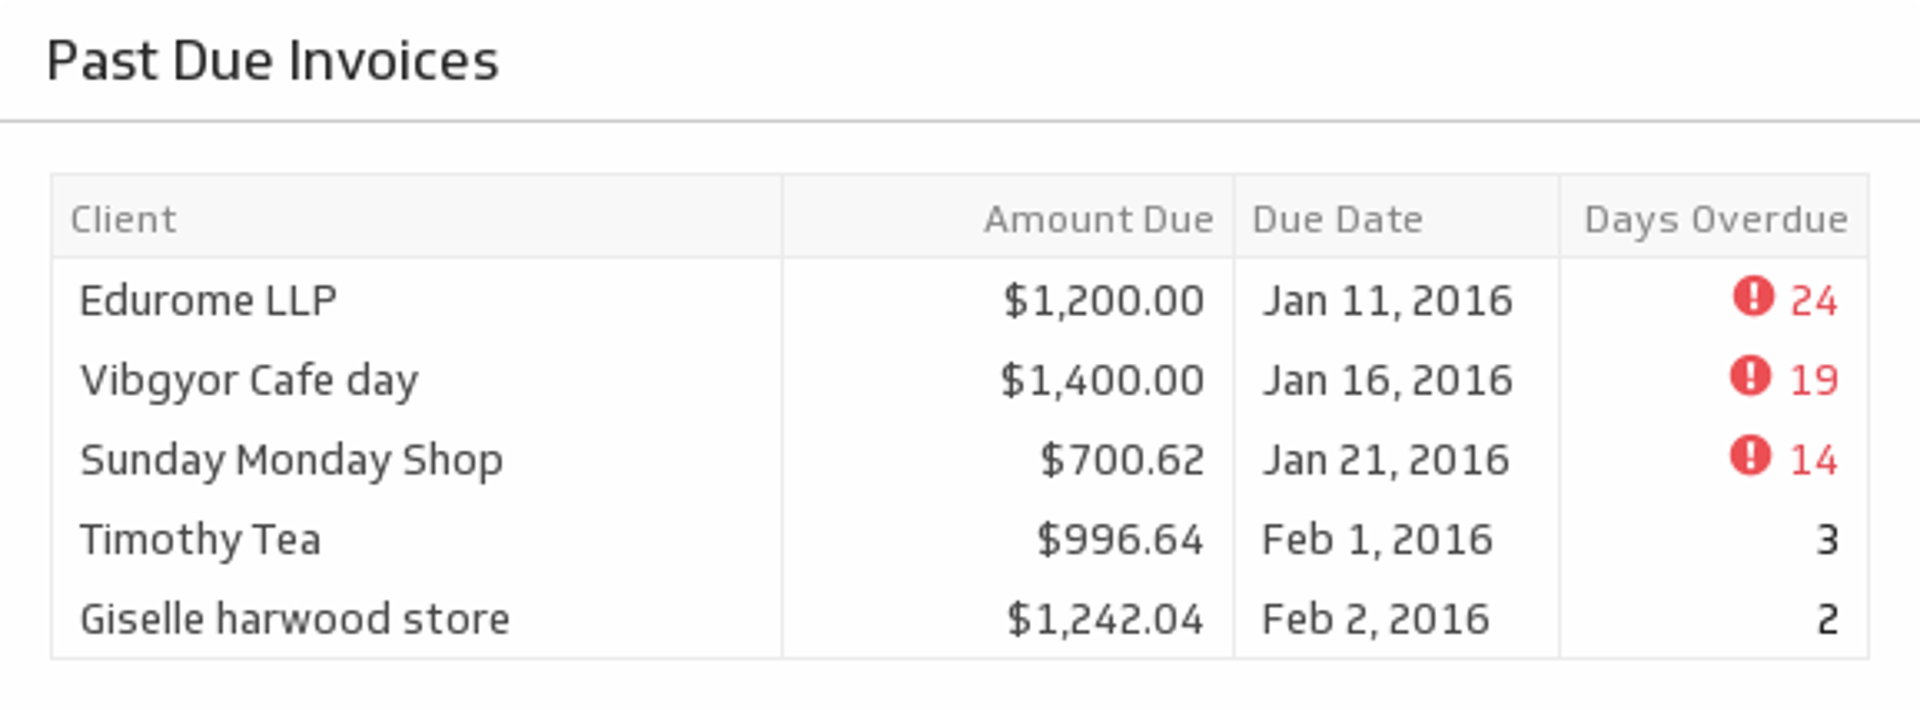
Past Due Invoices
Some clients take their time with payments. Use this table to know which clients need a little reminder.
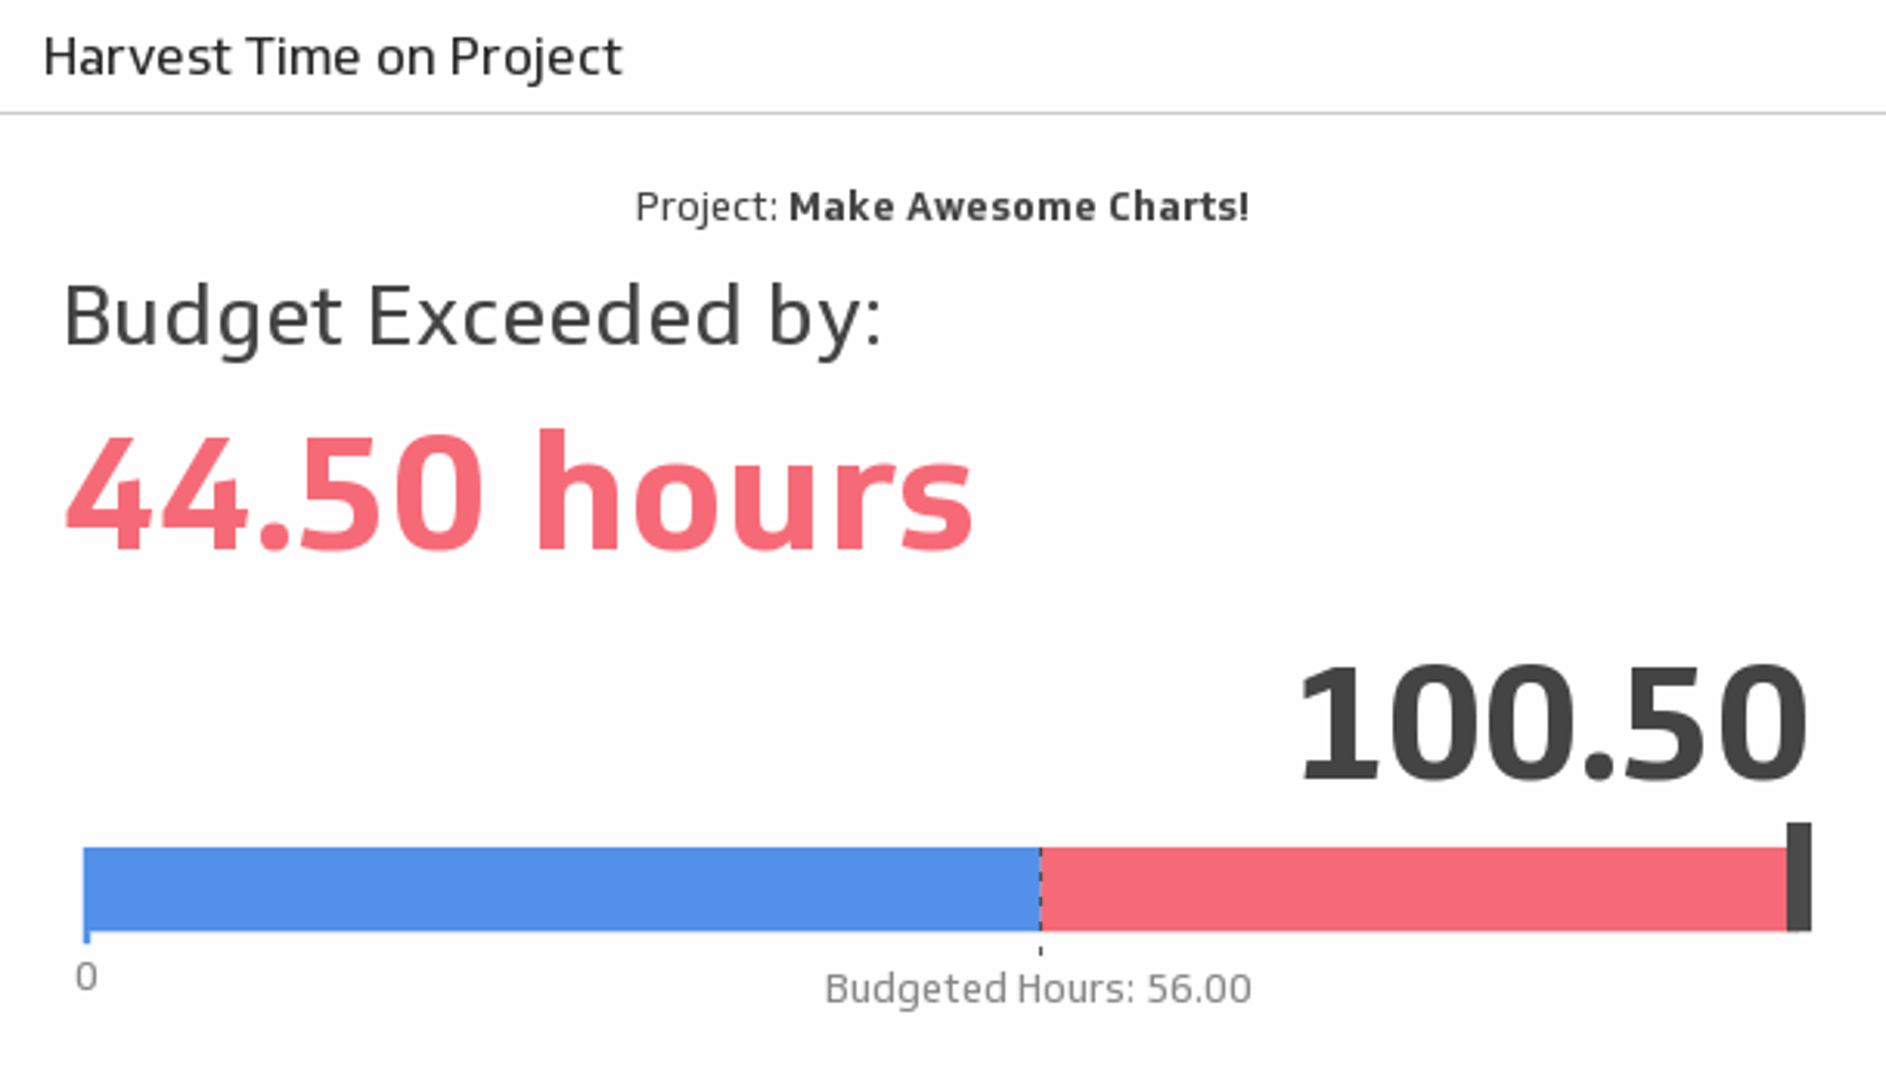
Time on Project
Whether your project is big or small, always keep track of your hours. Use this Klip to compare your budgeted hours to the total amount of time you’ve spent on the project.
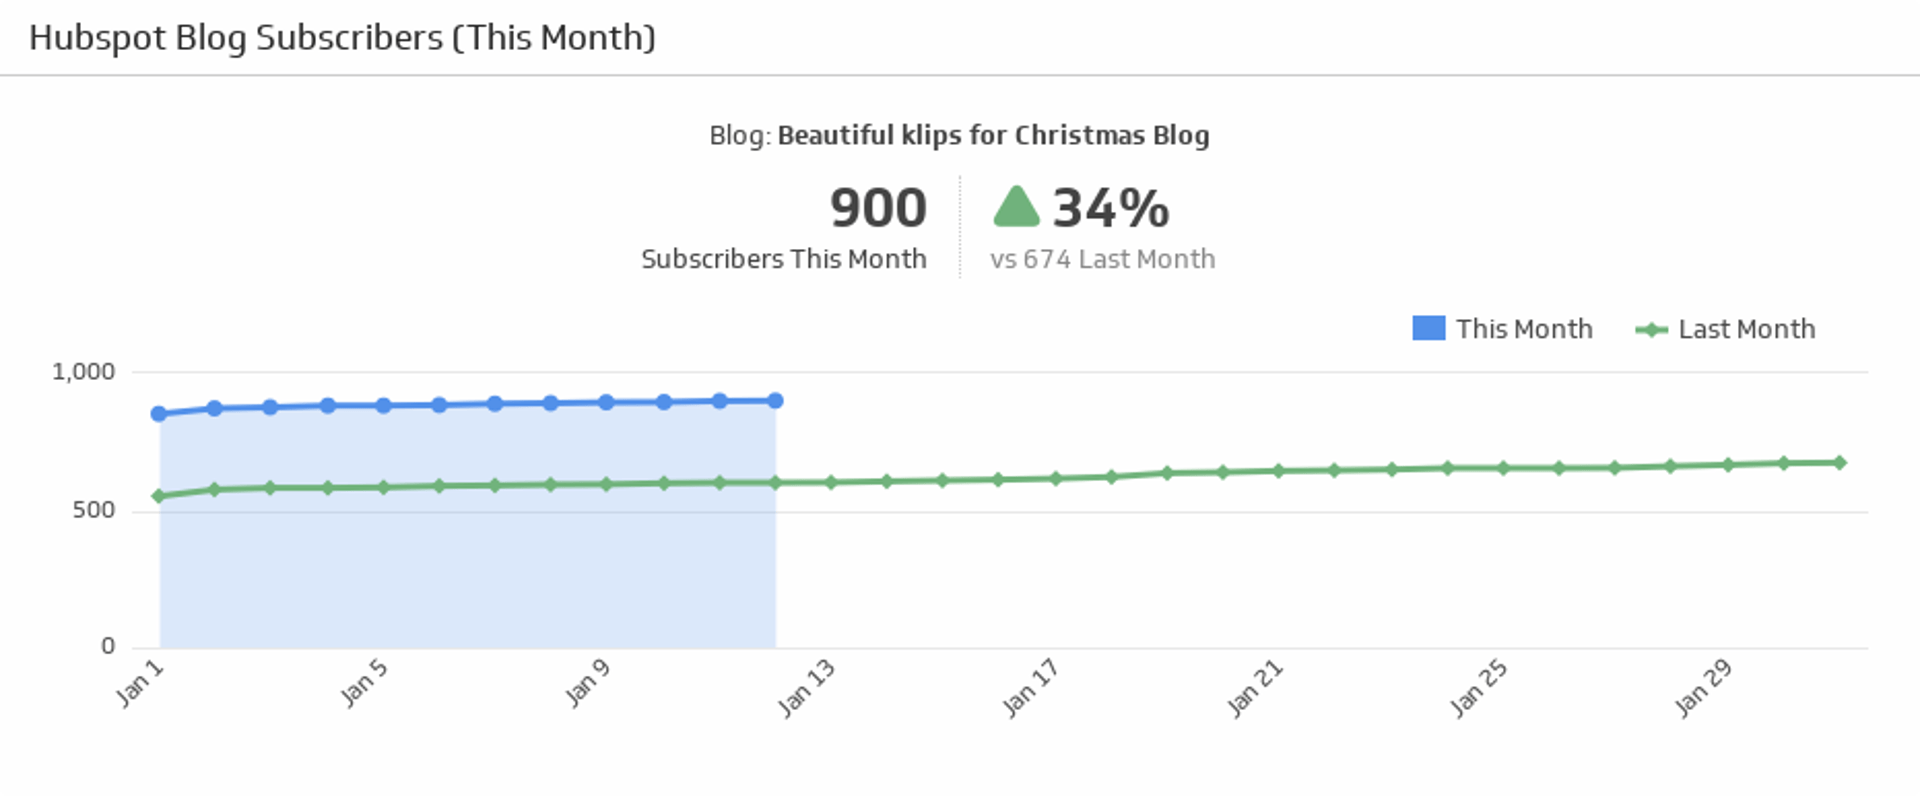
Blog Subscribers (This Month)
Track the number of subscribers for this month and compare it against the last month subscribers count.
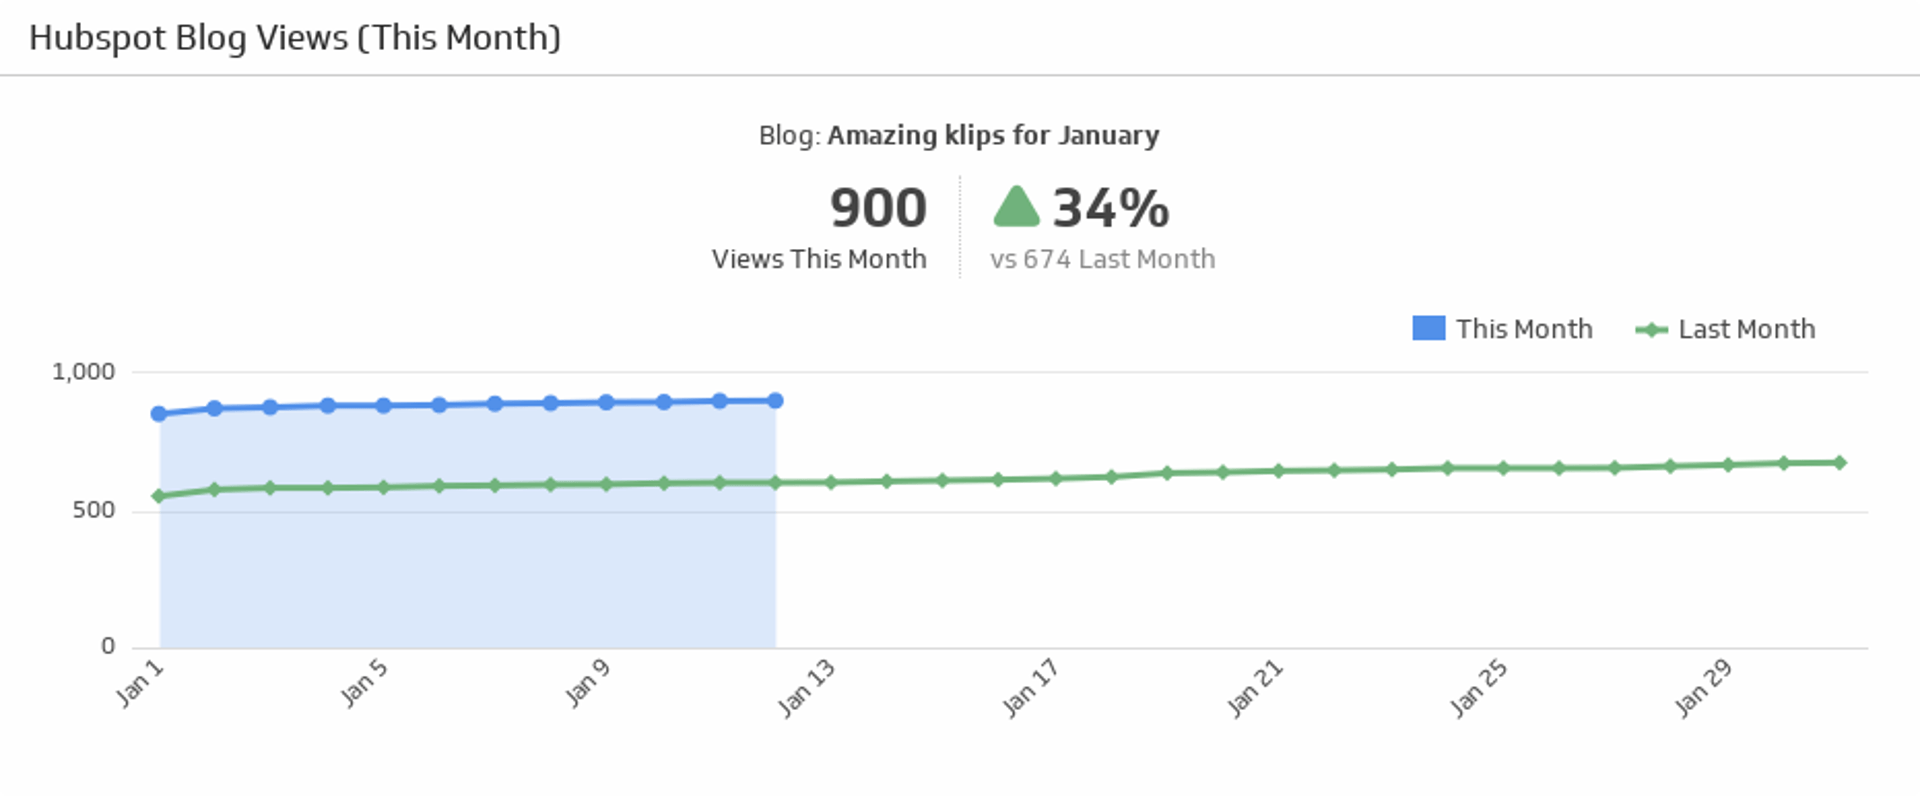
Blog Views (This Month)
Compare how many people looked at your blog this month and last month, and use the handy indicator to quickly see if the percentage of views is up or down.
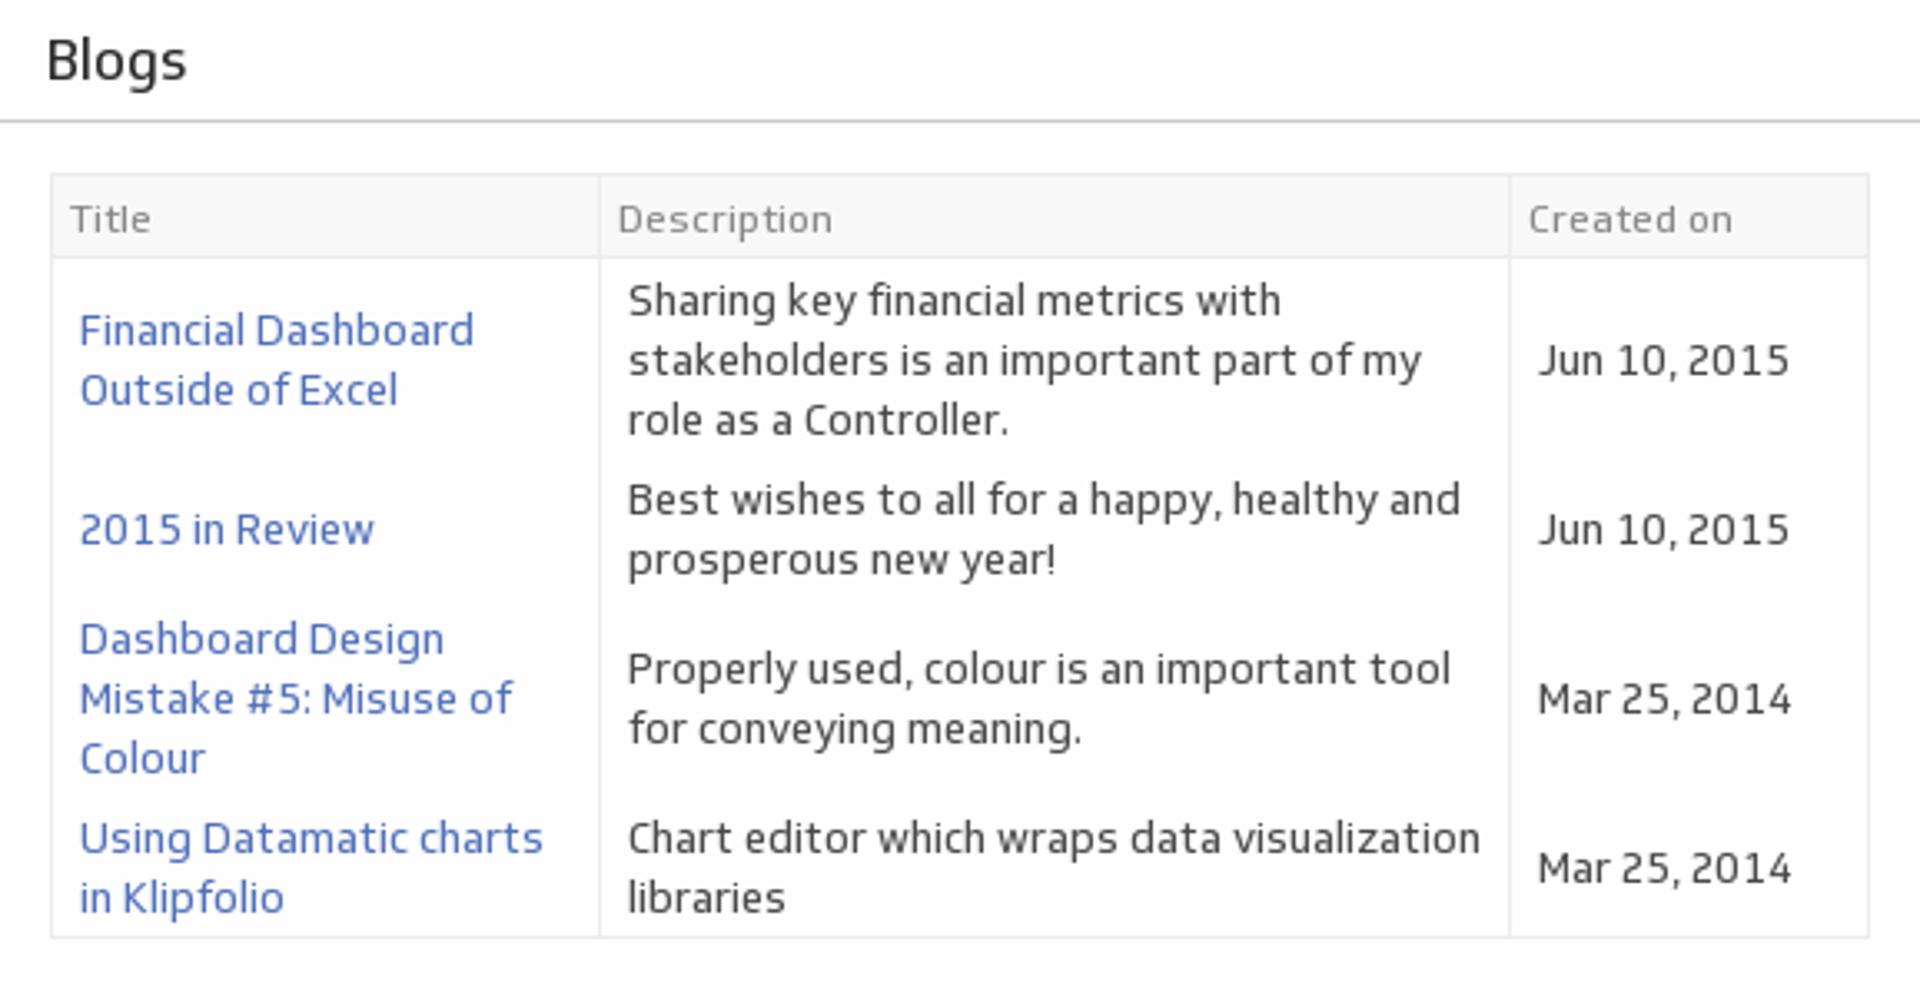
Blogs
Use this at-a-glance chart to track when your latest blog posts came out, and what their topic was.
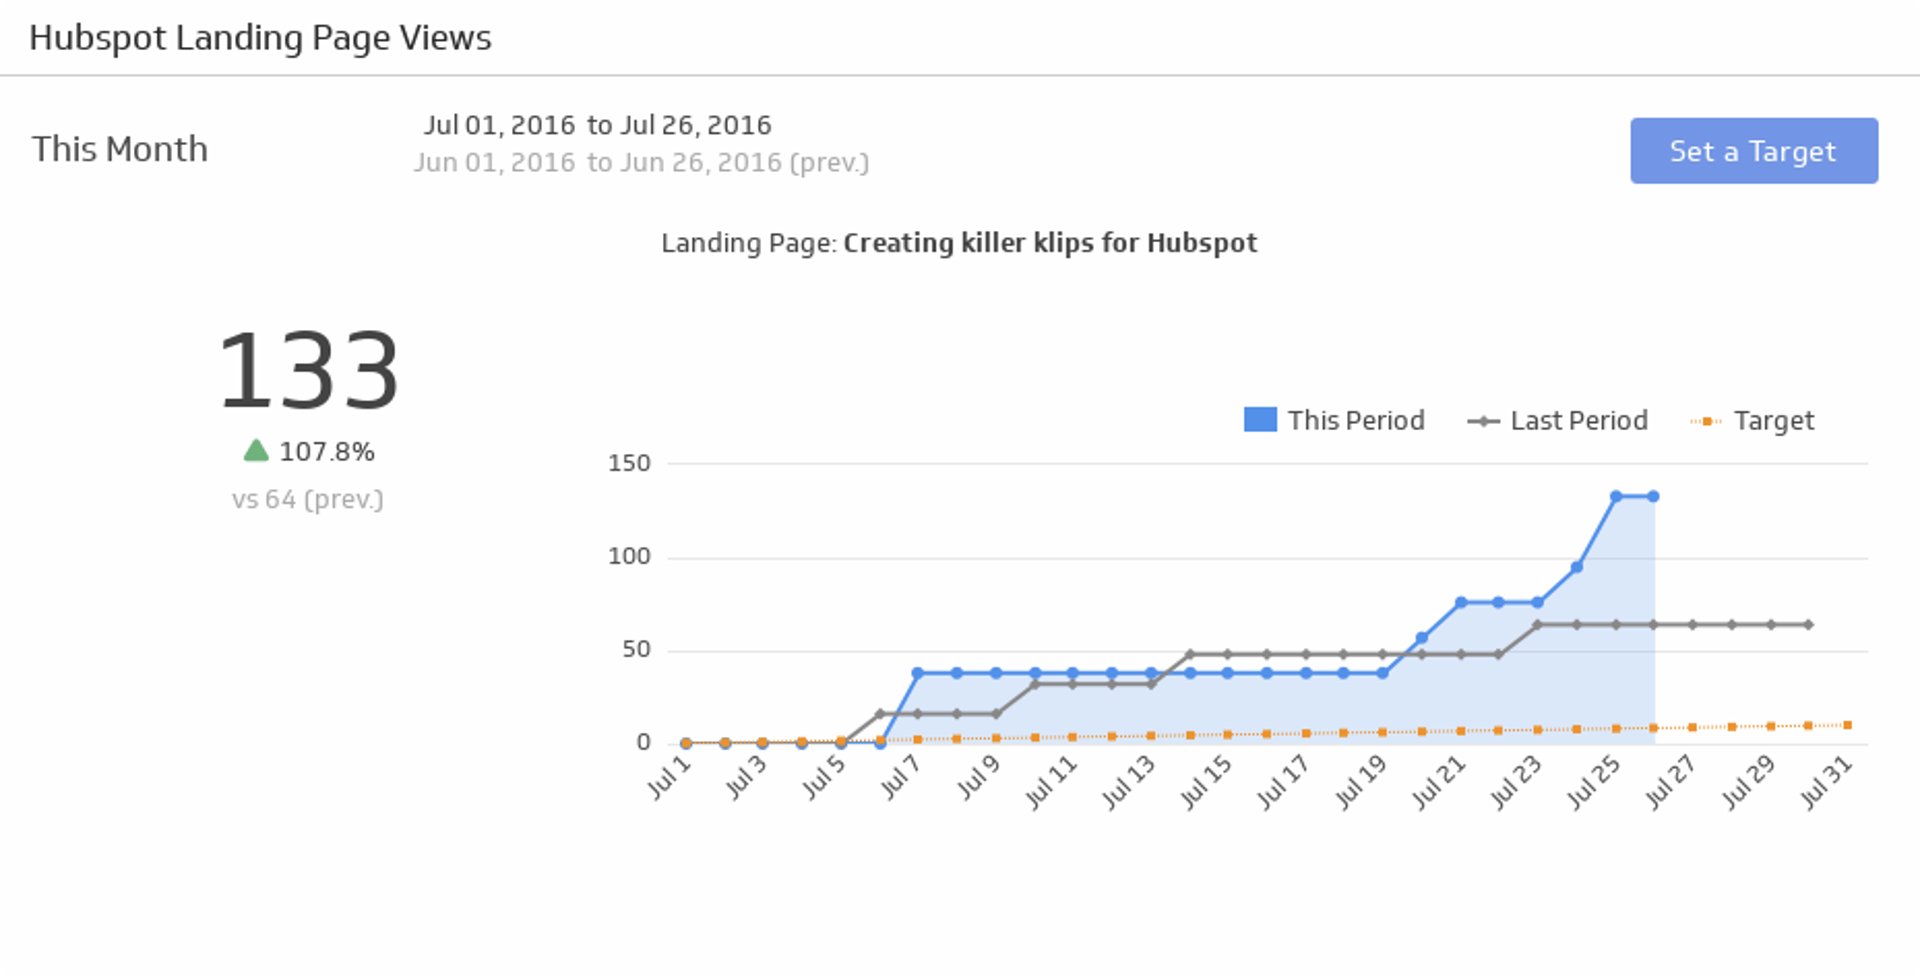
HubSpot Landing Page Views
Make sure your website is generating interest by tracking the number of views over the time period of your choice.
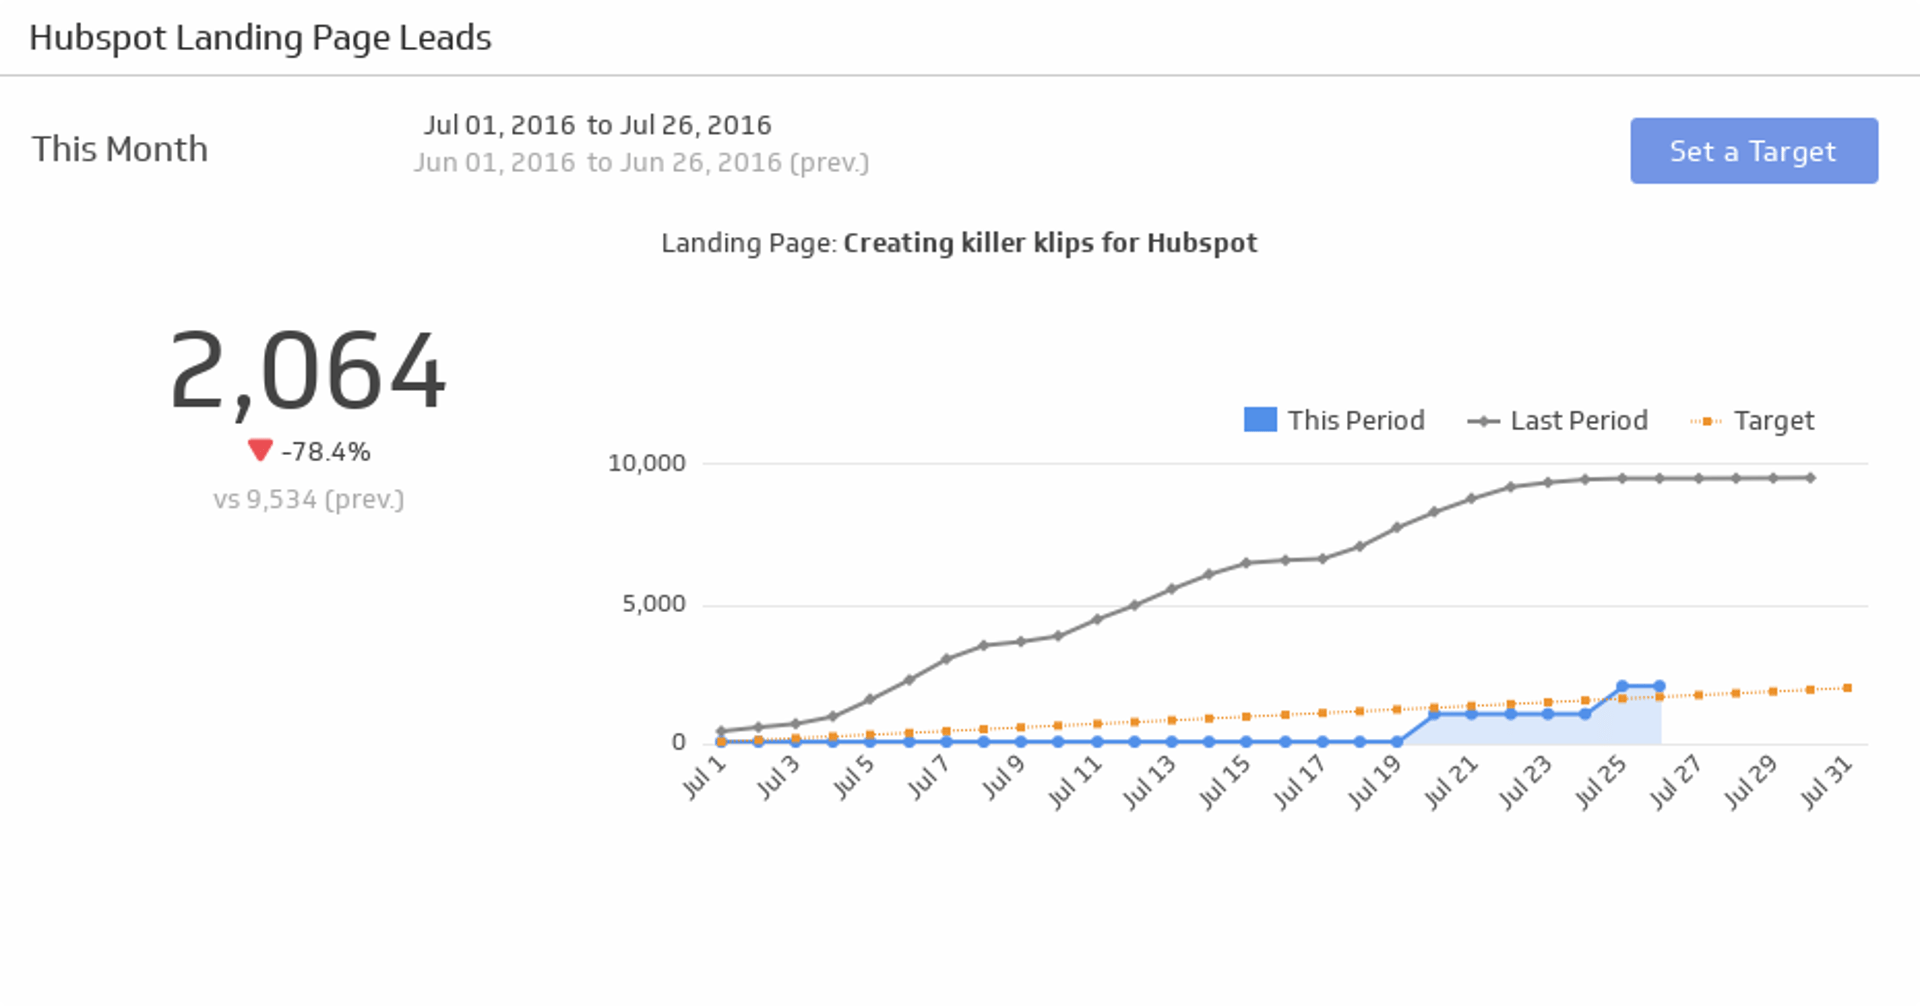
Landing Page Leads
With data as your secret weapon, turn your landing page in to a lead-generation powerhouse.
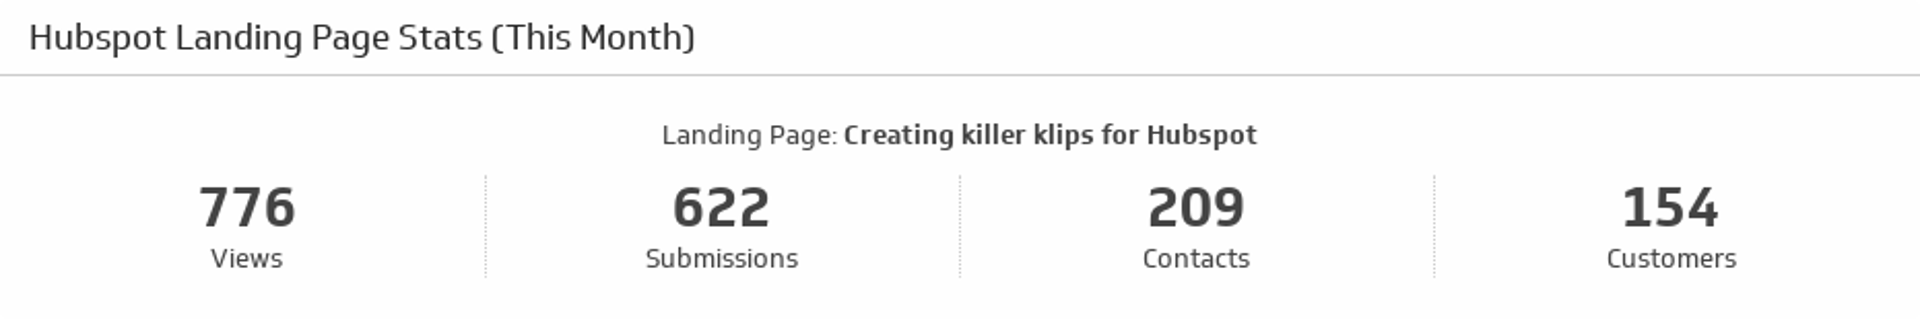
Landing Page Stats (This Month)
A quick and easy report on the status of a landing page, featuring a list of key landing page metrics for this month.
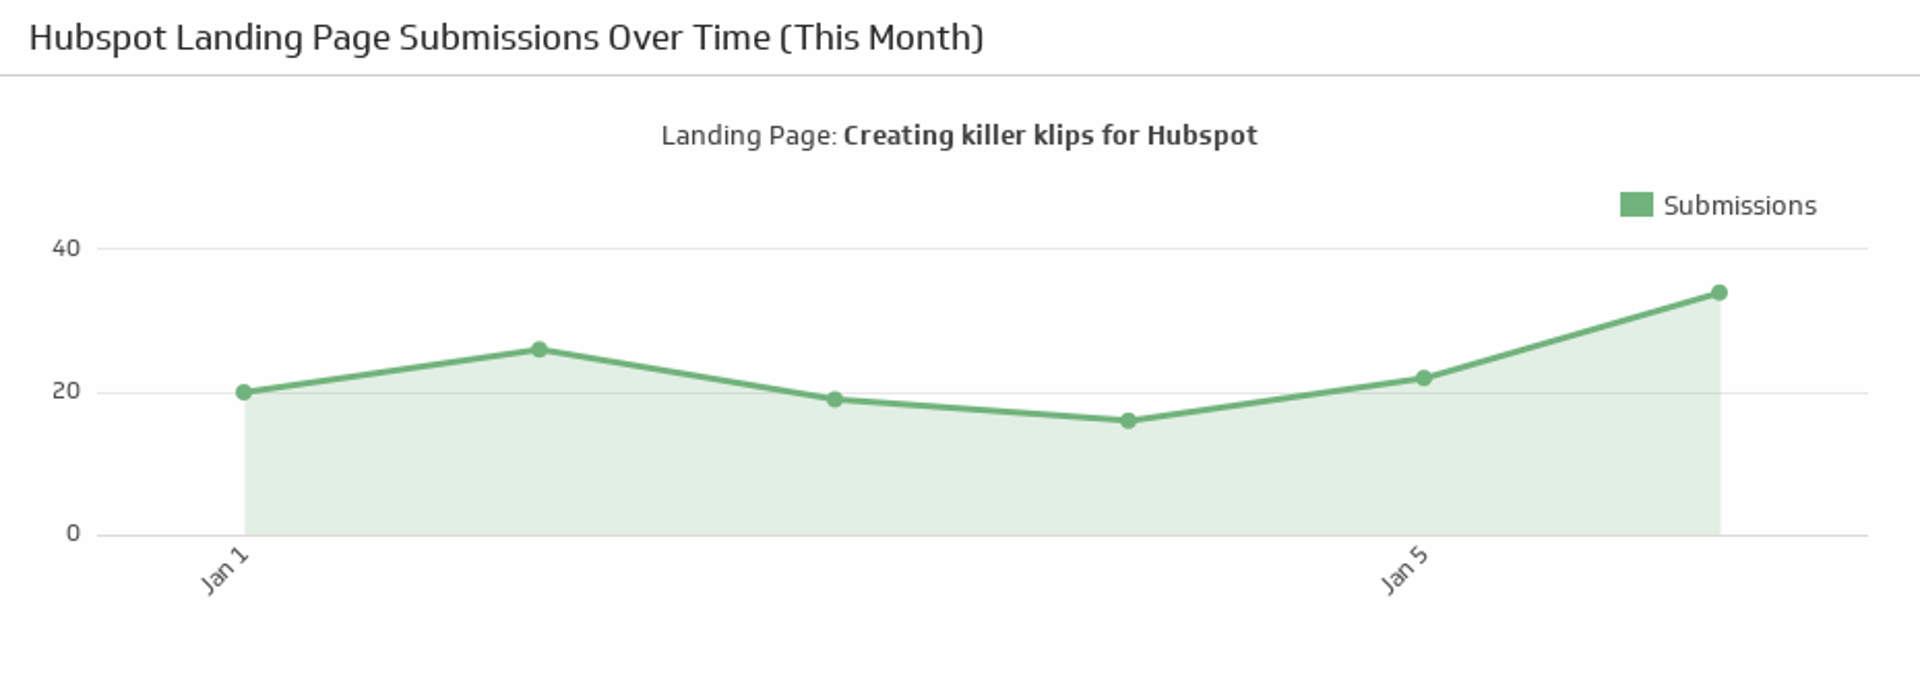
Landing Page Submissions Over Time (This Month)
Track submissions on your chosen landing page this month.
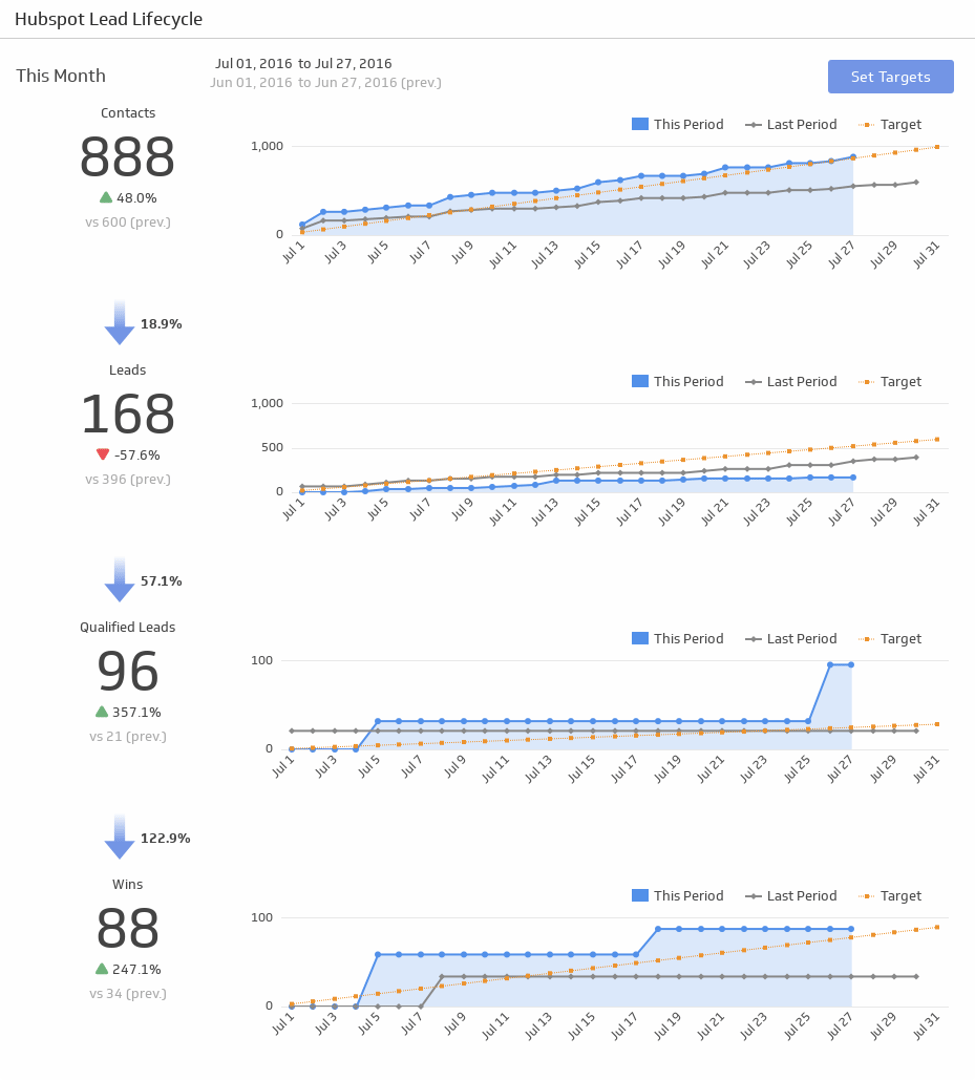
Lead Lifecycle
Take your marketing funnel to the next level! This is a complete lead lifecycle funnel with total numbers at each stage, with visualizations of your progress.
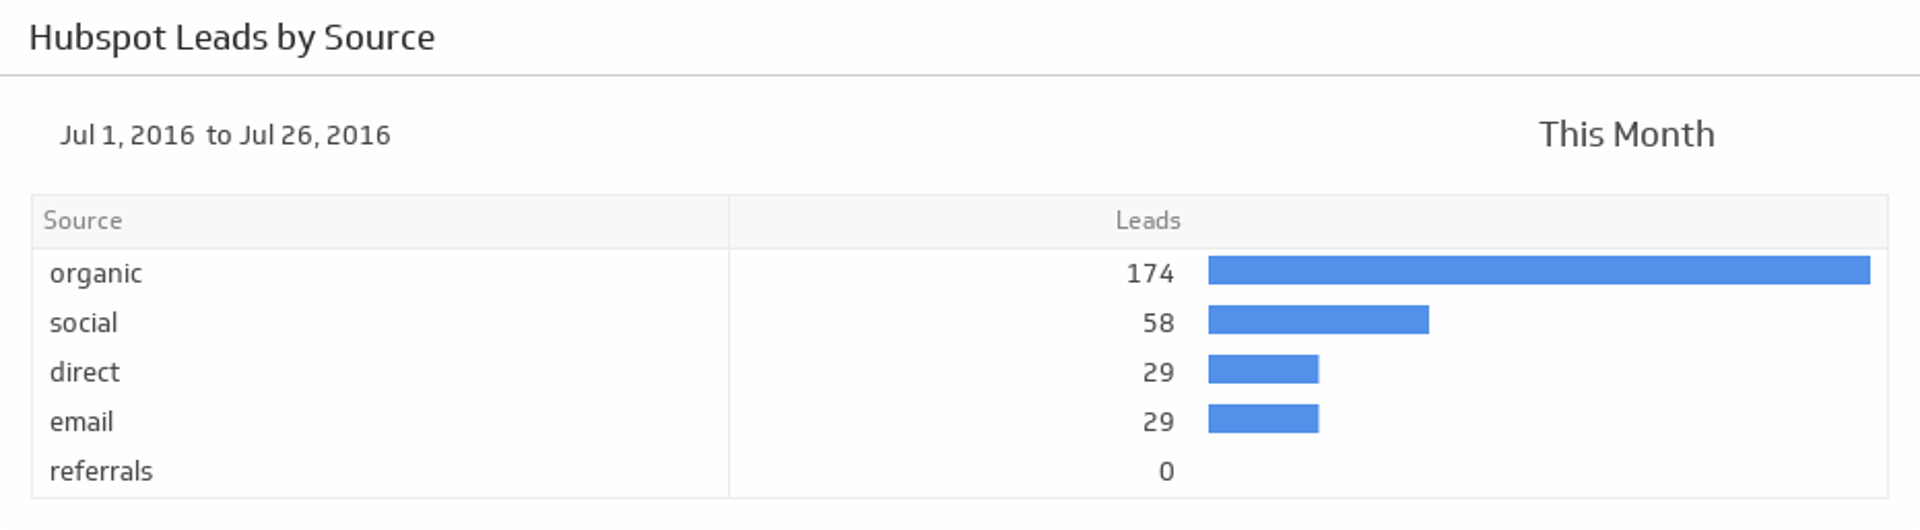
Leads by Source
Segment your leads by source and discover which sources are bringing in the most and the least leads during the time period of your choice.
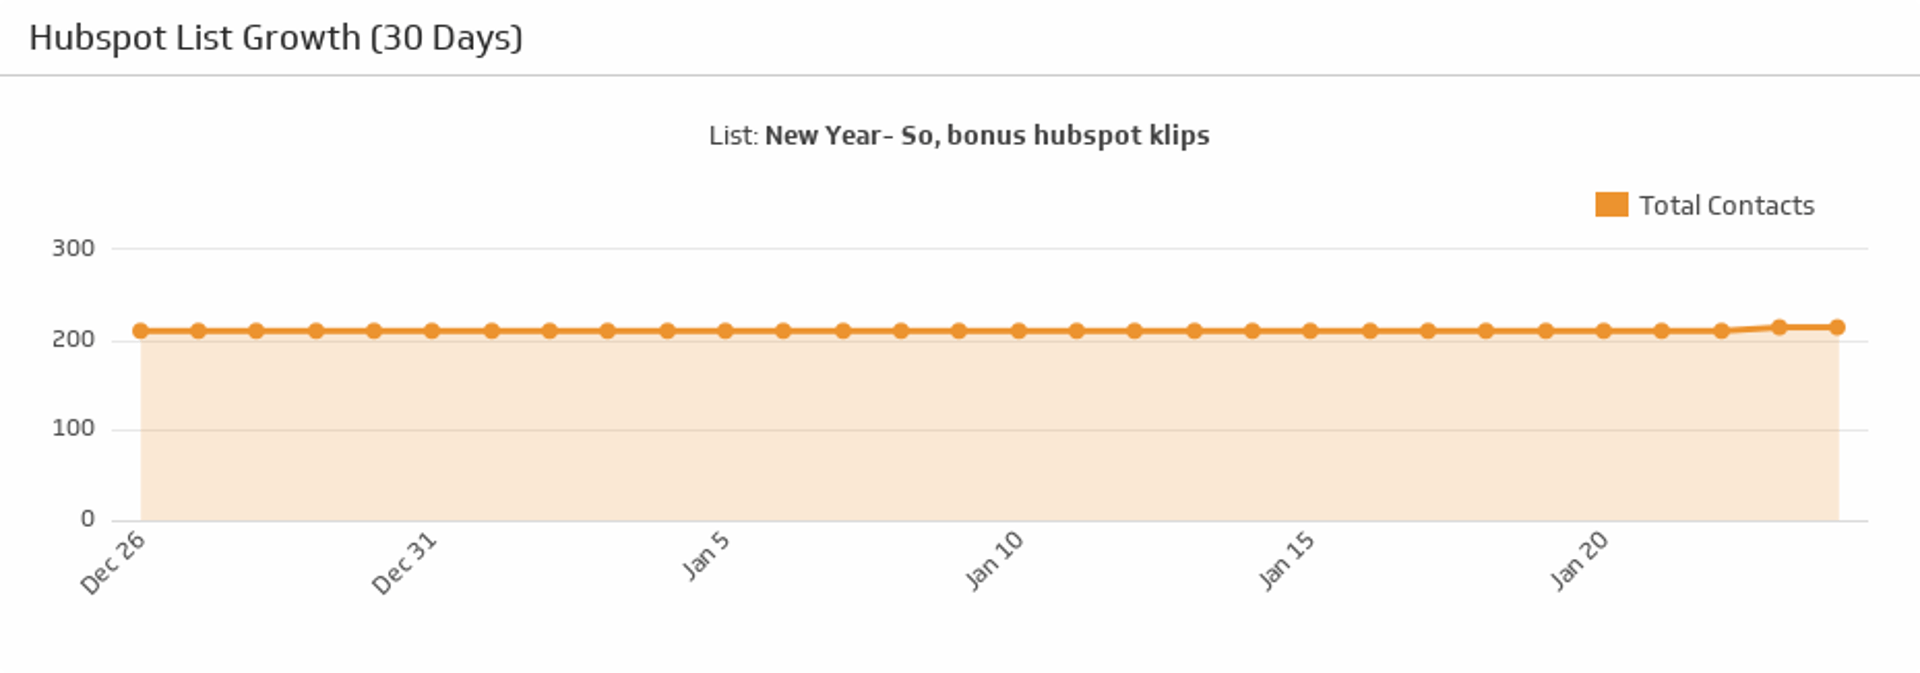
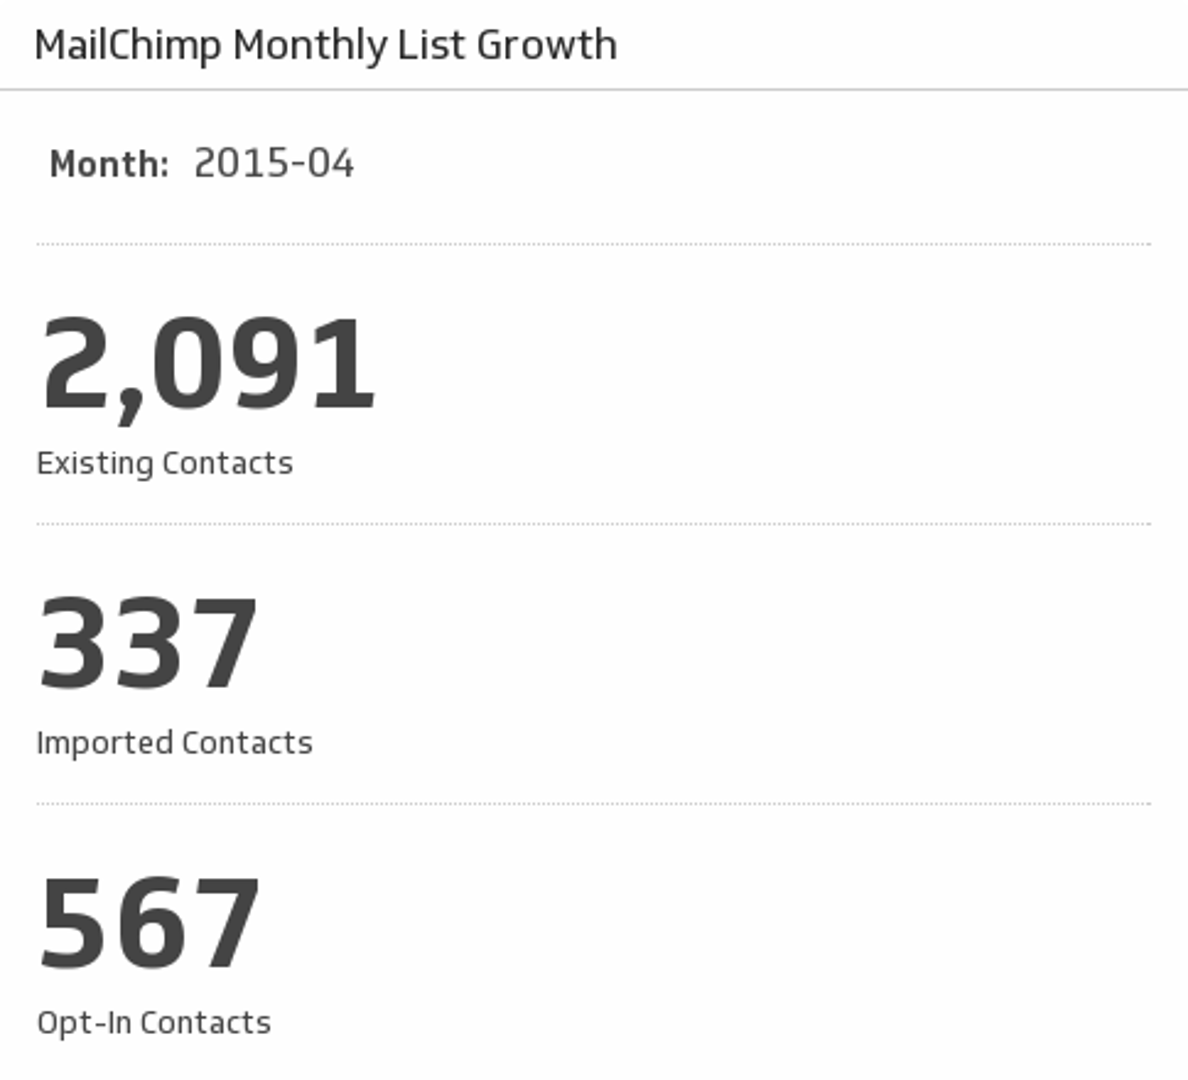
List Growth
Select one of your HubSpot lists and see how it has grown over the past 30 days.
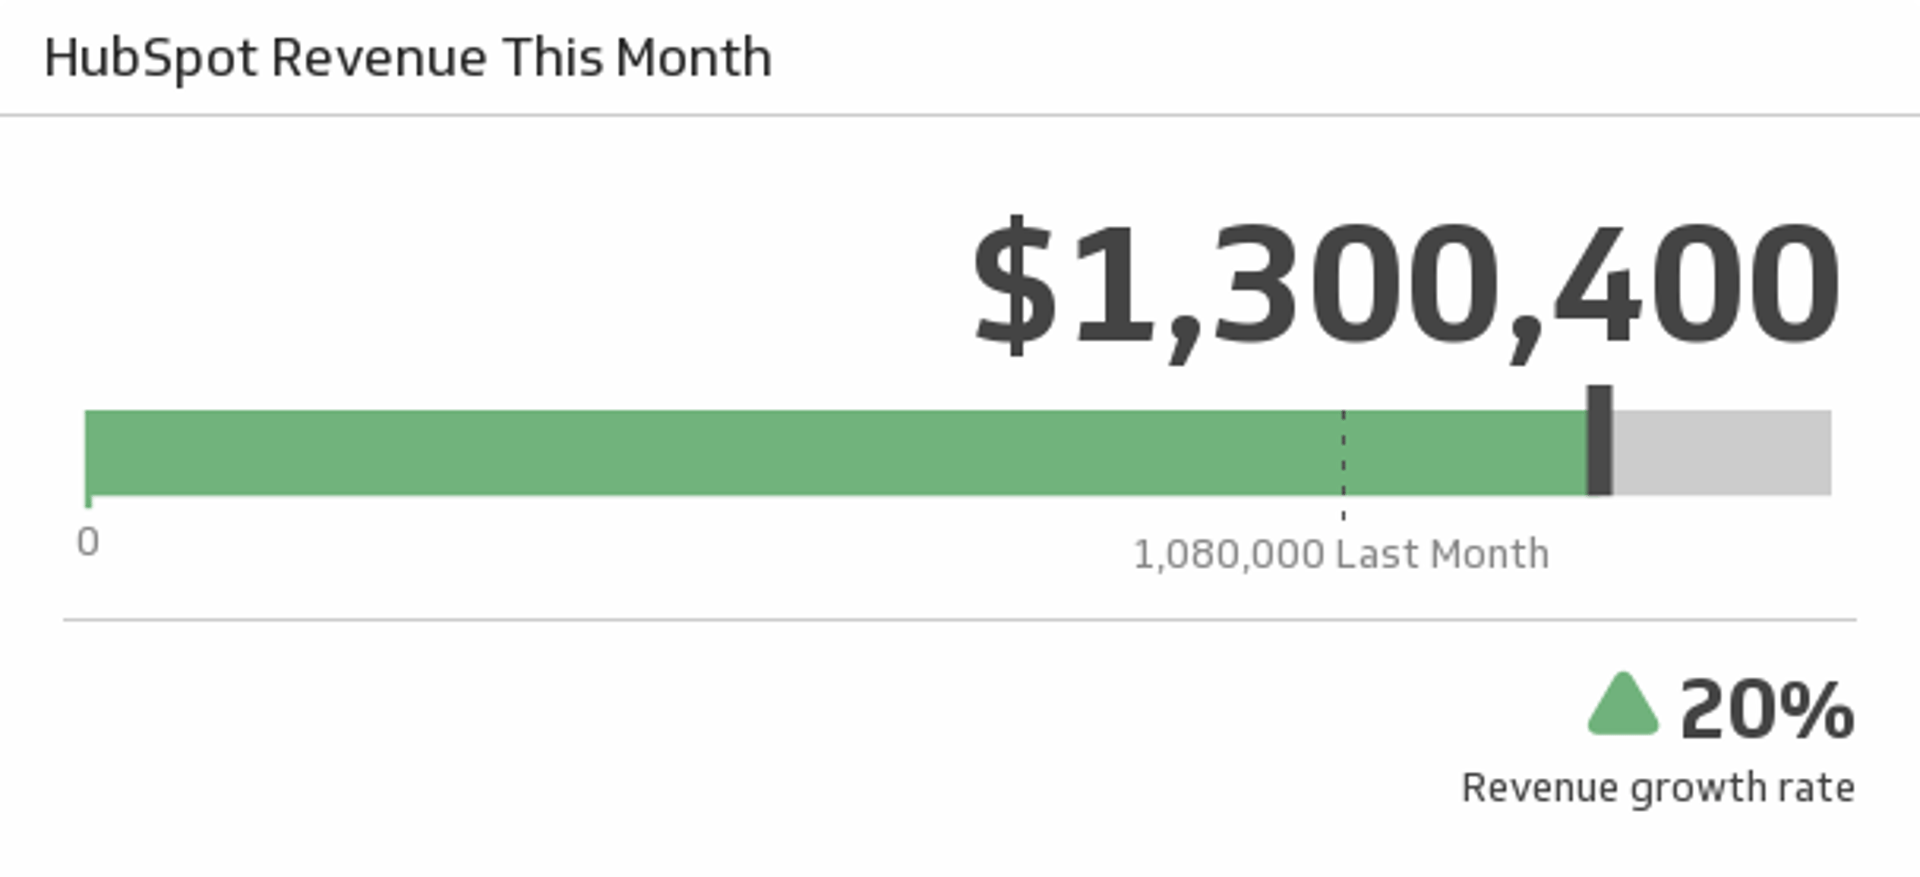
Revenue This Month
Track your total revenue this month, and compare it to last month and your revenue growth rate.
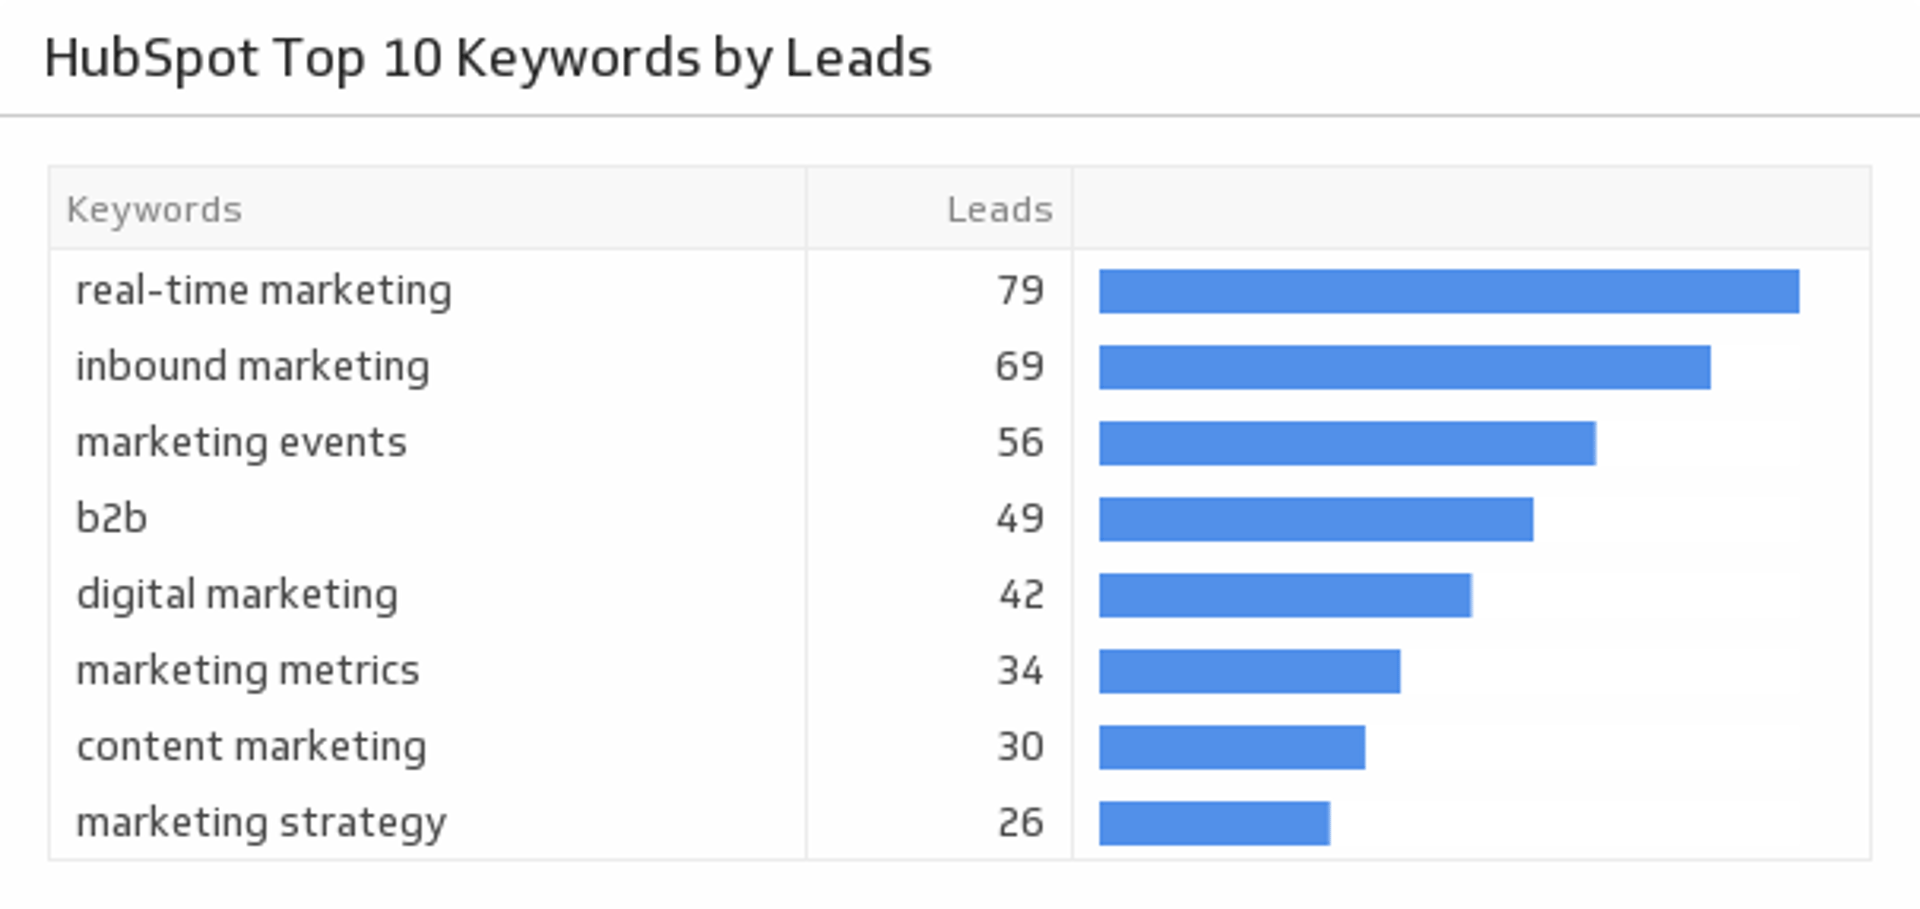
Top 10 Keywords by Leads
Compare your top 10 keywords with the number of leads they generate.
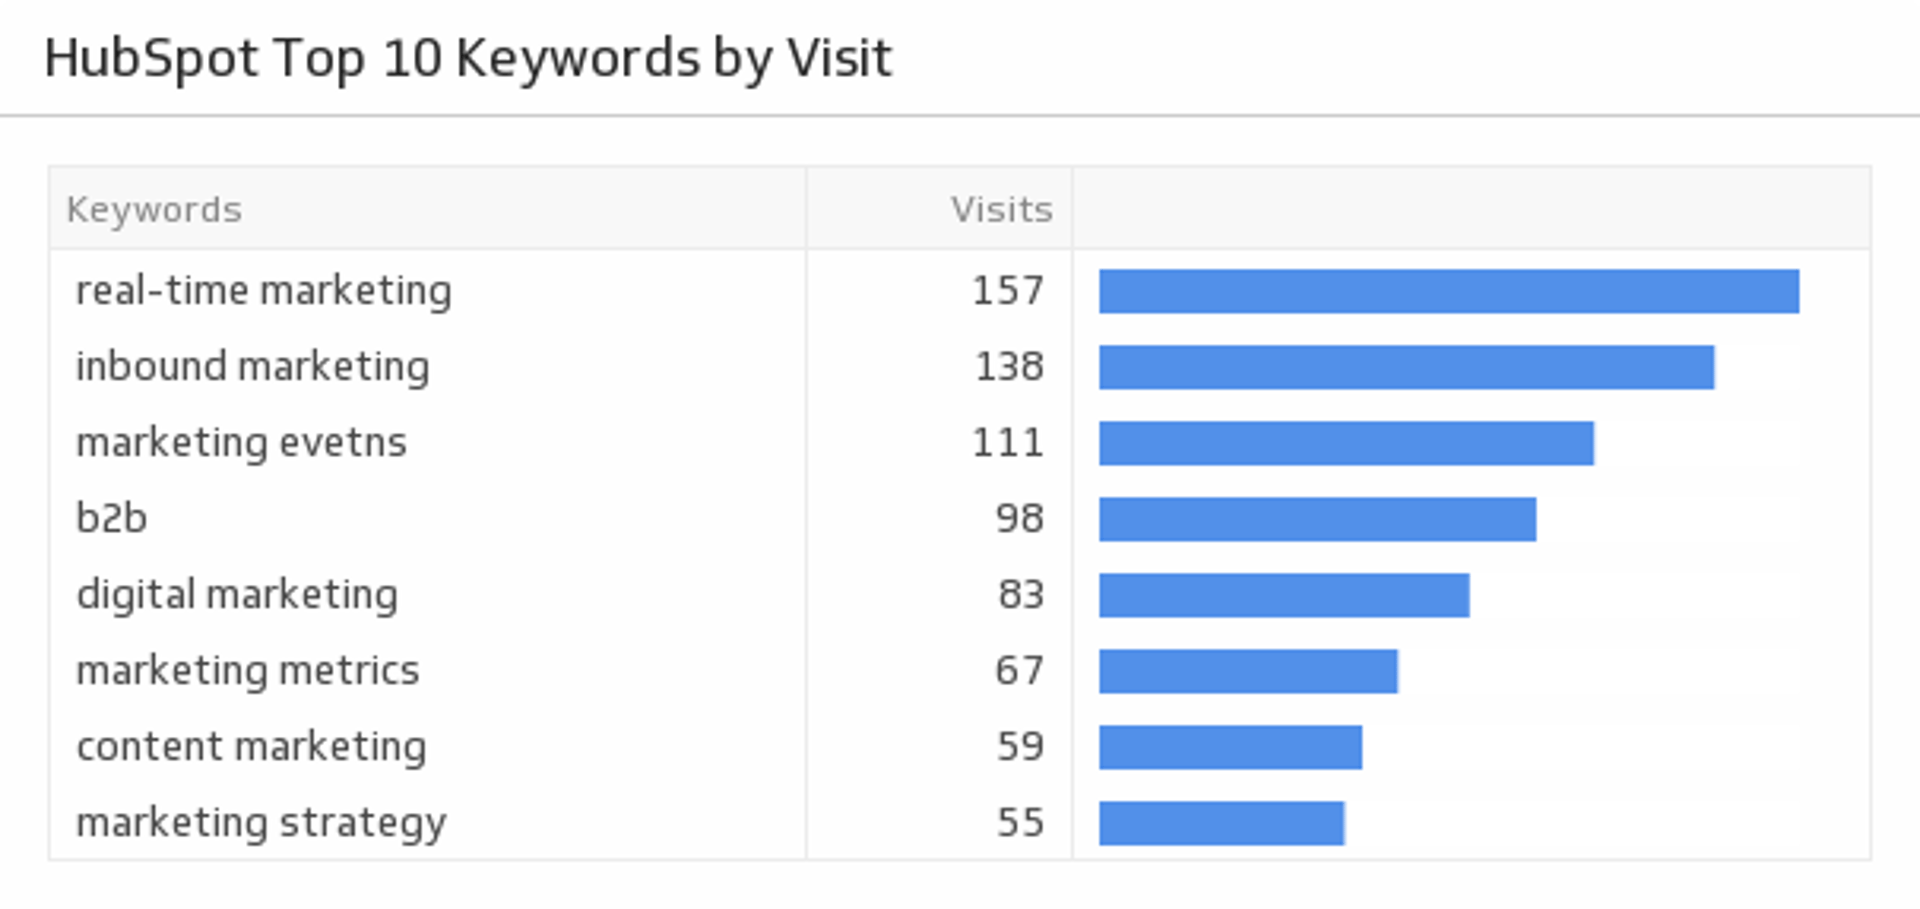
Top 10 Keywords by Visits
Compare your top 10 keywords with the number of visits they generate.
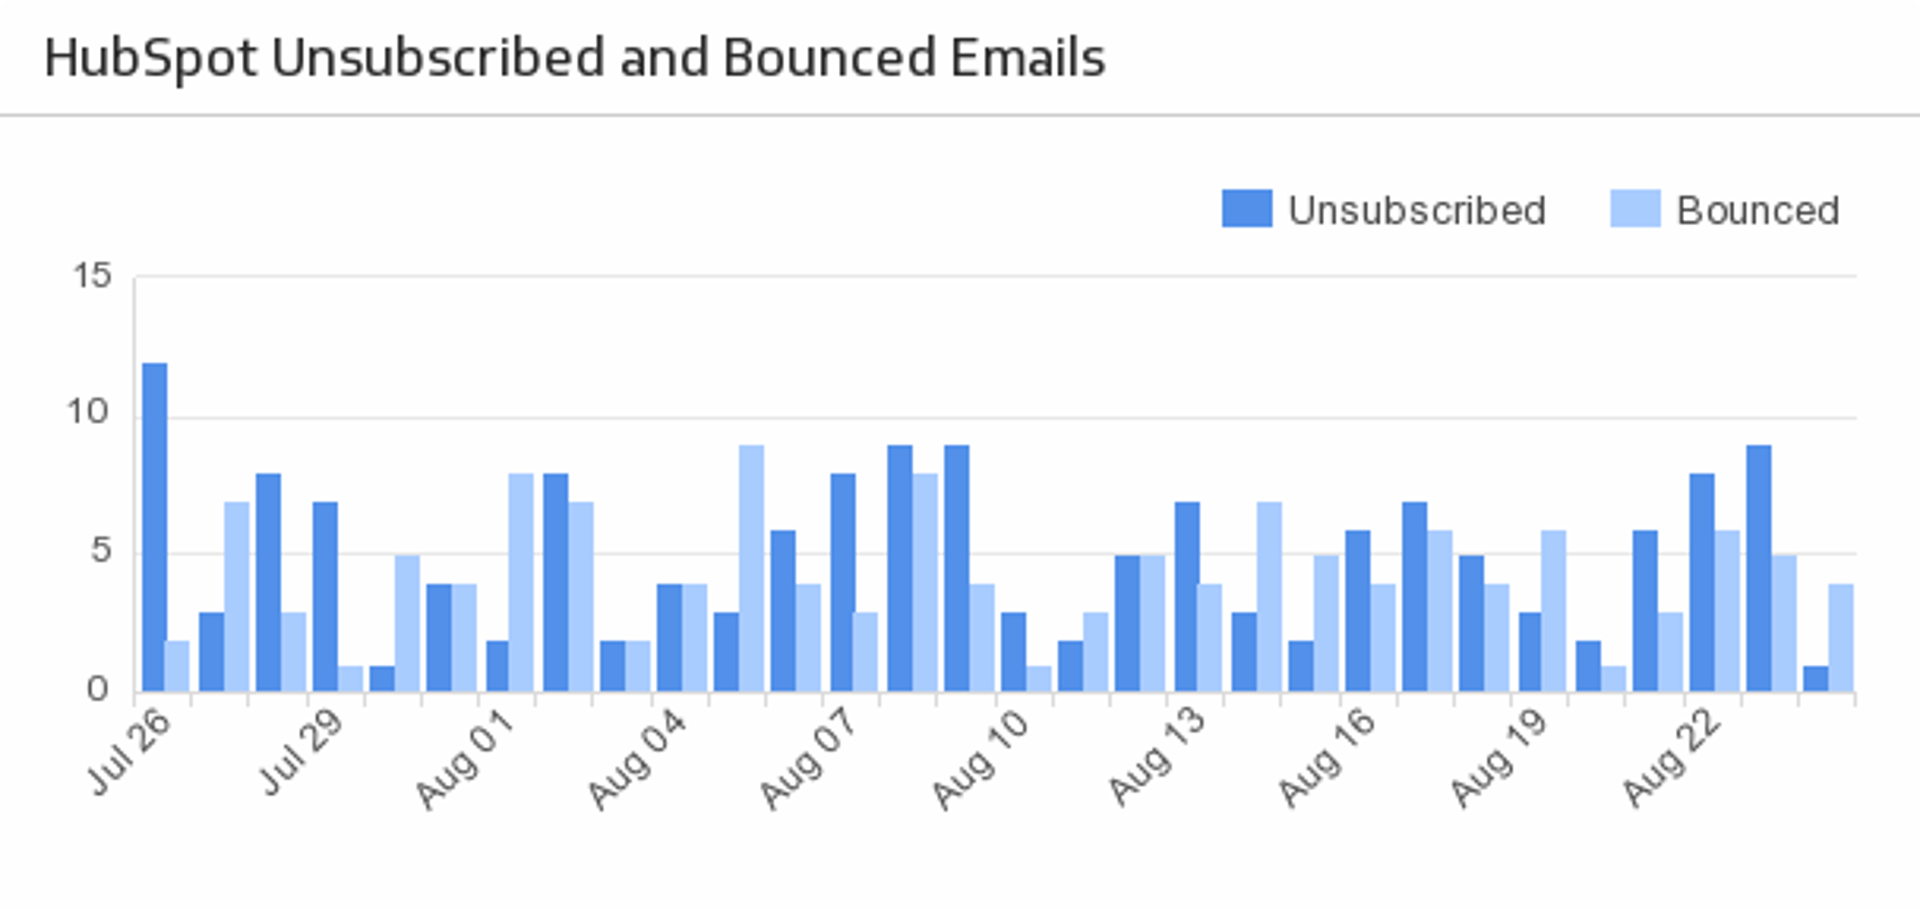
Unsubscribed and Bounced Emails (Last 30 Days)
Plot the number of the email recipients that either unsubscribed or bounced within the past 30 Days.
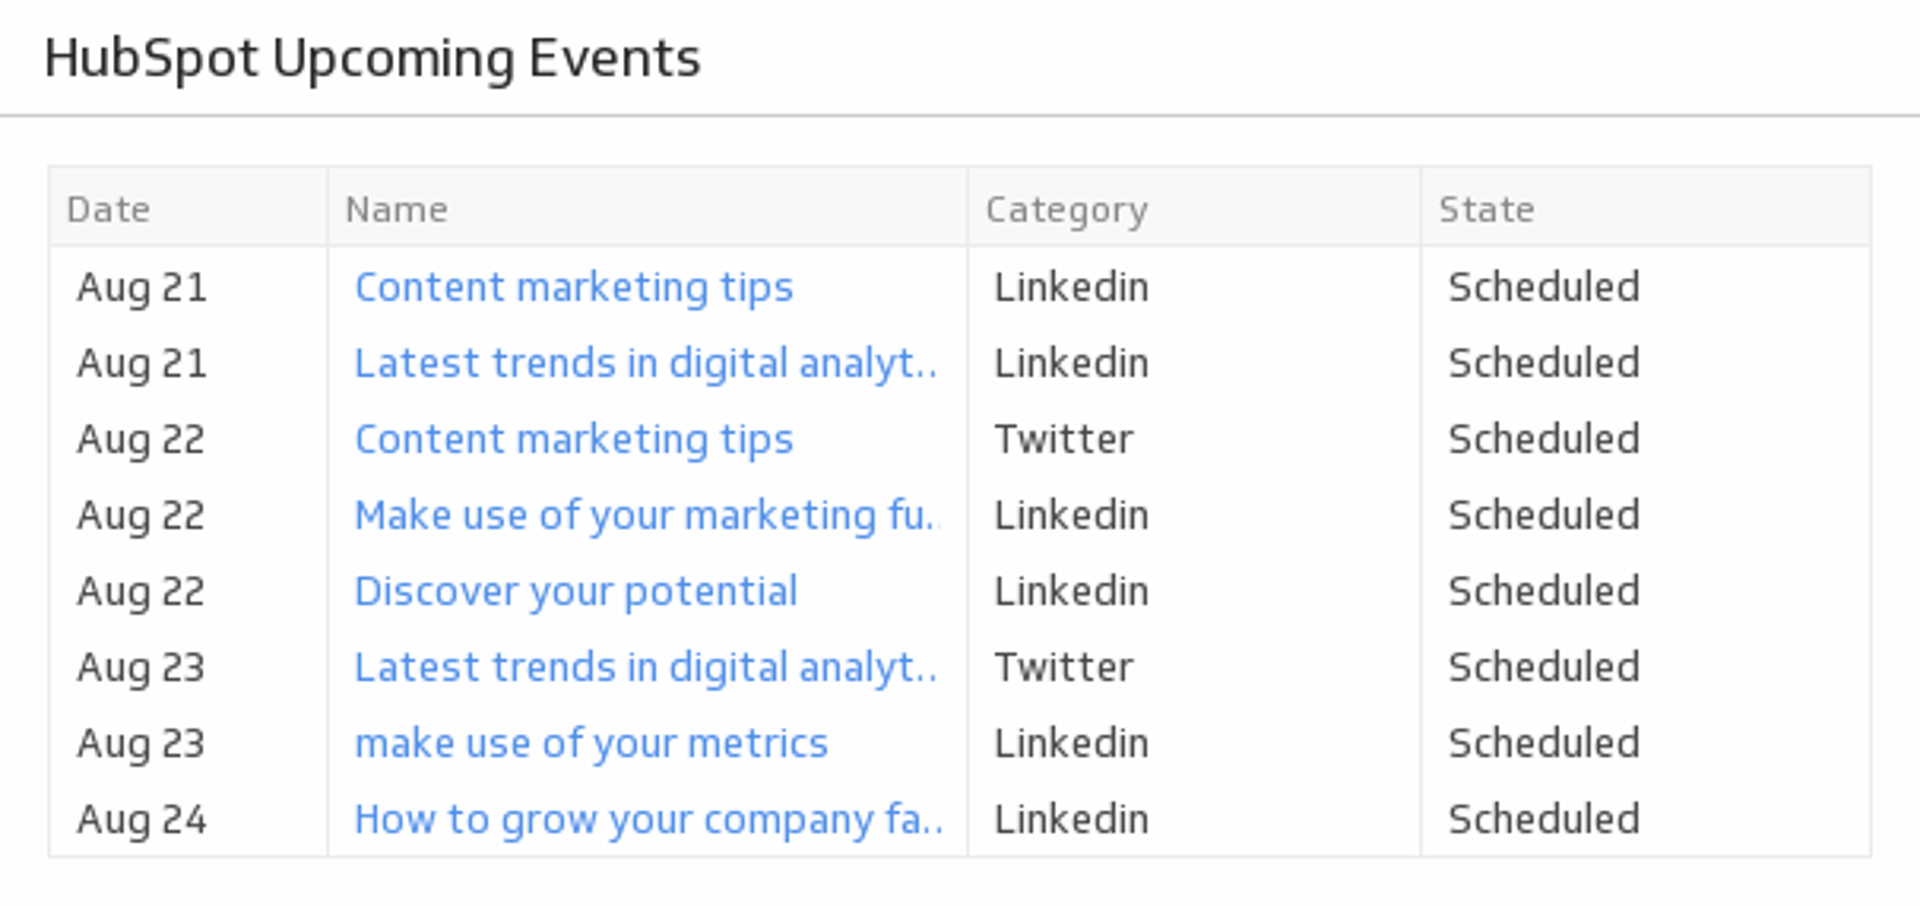
Upcoming Events
Track your HubSpot calendar events for the next 7 days.
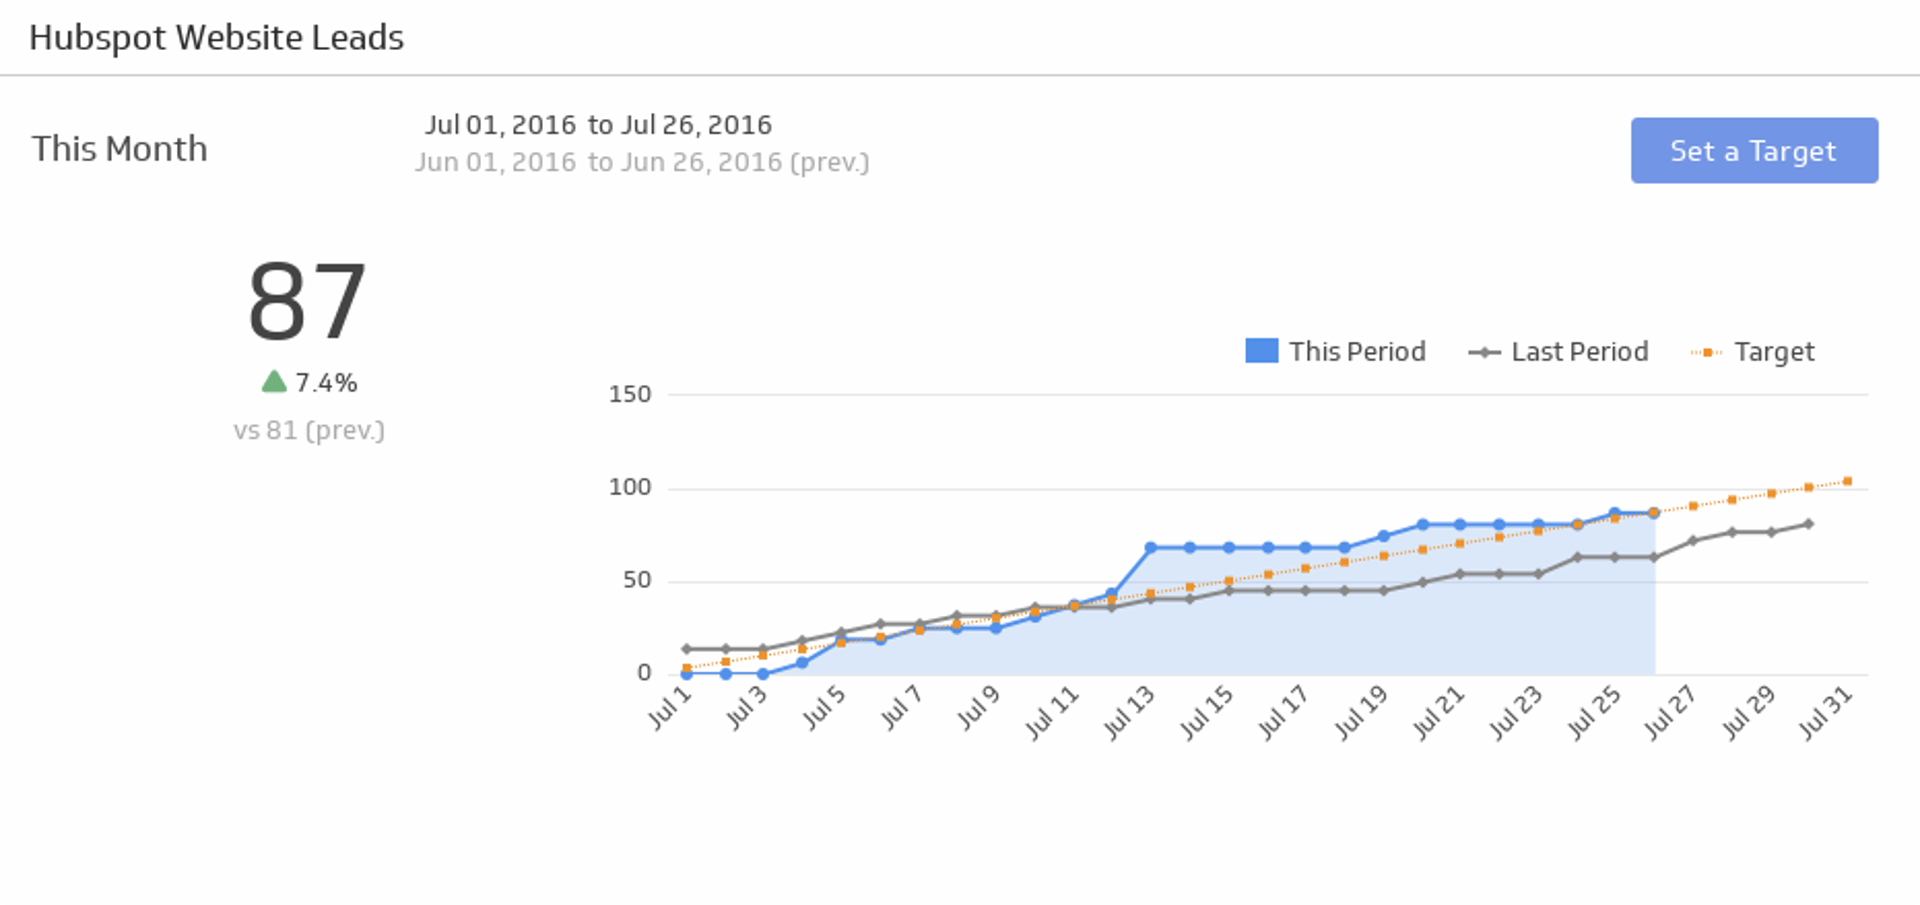
Website Leads
Make sure you are getting a steady stream of leads to your website.
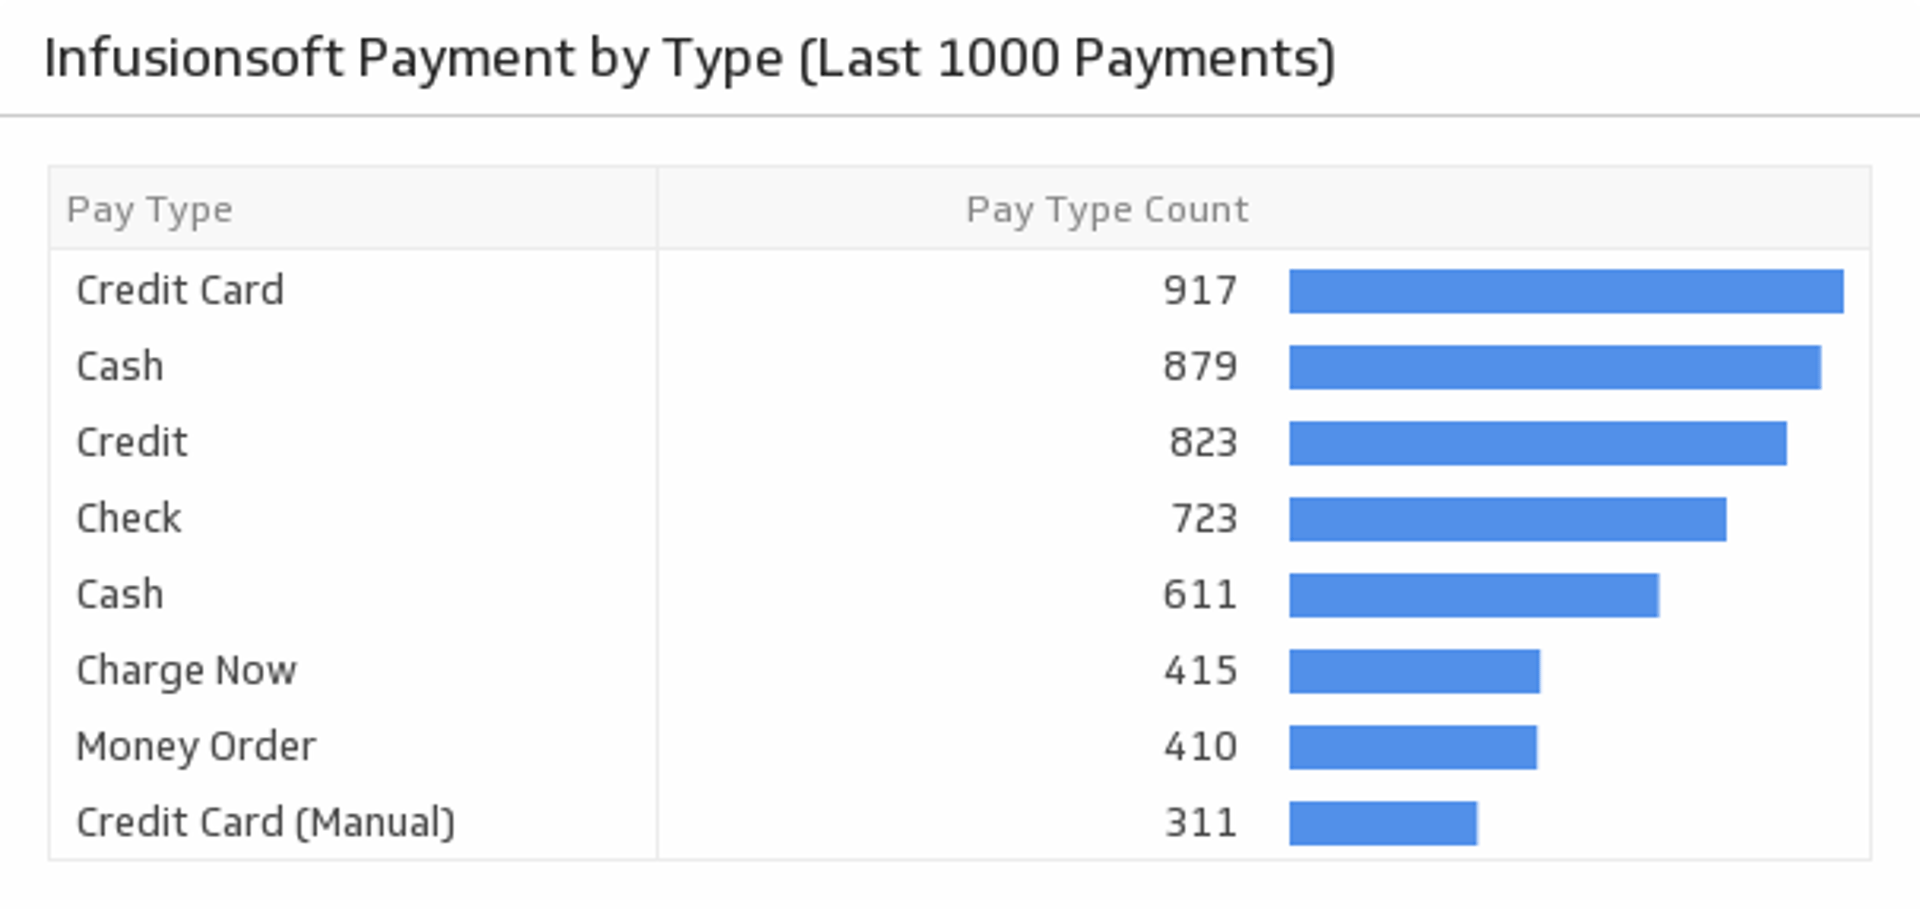
Payment by Type (Last 1000 Payments)
Monitor your top payment methods by type.
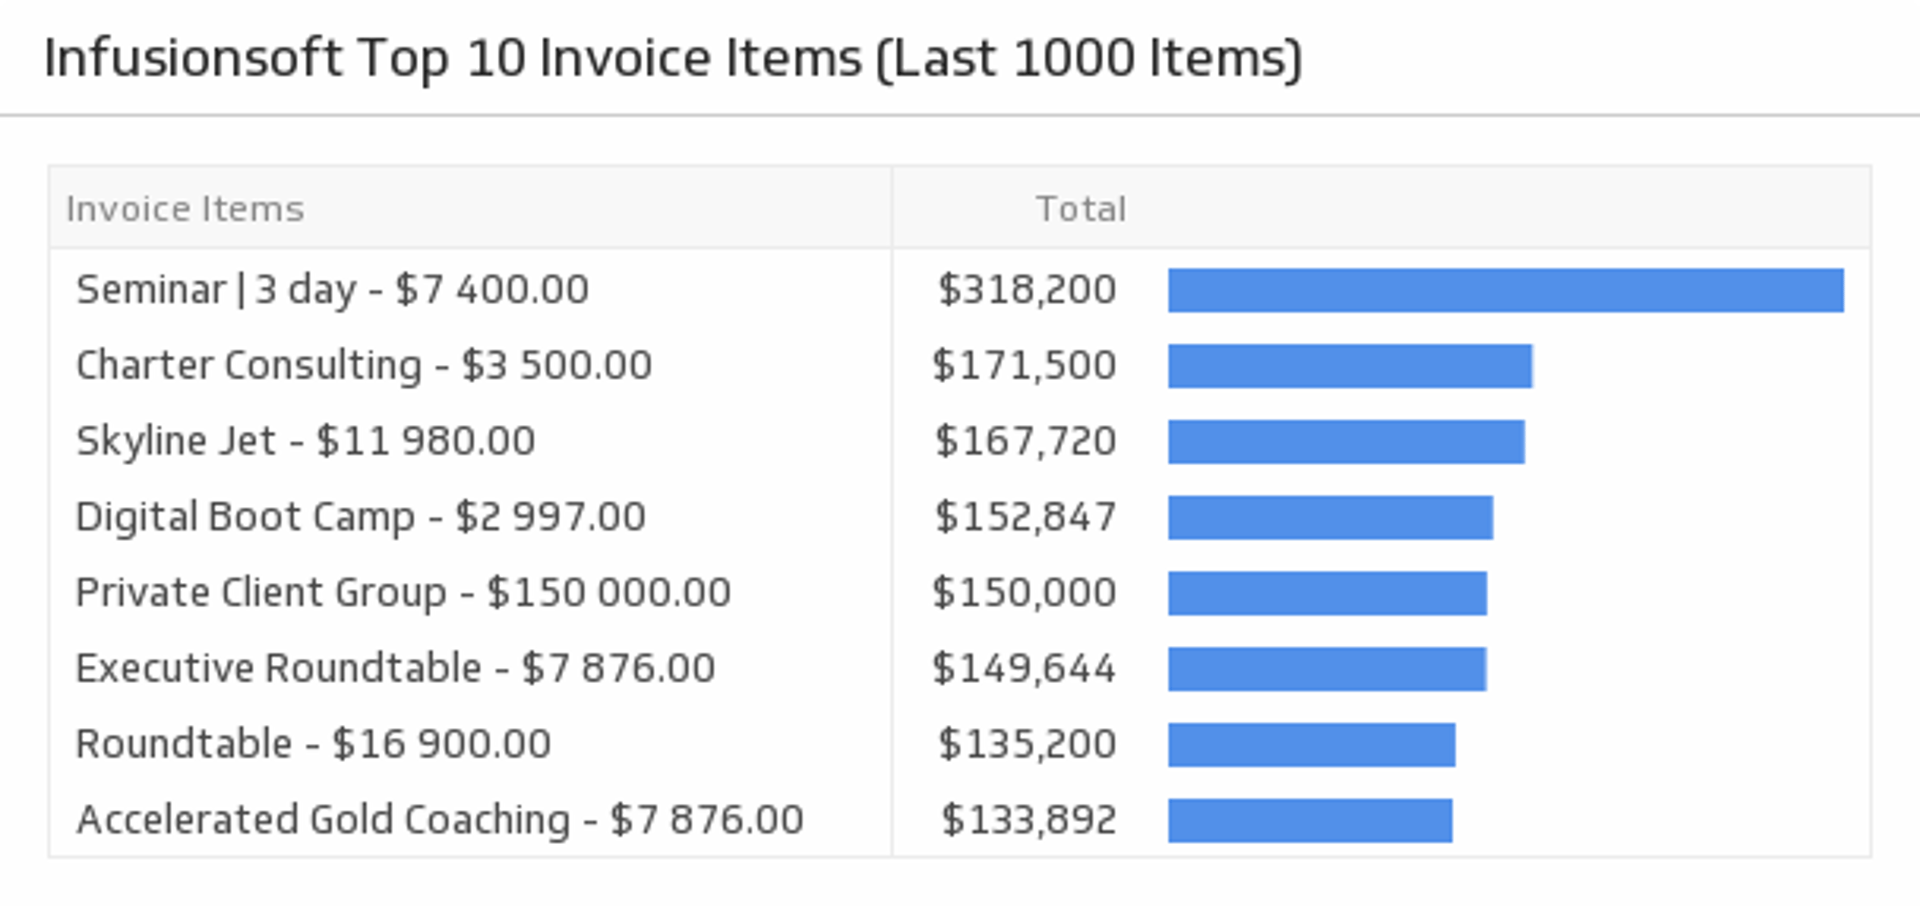
Top 10 Invoice Items (Last 1000 Items)
Discover which invoice items are bringing in the most revenue.
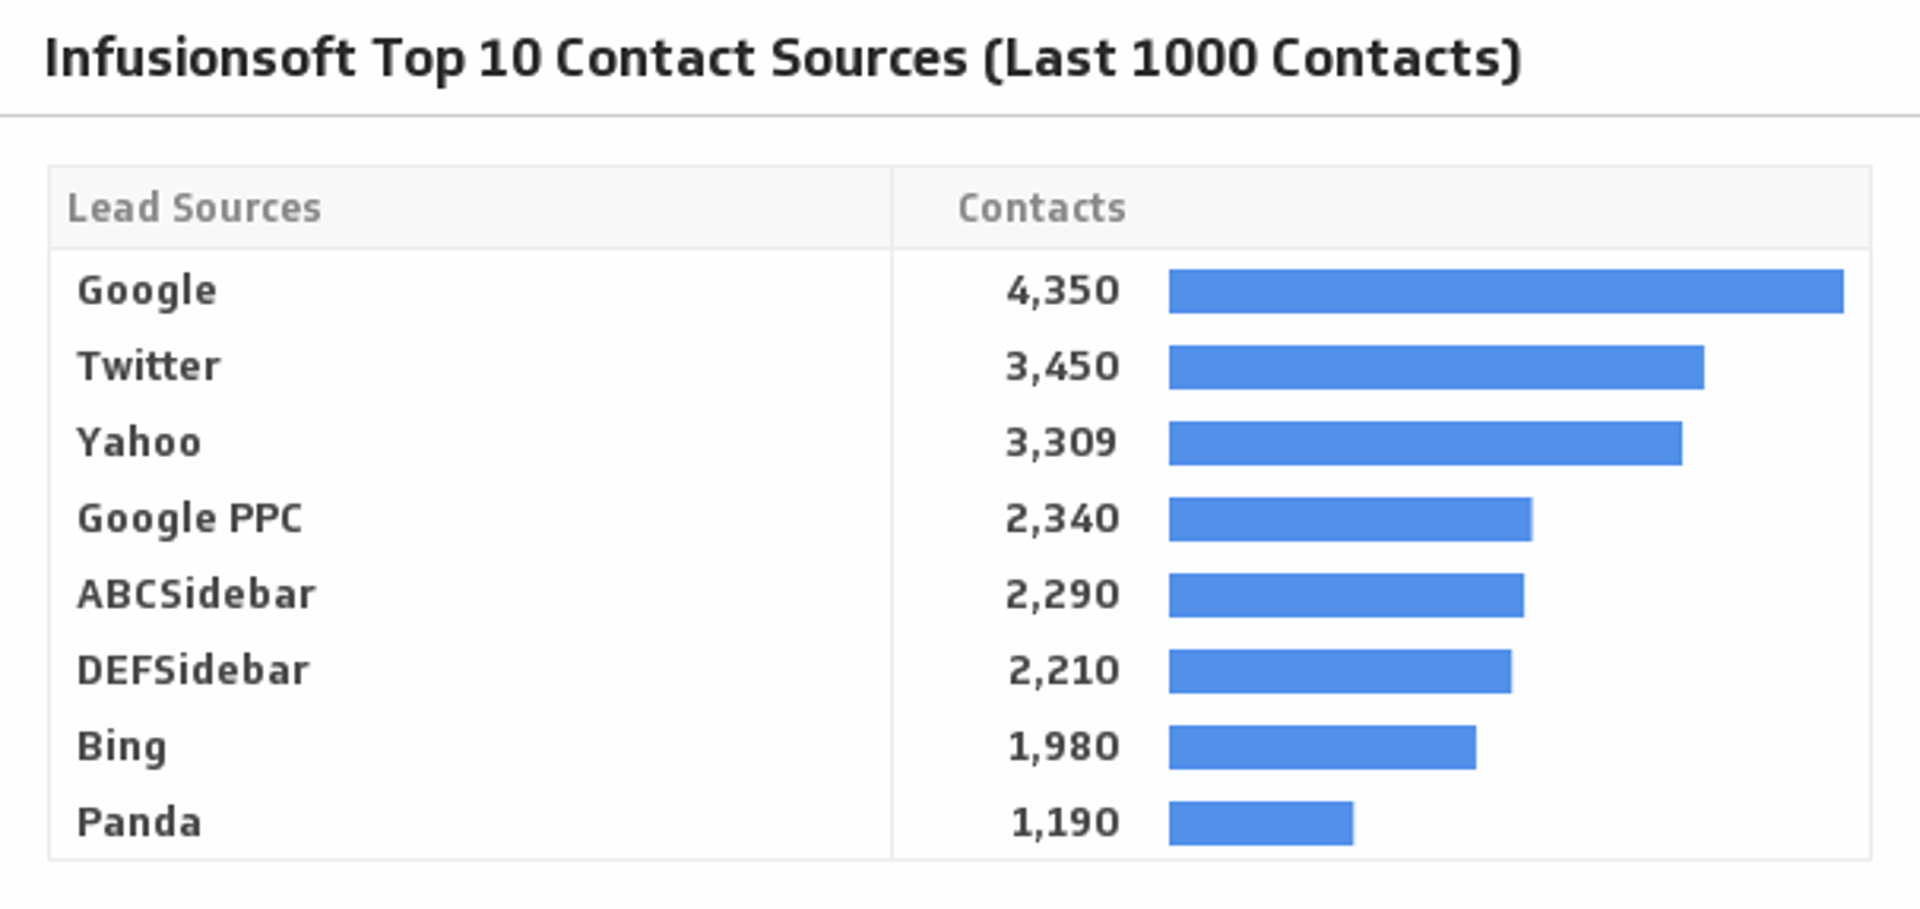
Top Contact Sources (Last 1000 Contacts)
See where your traffic is coming from by visualizing your top ten contact sources.
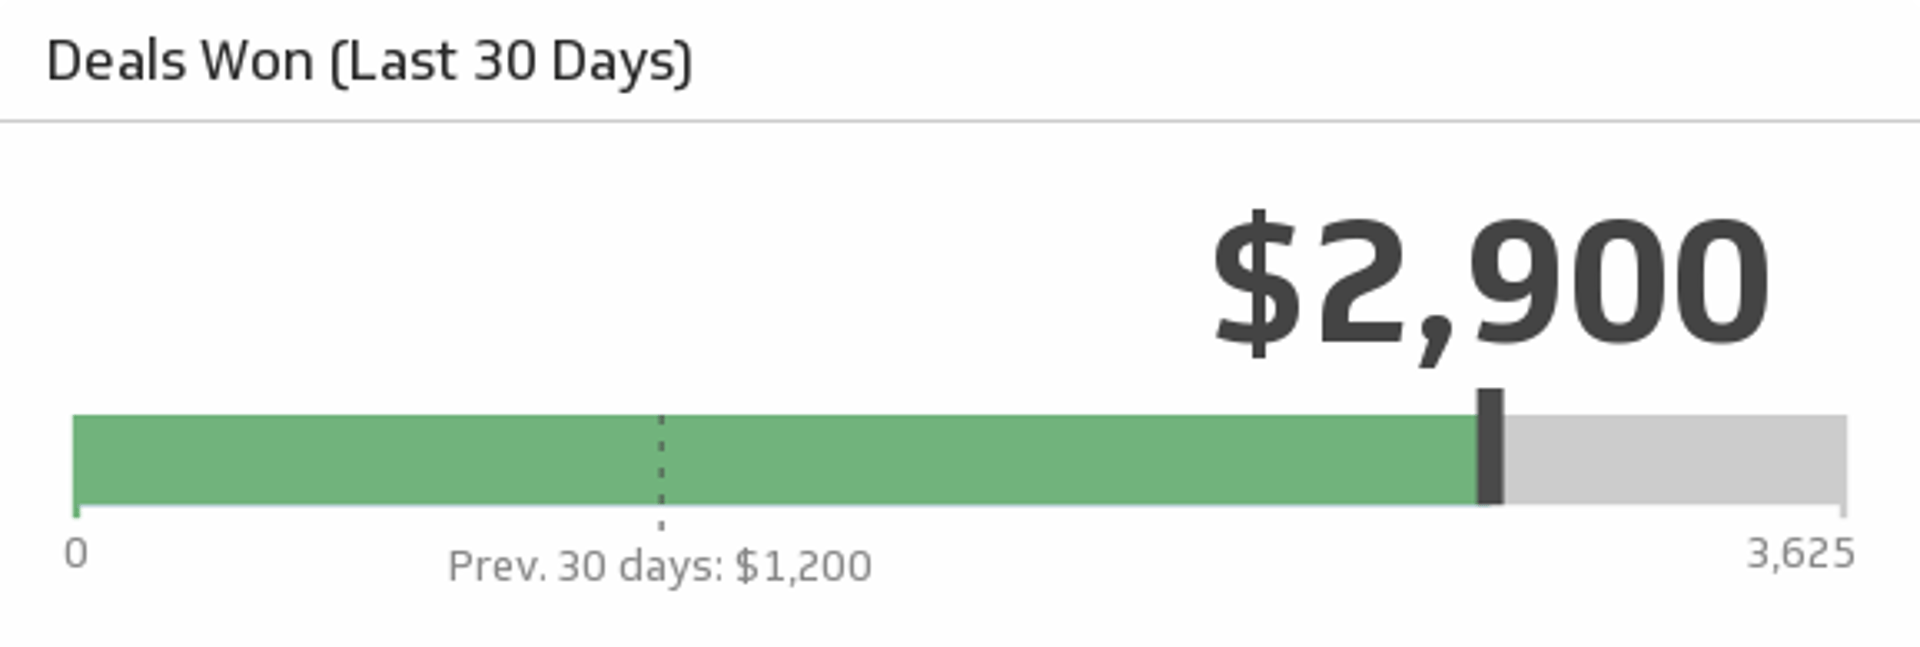
Deals Won (Last 30 days)
Monitor the total value of wins over the past 30 days, and compare it to the total from the previous 30 days.
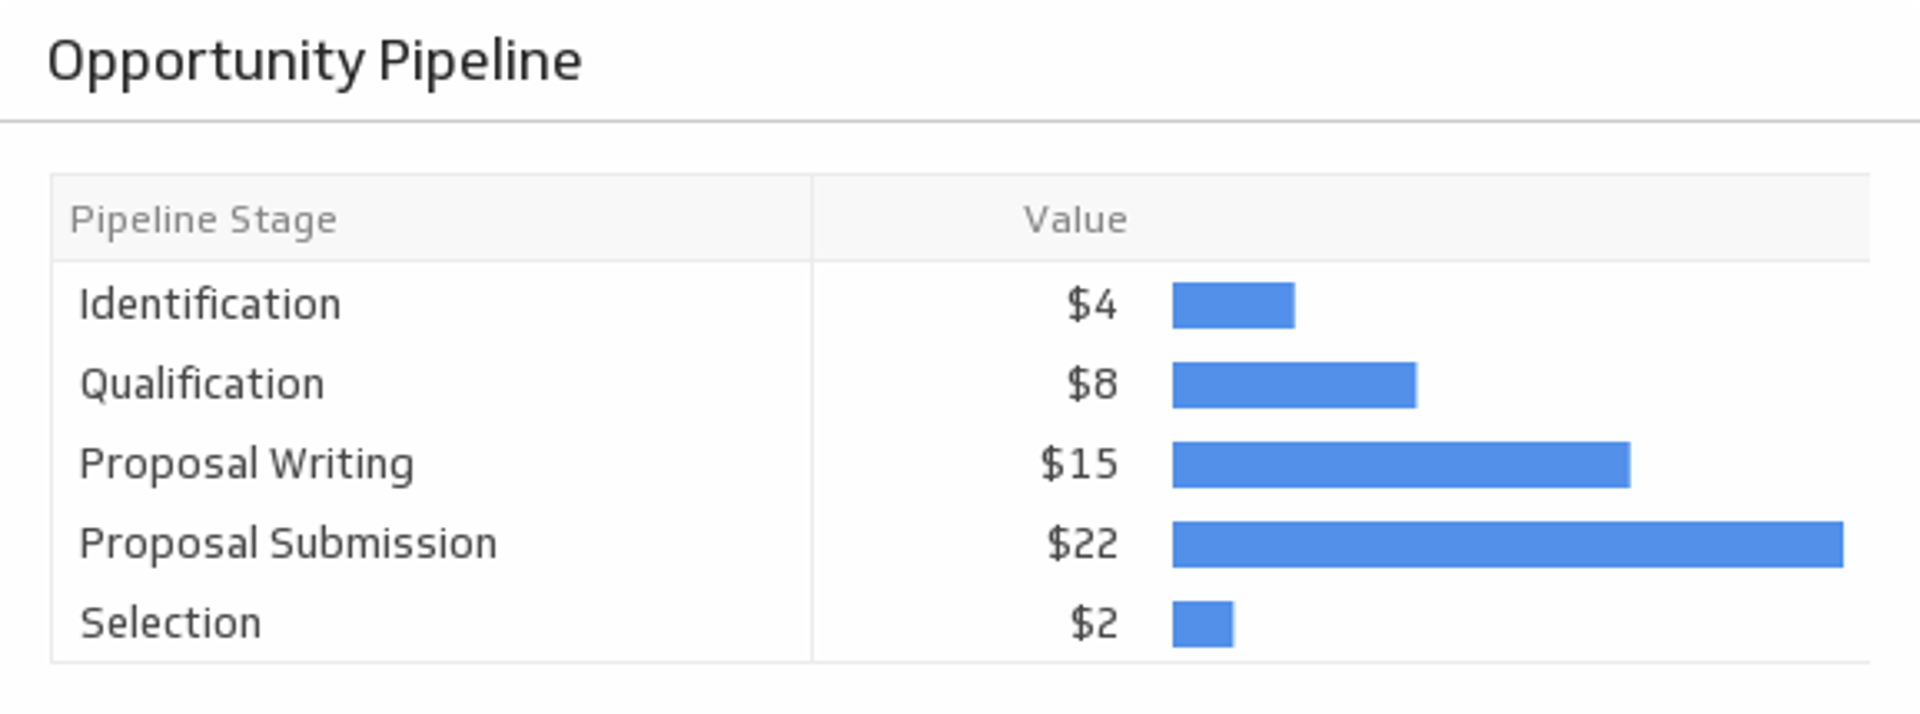
Opportunity Pipeline
Monitor the volume of opportunities at every stage of the pipeline along with the value of each stage. Measure which stage has the highest value and consider focusing on addressing users in that stage of the pipeline.
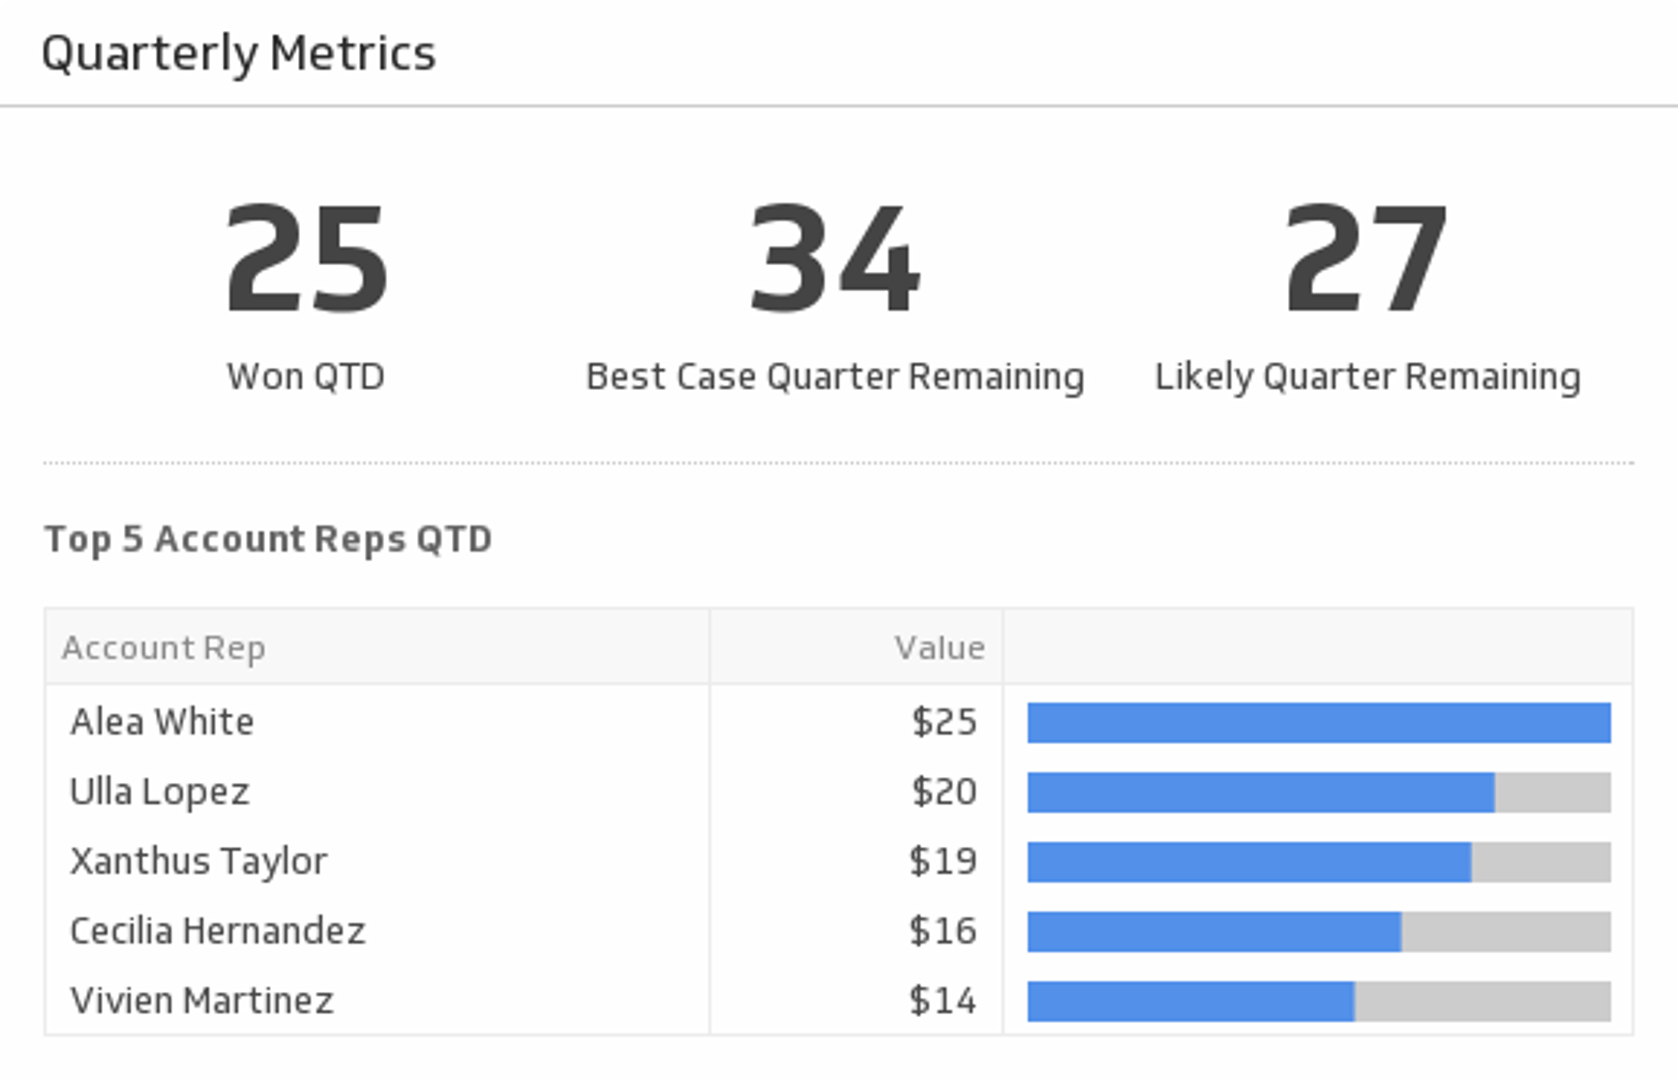
Quarterly Metrics
Track your most pivotal metrics for the current quarter.
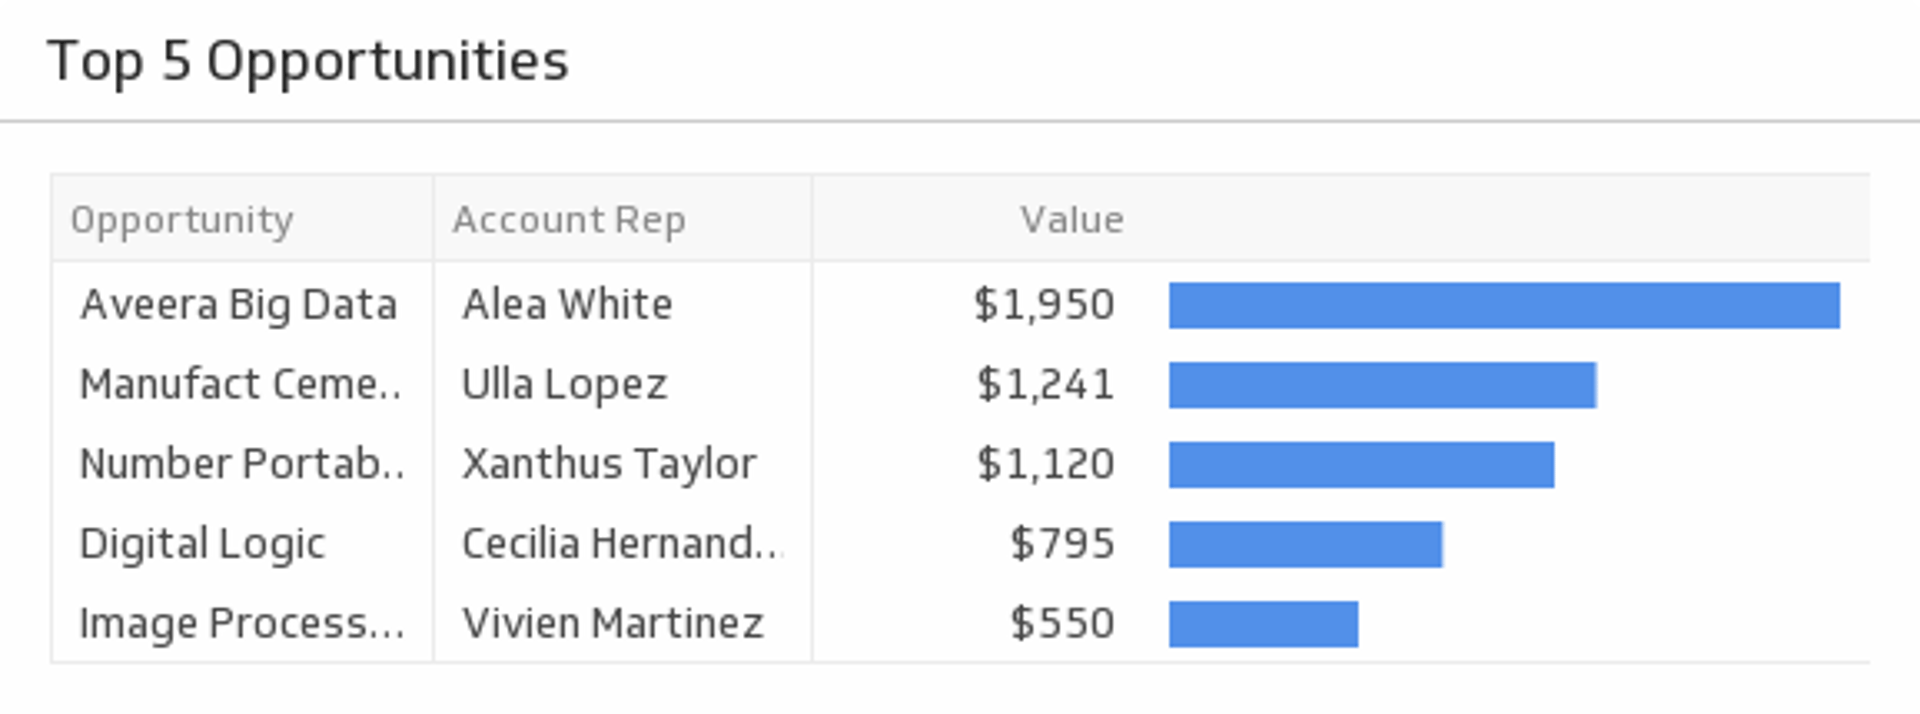
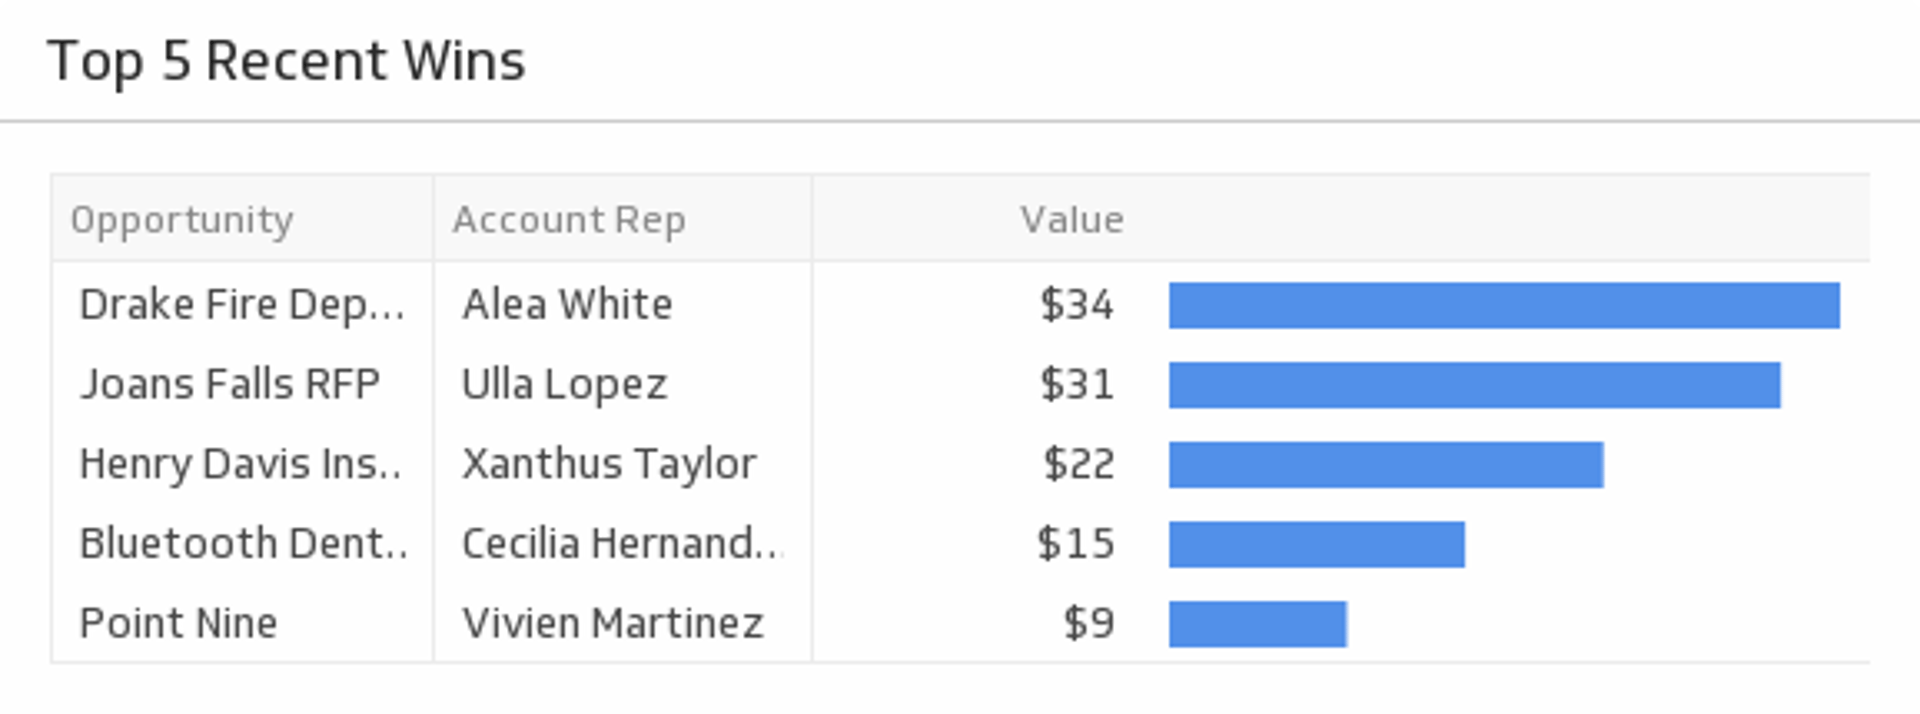
Top 5 Opportunities
Monitor your top five opportunity values and ensure they turn into wins.
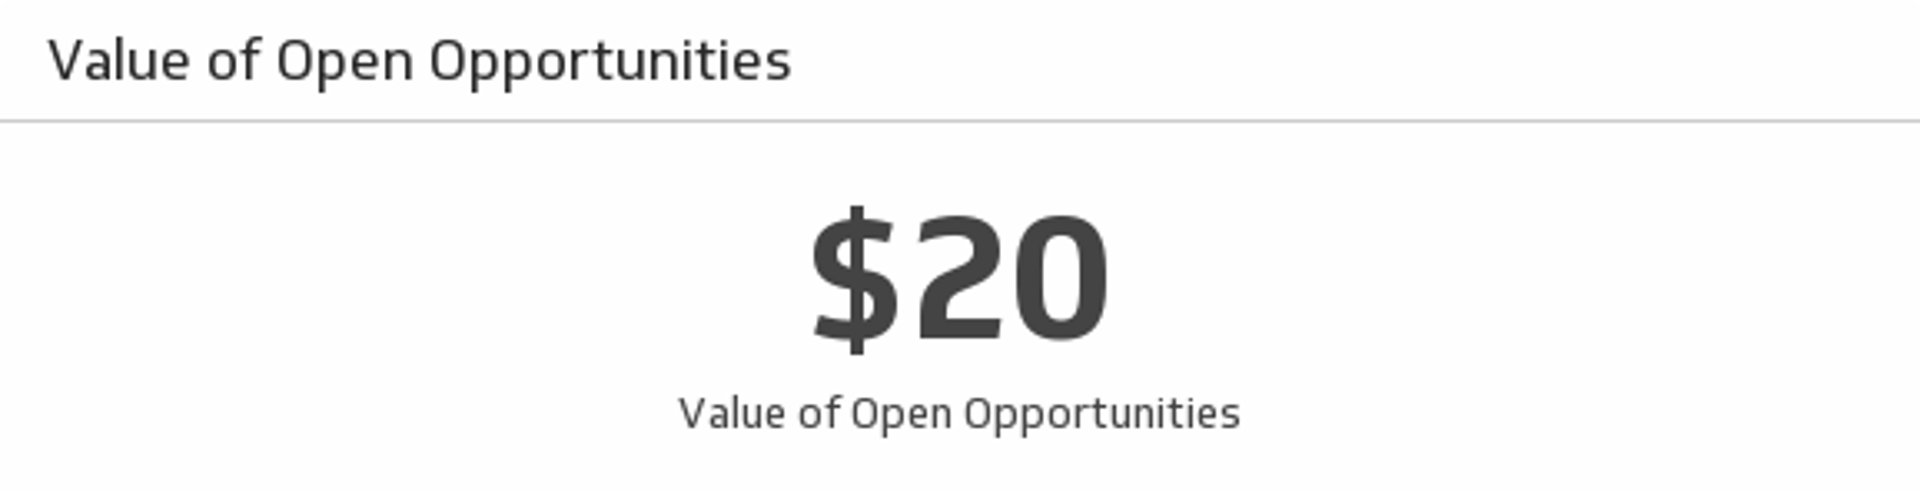
Value of Open Opportunities
View the total value of all open opportunities.
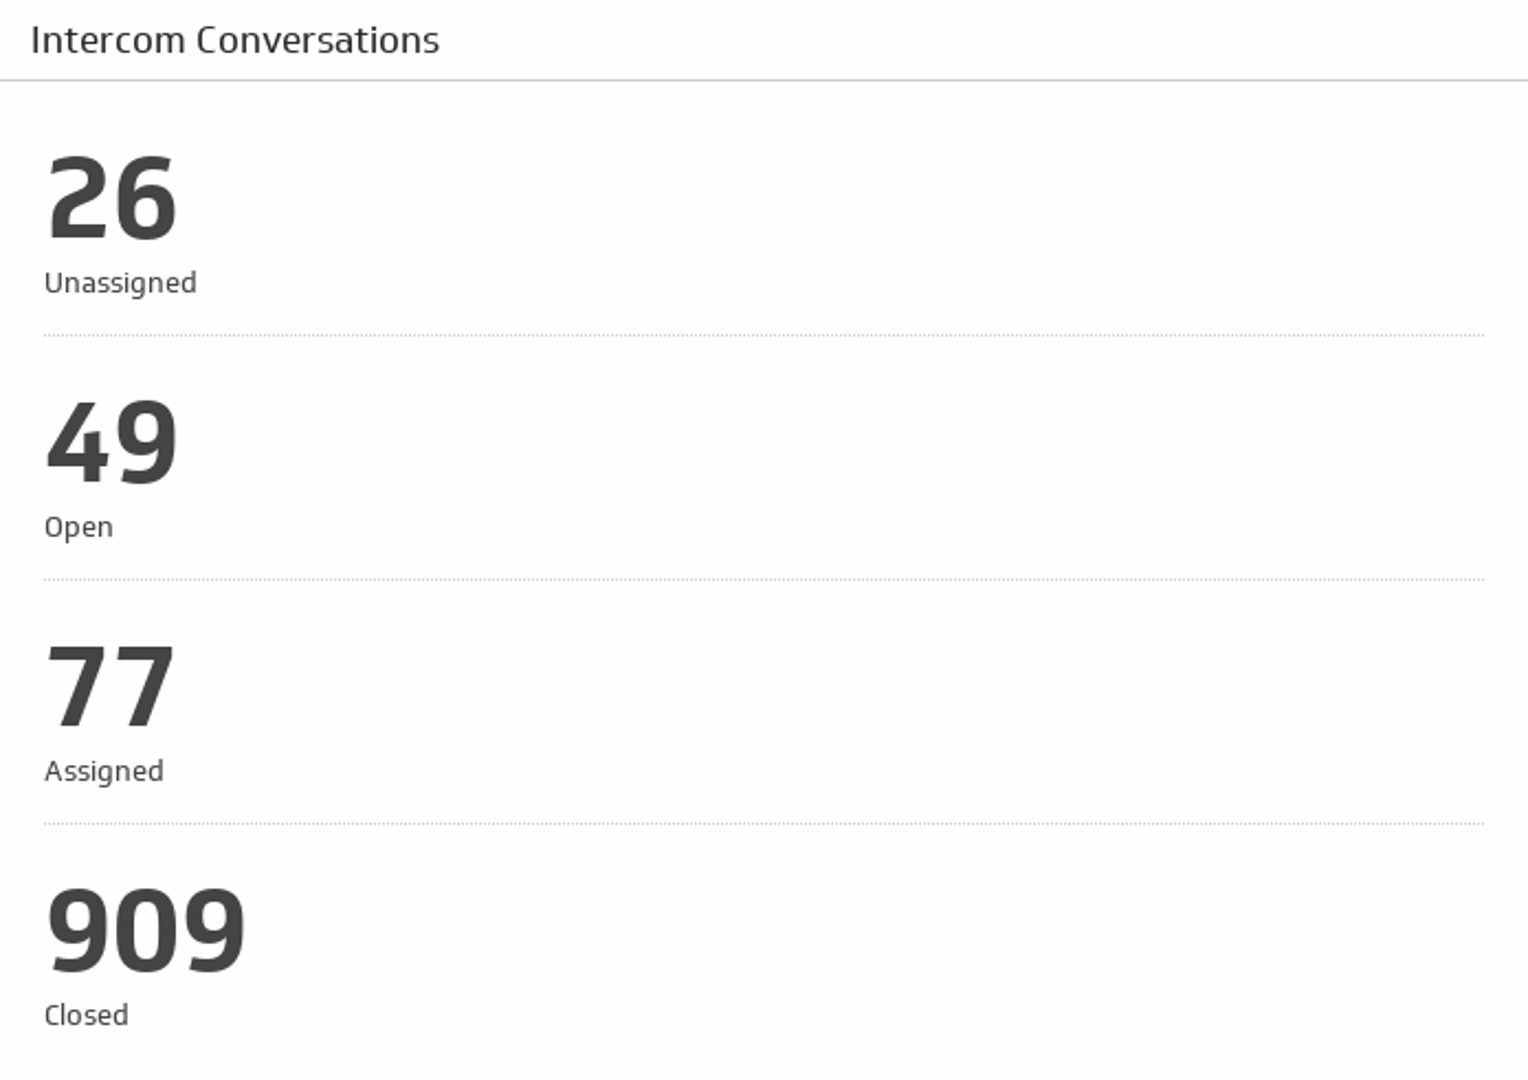
Conversations
See the total count of your open, closed, unassigned, and assigned conversations.
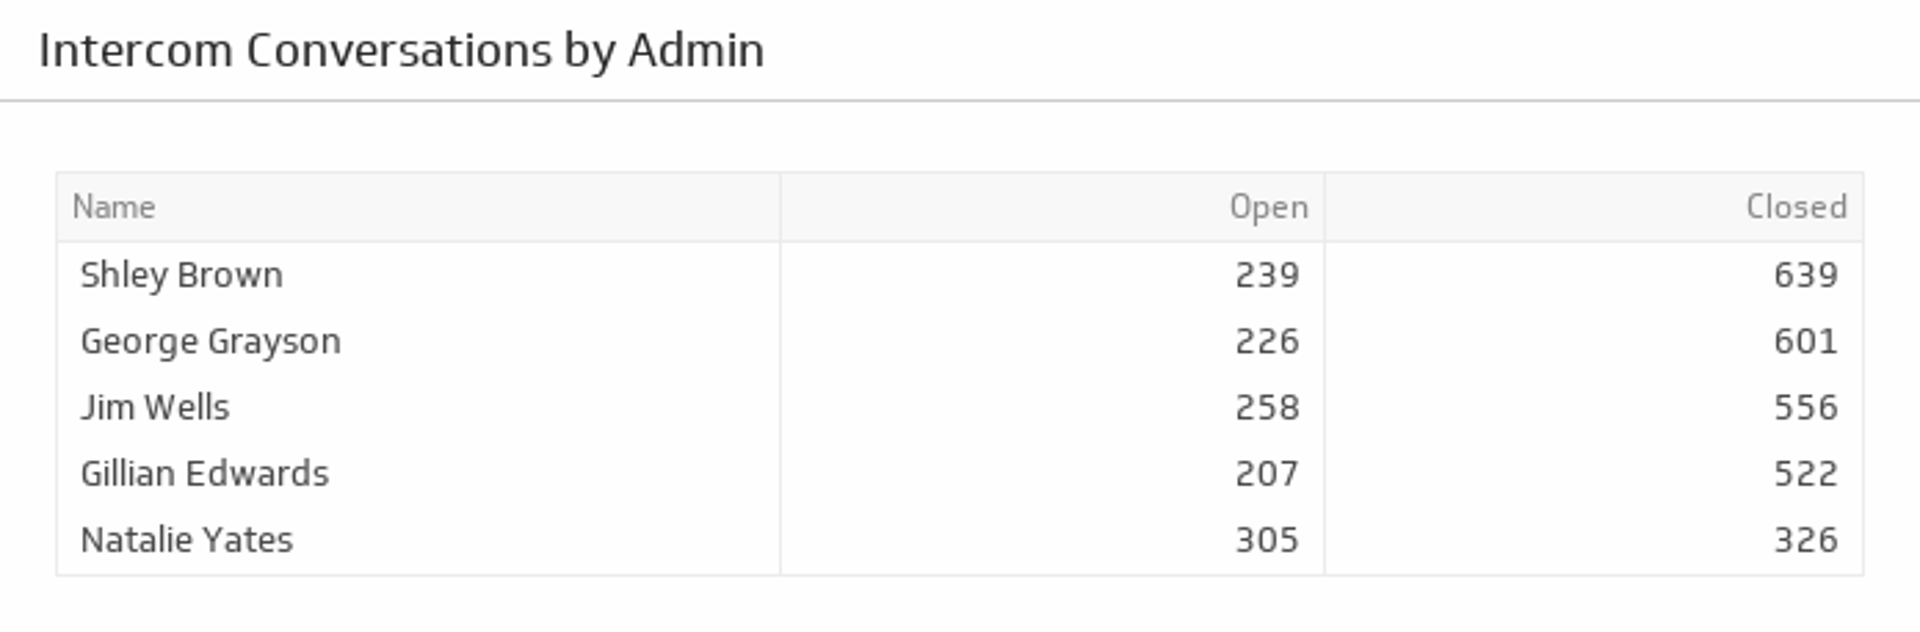
Conversations by Admin
Get a total count of open and closed conversations for each of your Admins.
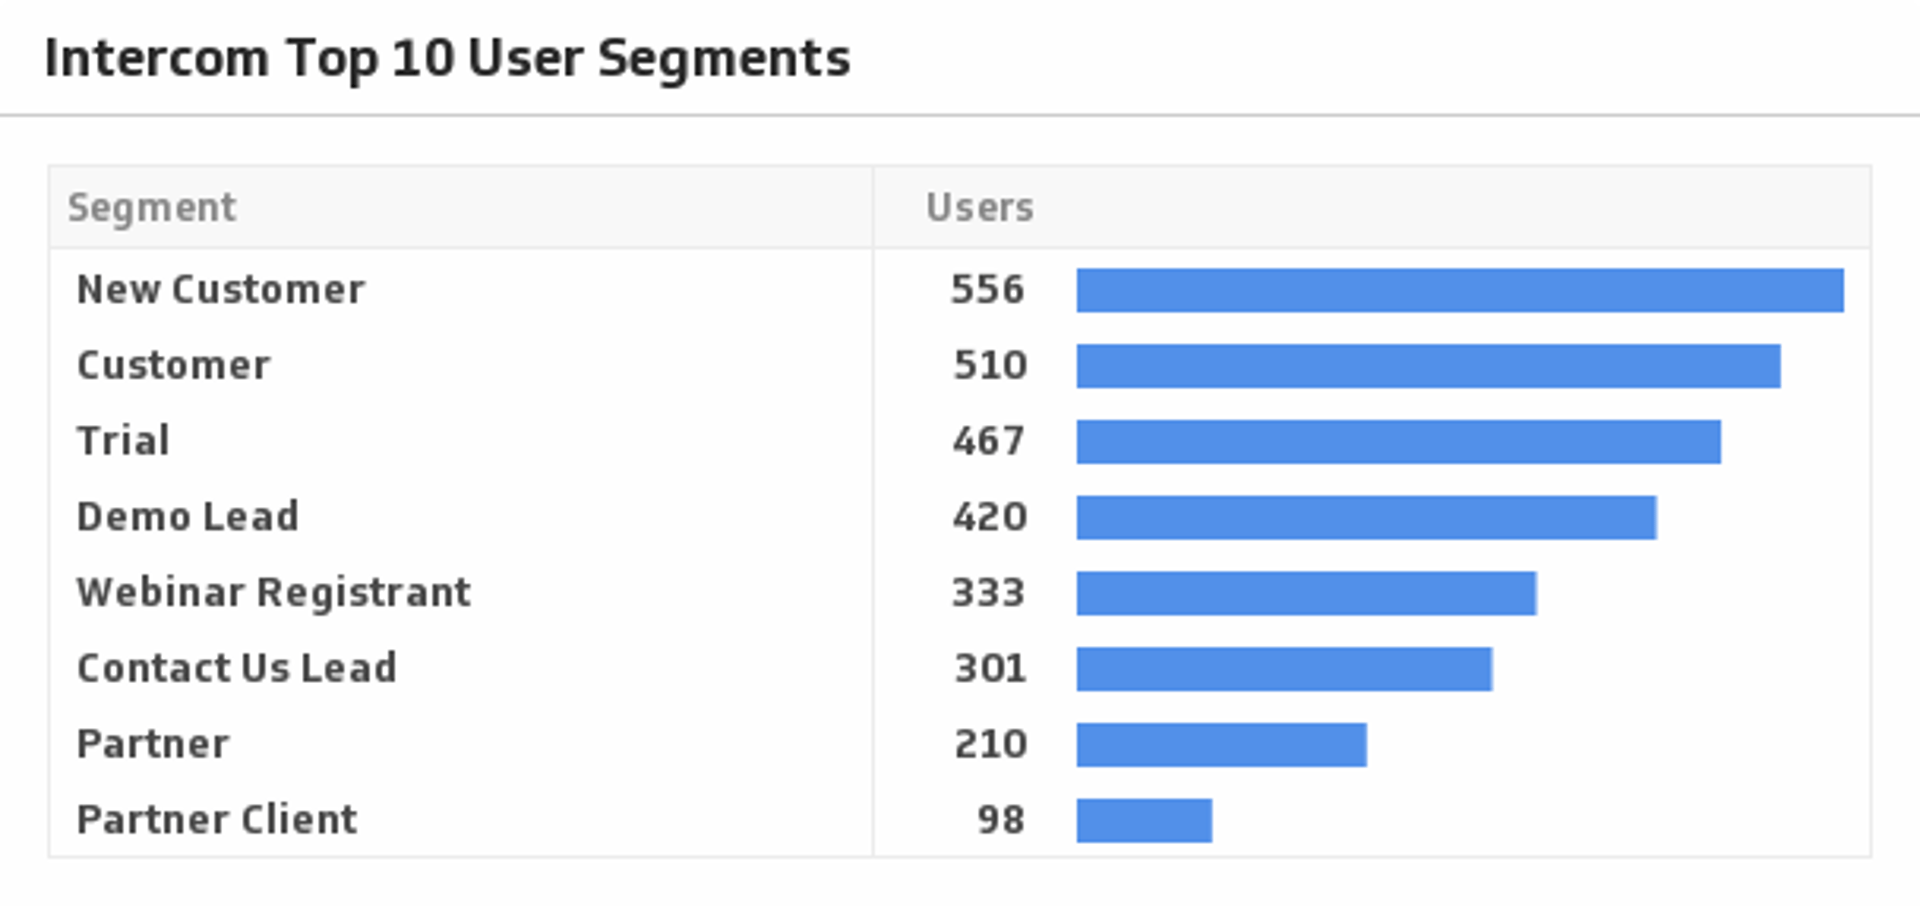
Top 10 User Segments
Show your top 10 user segments and get real insight on how your product is being used.
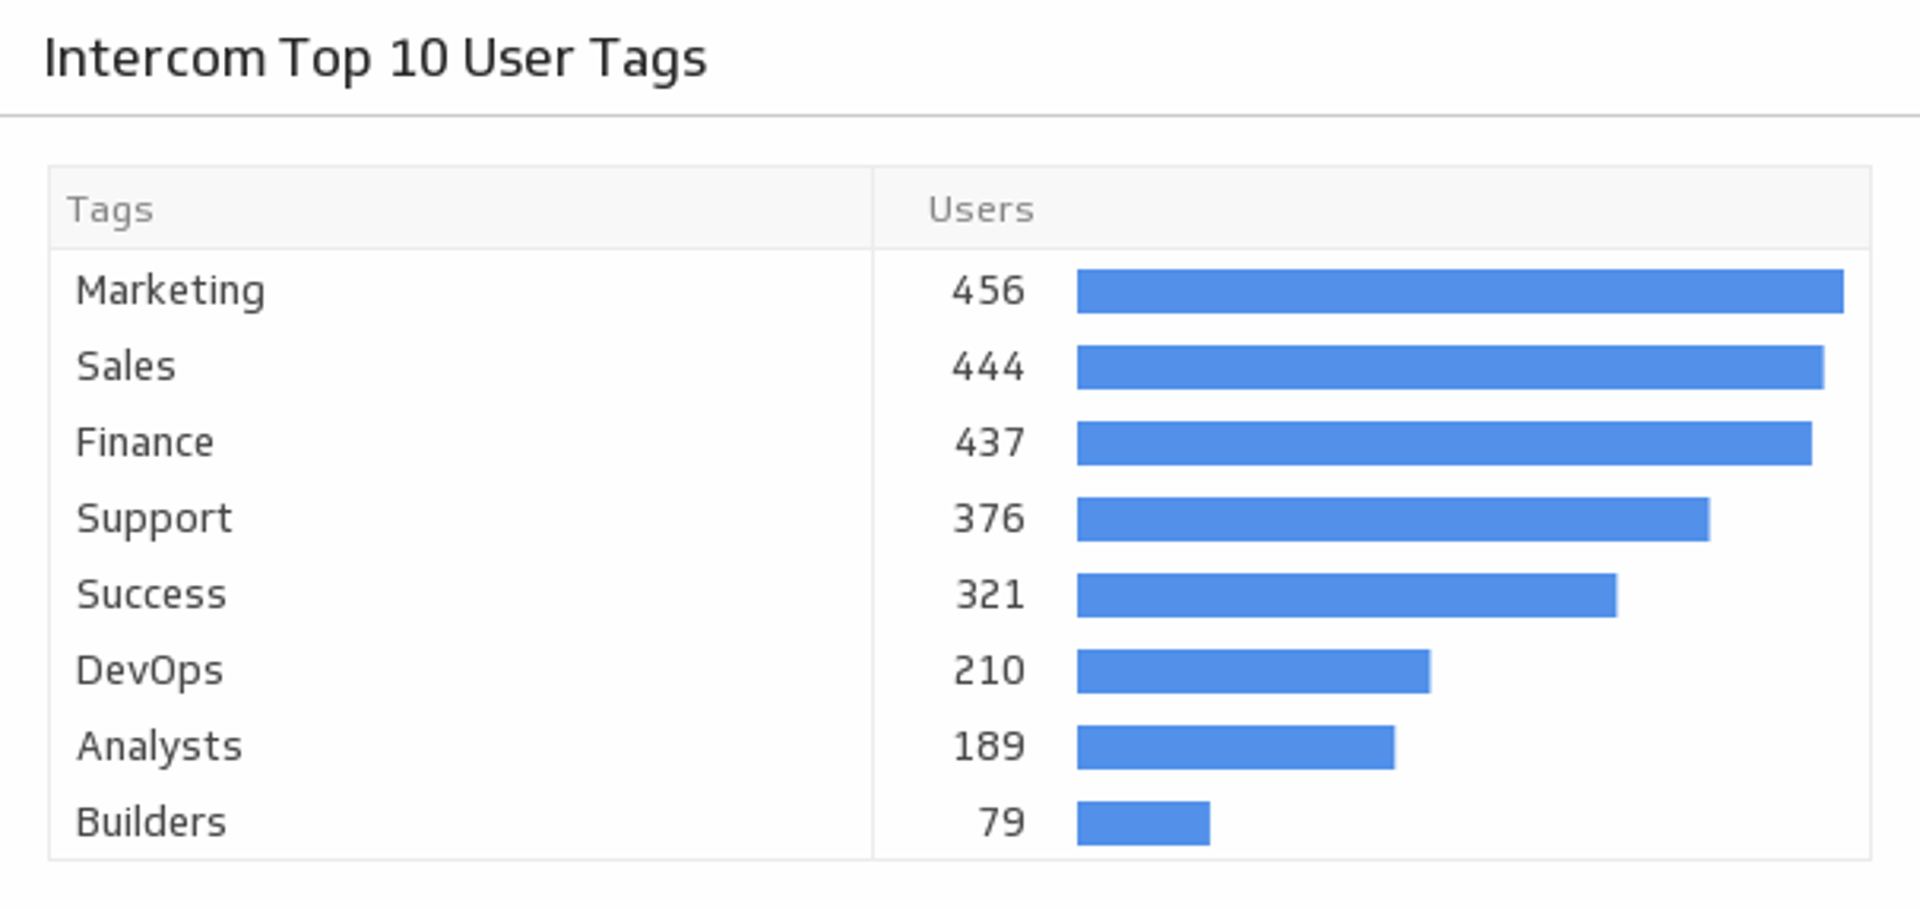
Top 10 User Tags
Monitor your top 10 tags and see which user groups are the most popular.
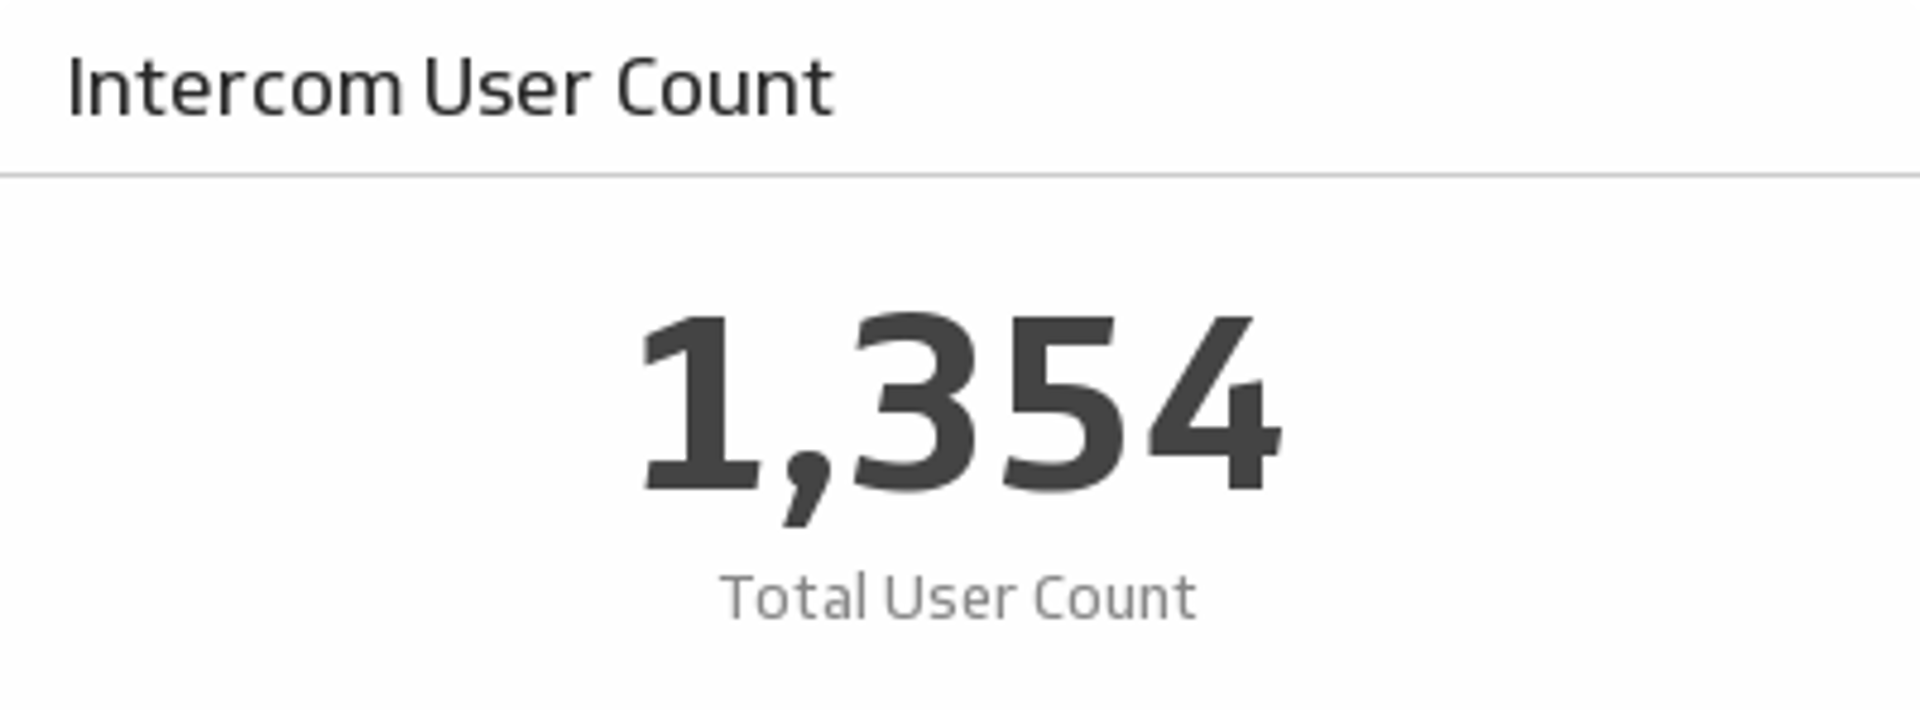
User Count
Monitor all of your platform's users on this simple yet powerful Klip.
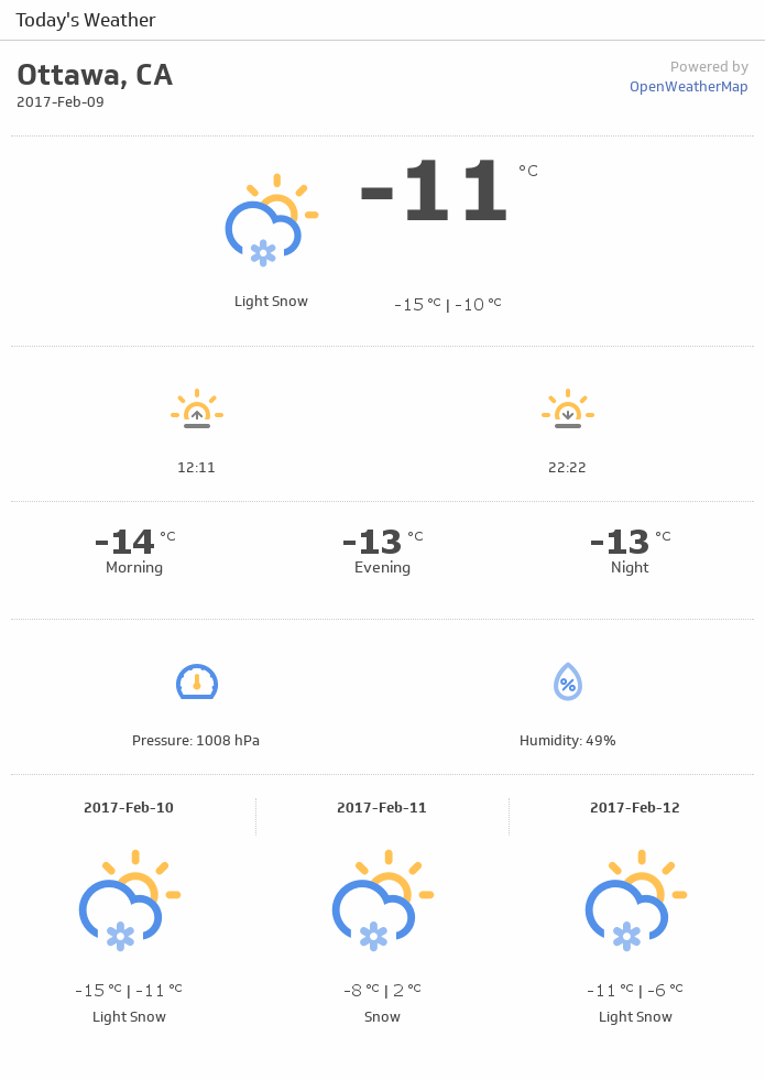
Today's Weather (Detailed)
Get all the details about today's weather forecast.

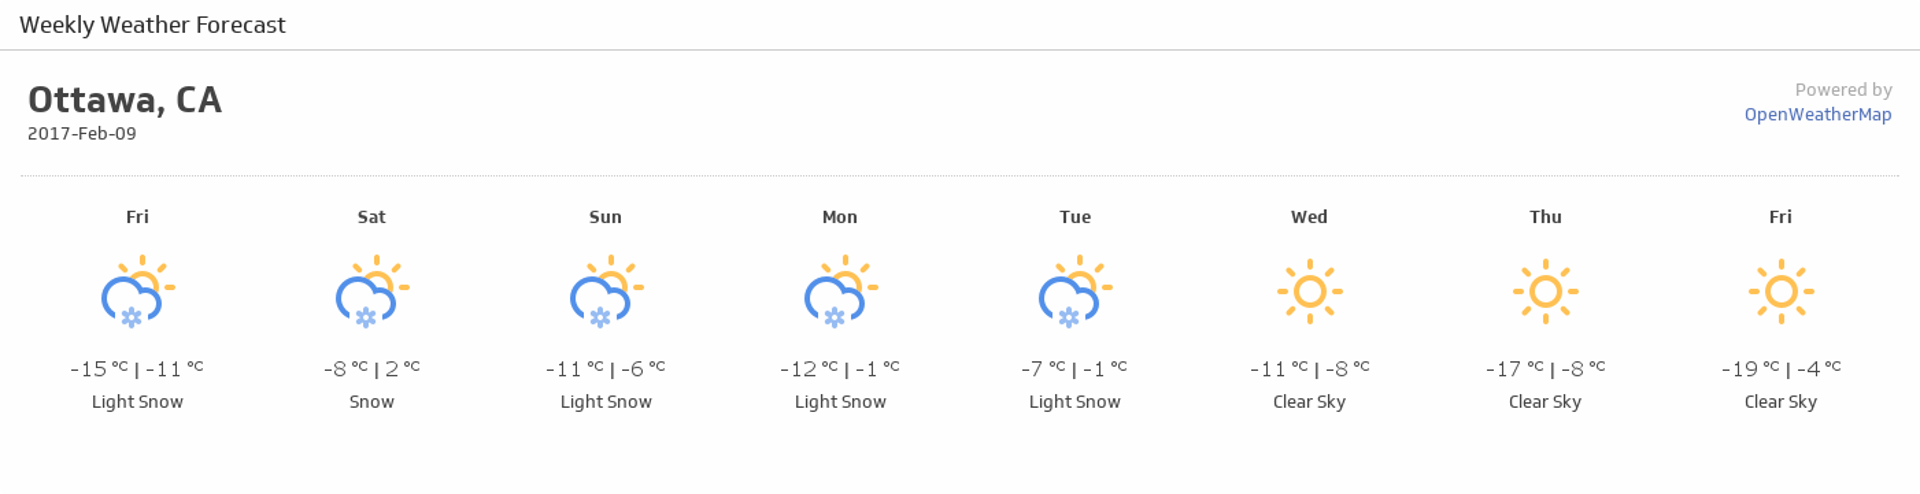
Weekly Weather Forecast
Monitor this week's weather forecast and always know what to wear.
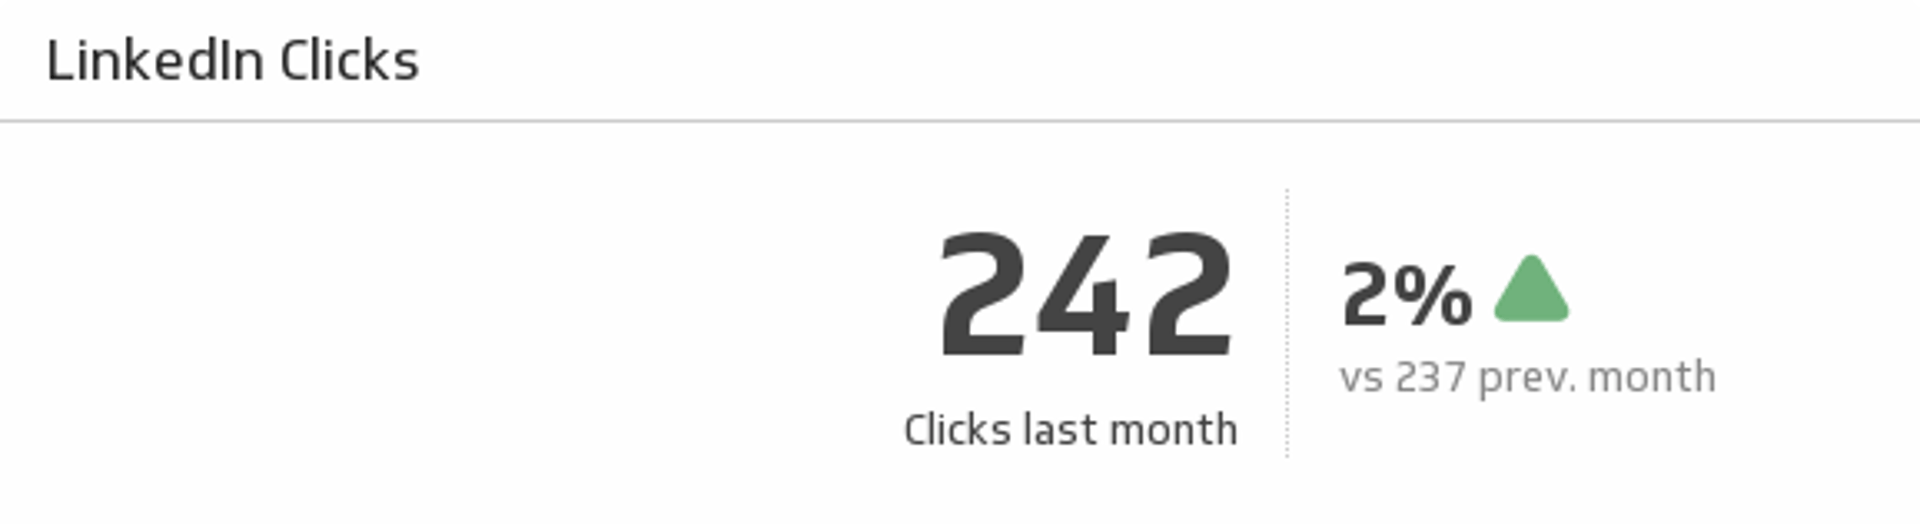
Clicks
Make sure your LinkedIn content continues to attract attention by comparing last month's page clicks with the previous month.
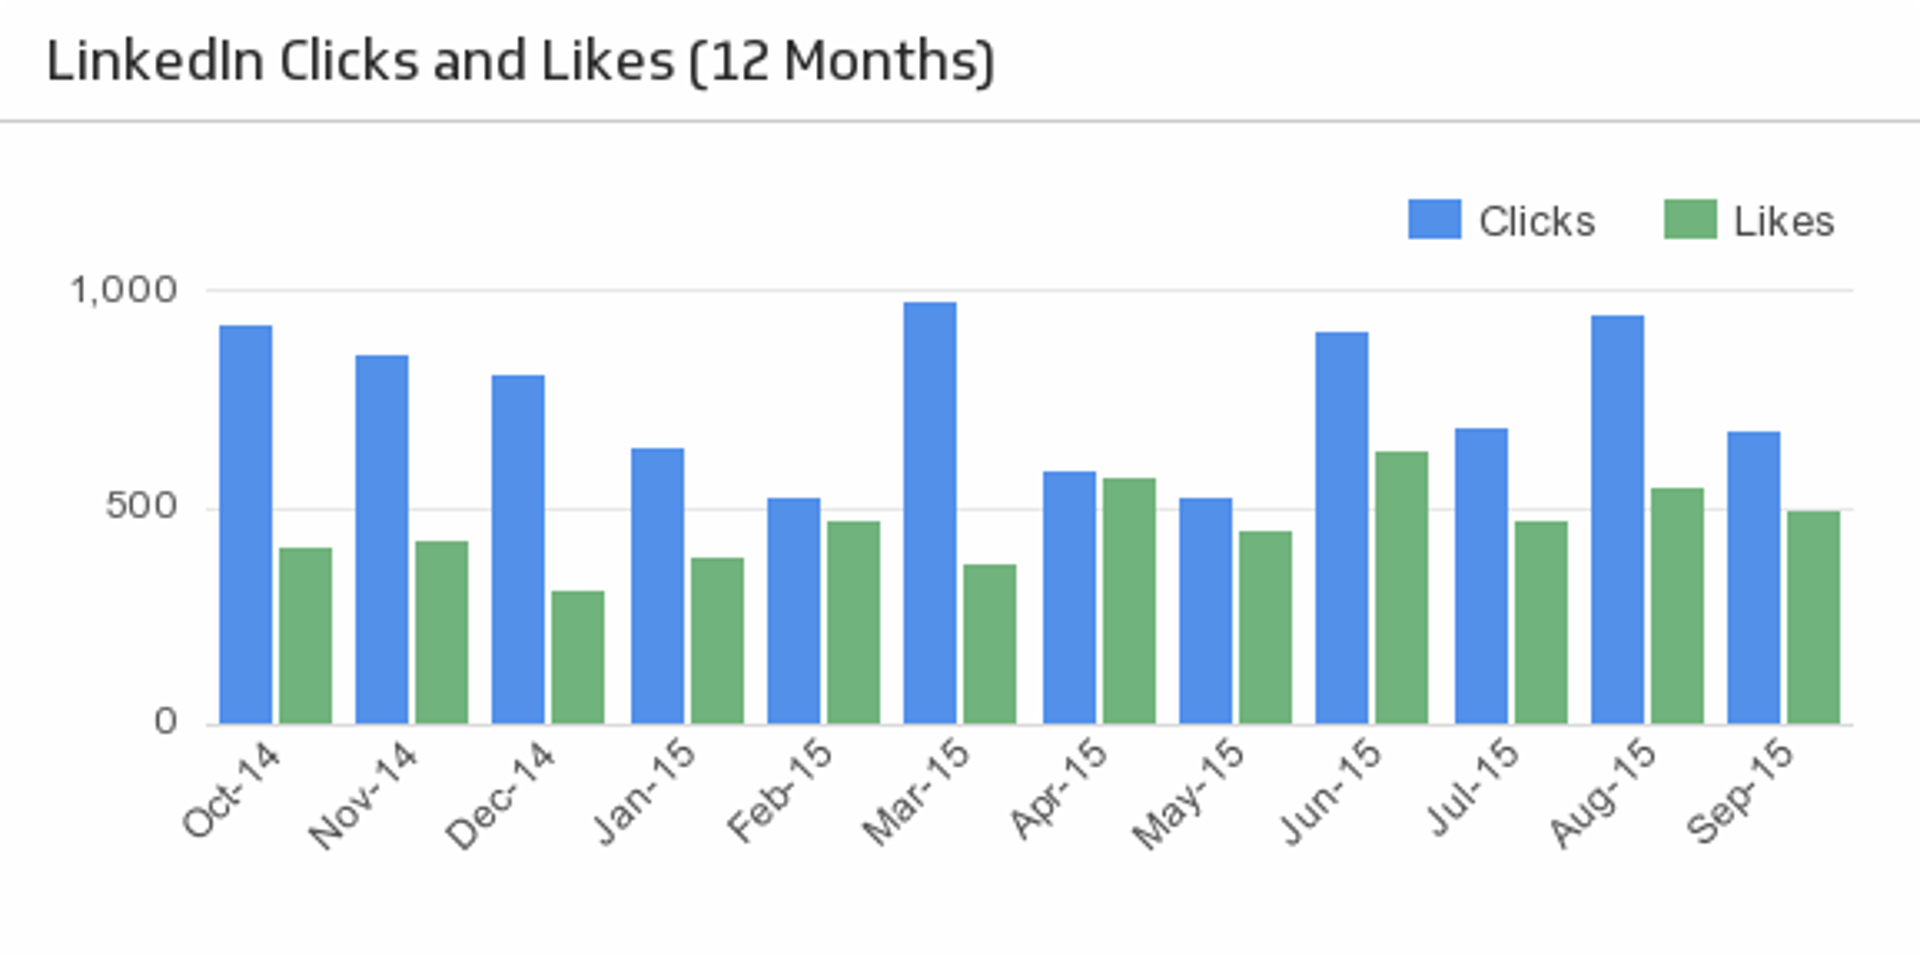
Clicks and Likes (12 Months)
See how your LinkedIn clicks and likes trend over time.
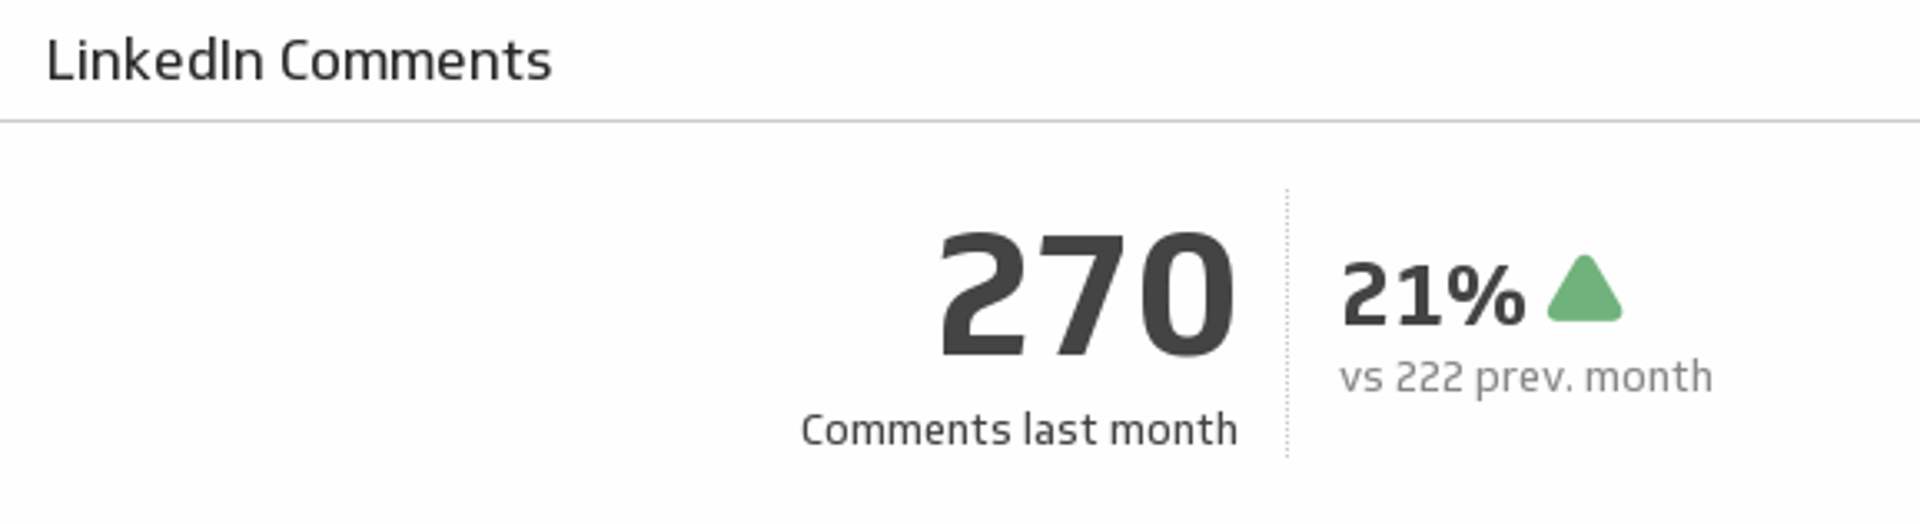
Comments
Keep your LinkedIn followers talking! Monitor your total comments last month and compare it to the previous month.
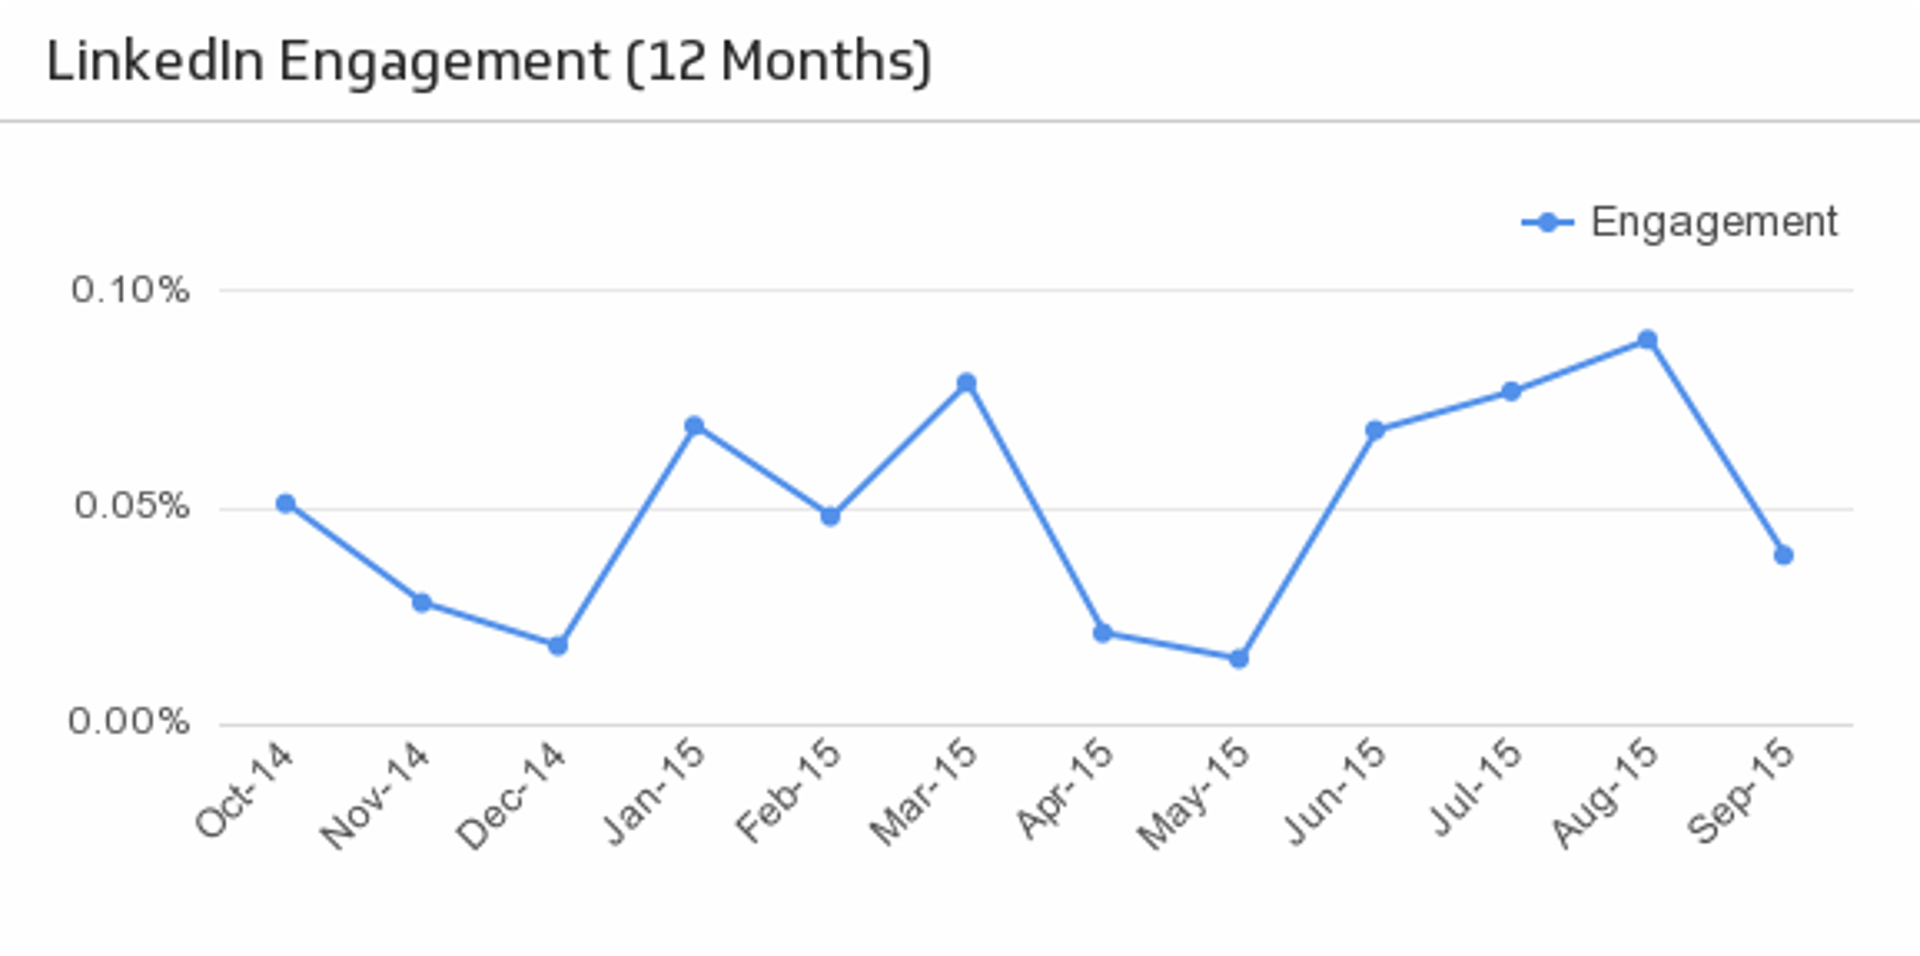
Engagement (Last 12 Months)
Discover important trends in your LinkedIn page engagement over the past 12 months.
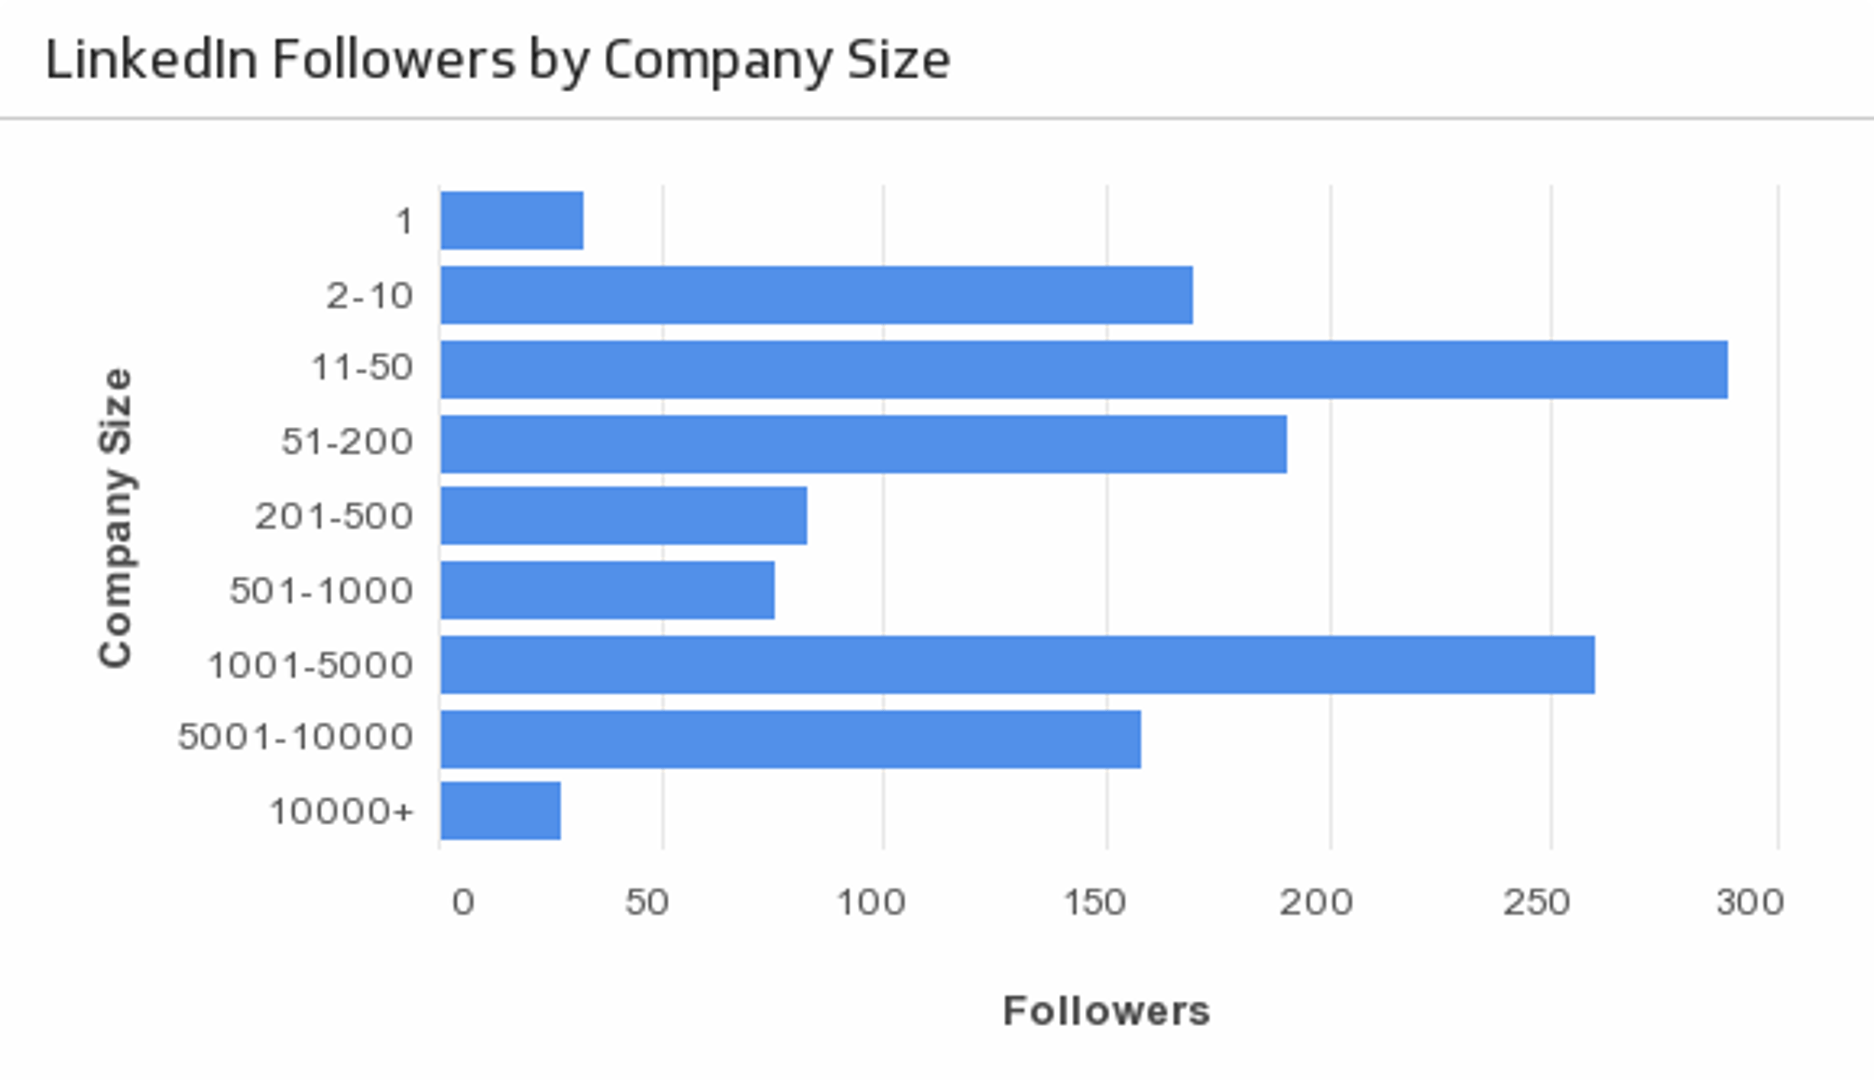
Followers by Company Size
Segment your LinkedIn followers by company size over the past 12 months.
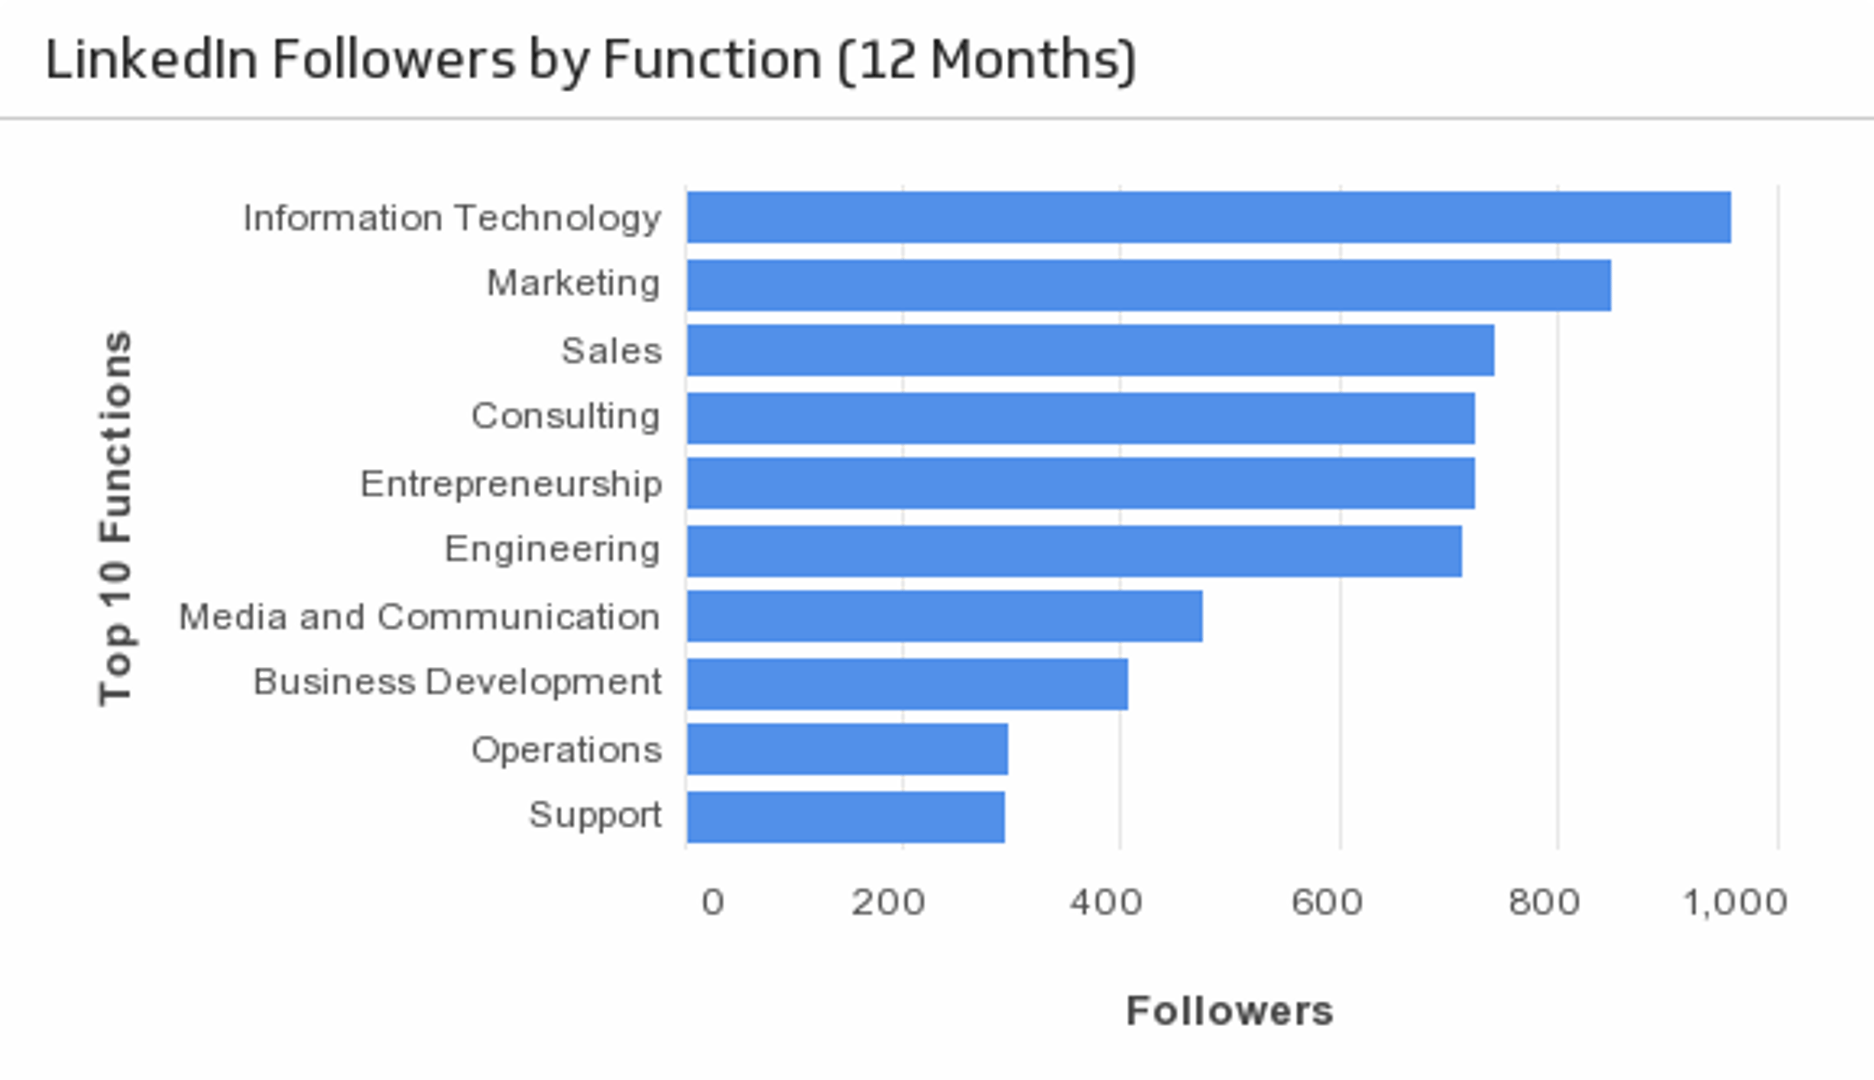
Followers by Function
See what role and function your LinkedIn followers have. (Past 12 months)
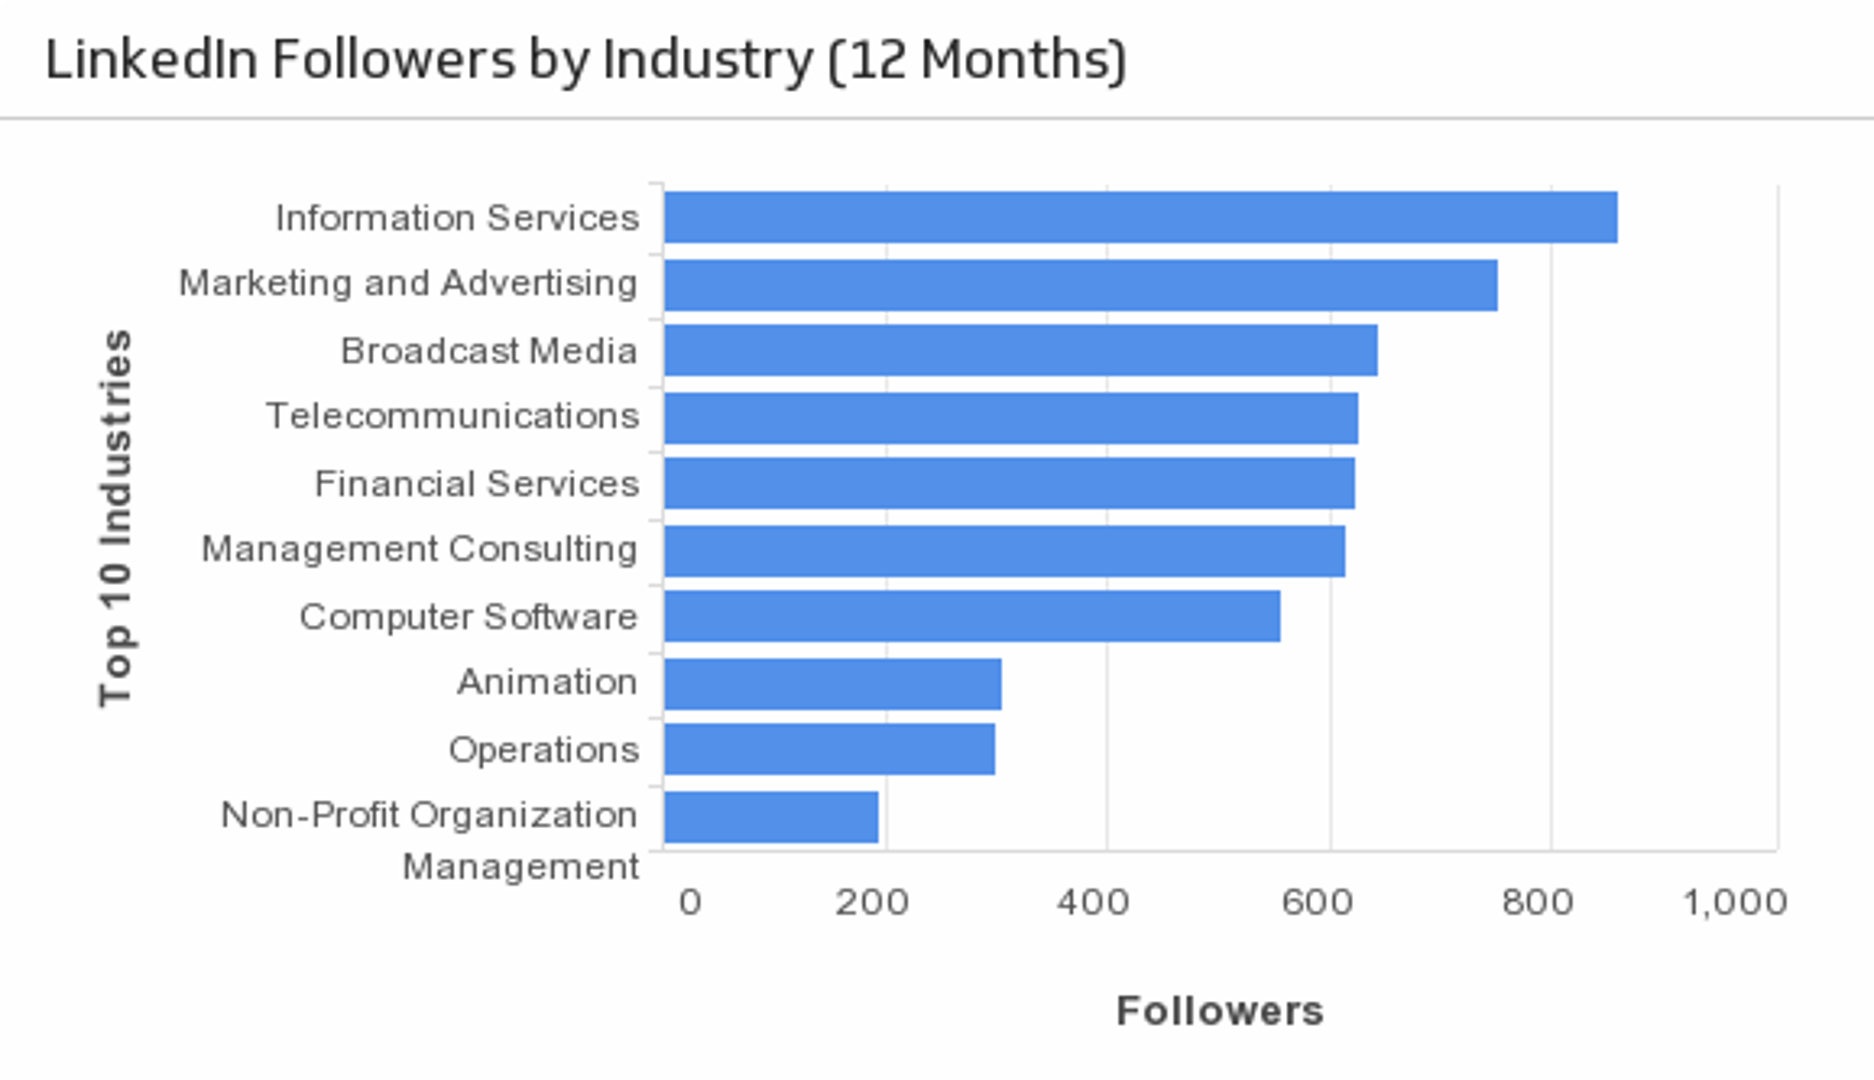
Followers by Industry
See what industries are dominant amongst your LinkedIn followers. (Past 12 months)
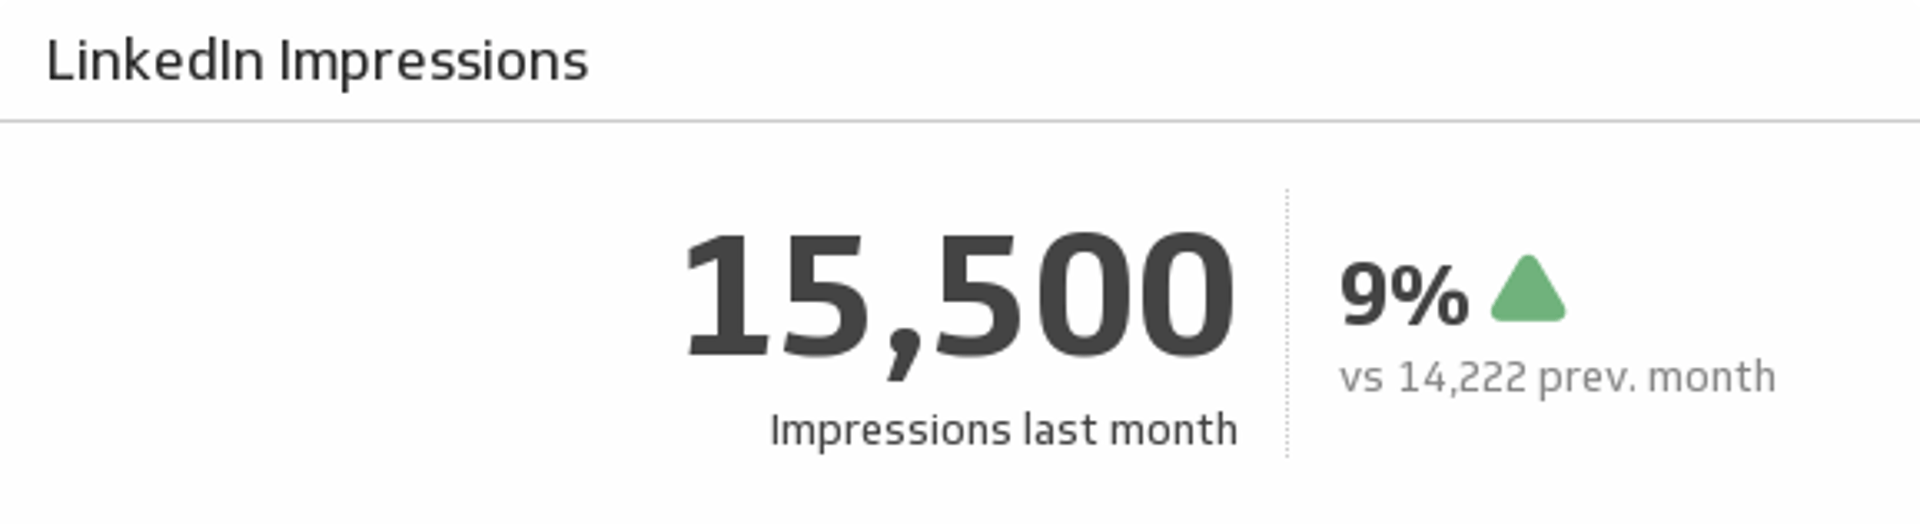
Impressions
Track your LinkedIn page impressions for last month and understand how it compares to the previous month.
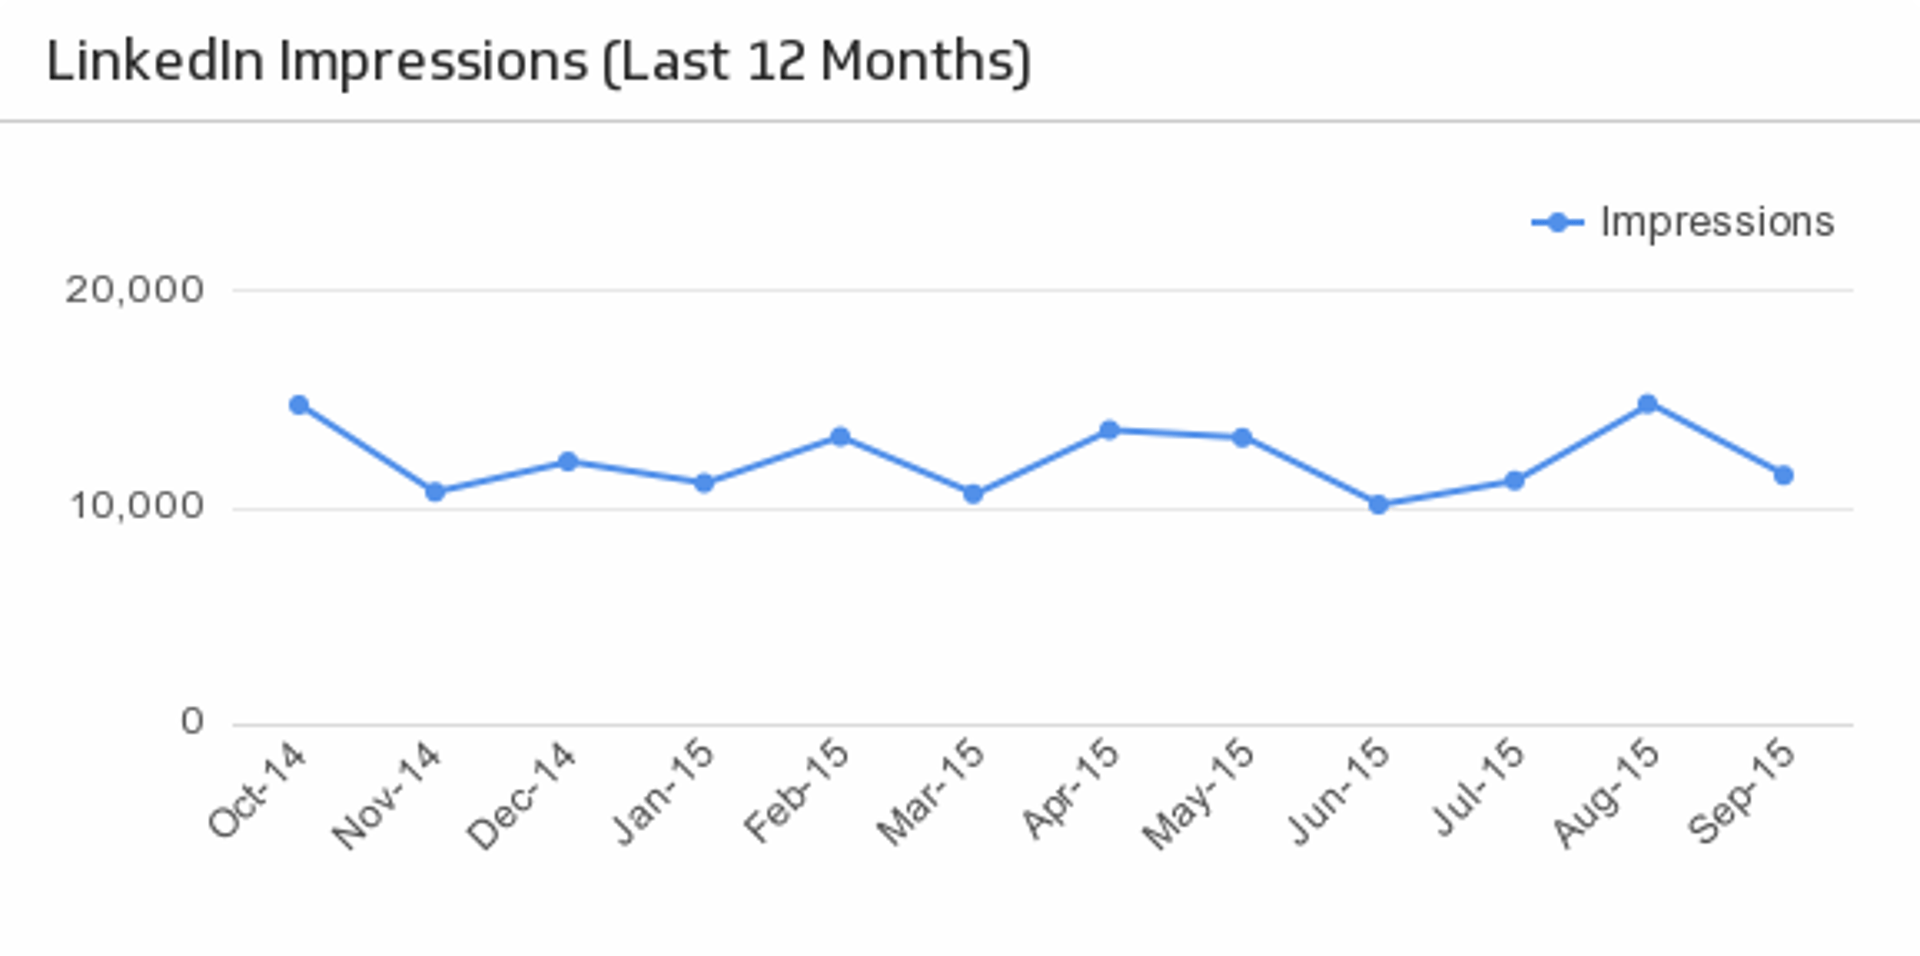
Impressions (Last 12 Months)
Reveal how your LinkedIn impressions trend over time.
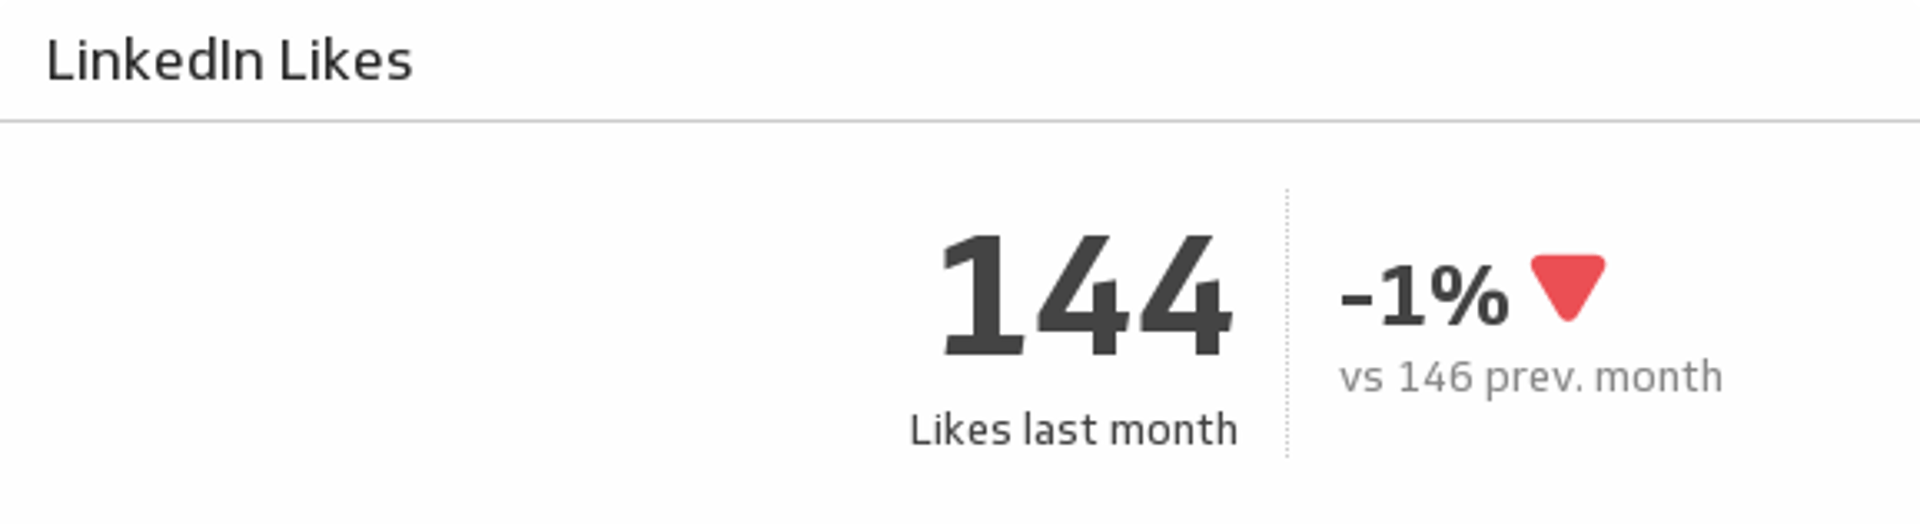
Likes
Showcase the number of likes your LinkedIn page got at the end of last month and understand how it compares to the previous month.
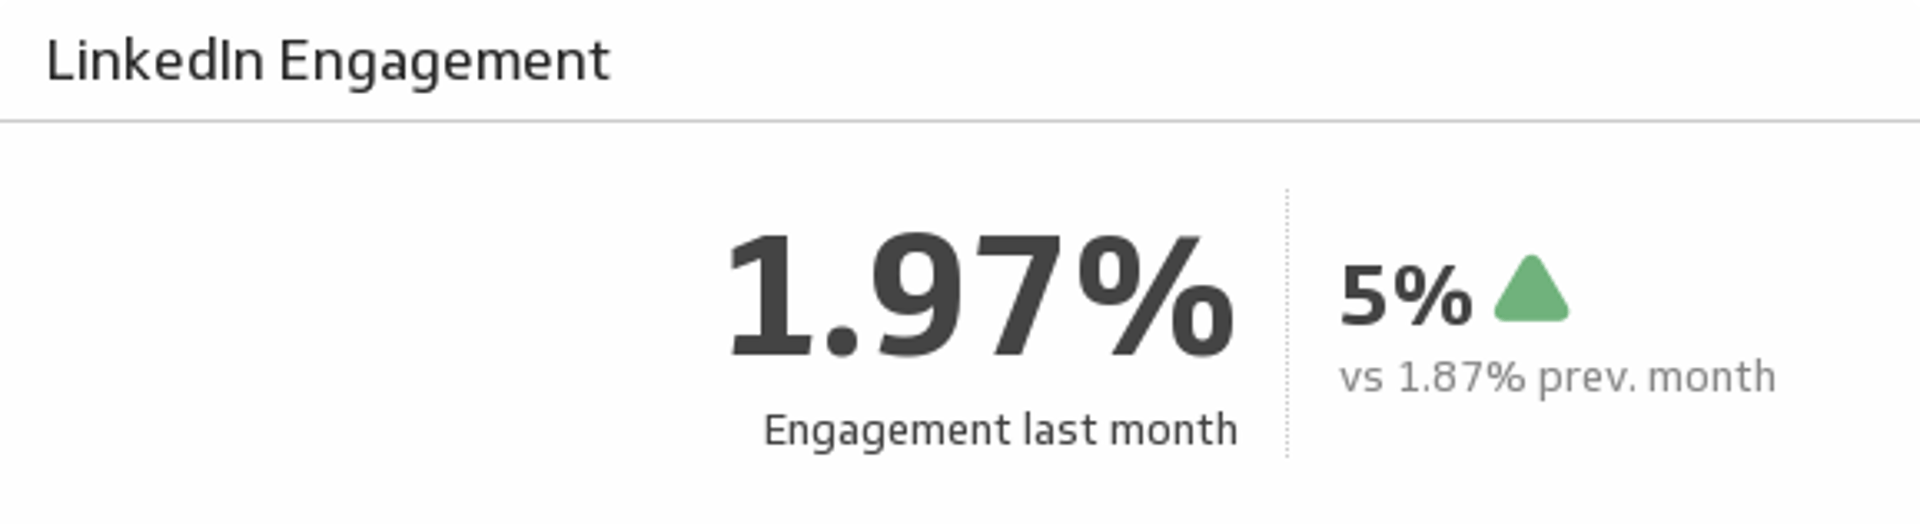
LinkedIn Engagement
From comments to shares, Engagement measures how people react to your updates. See your LinkedIn page engagement for last month and see how it compares to the previous month.
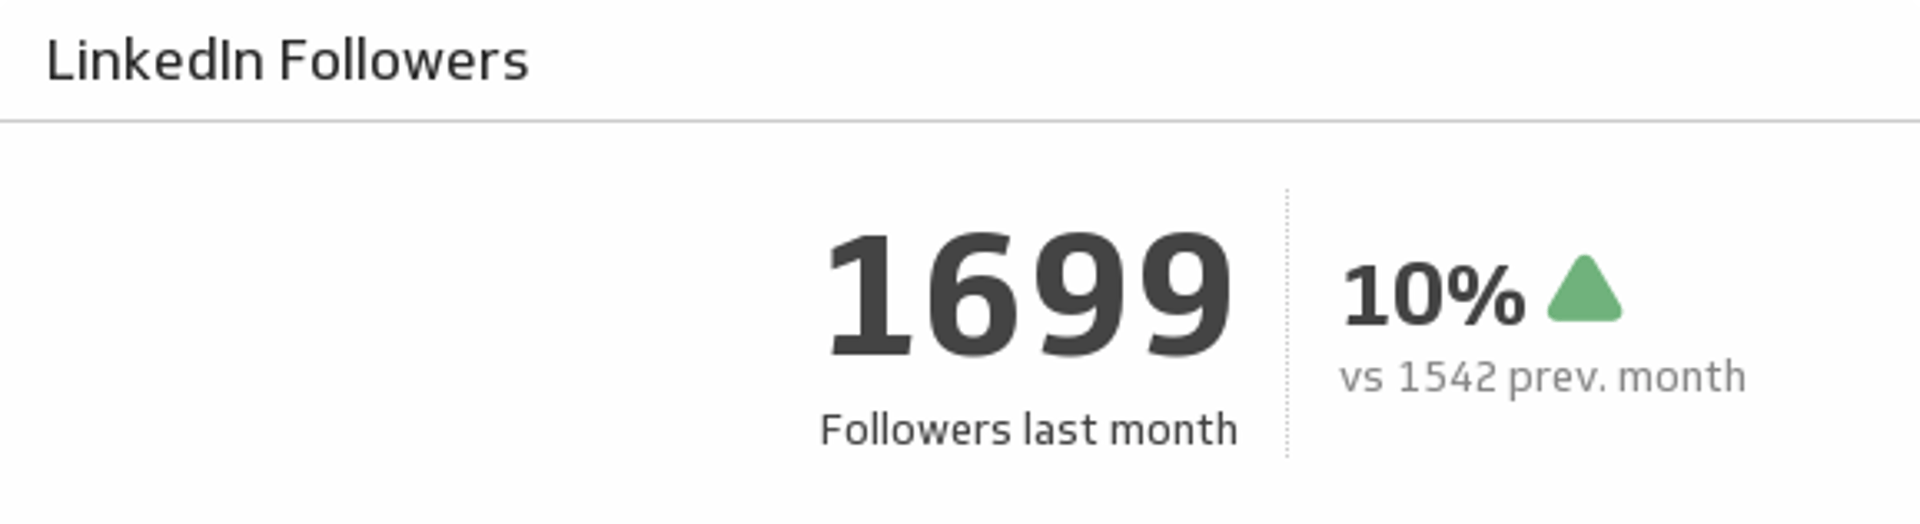
LinkedIn Followers
See how many LinkedIn followers you had last month and compare it to the previous month.
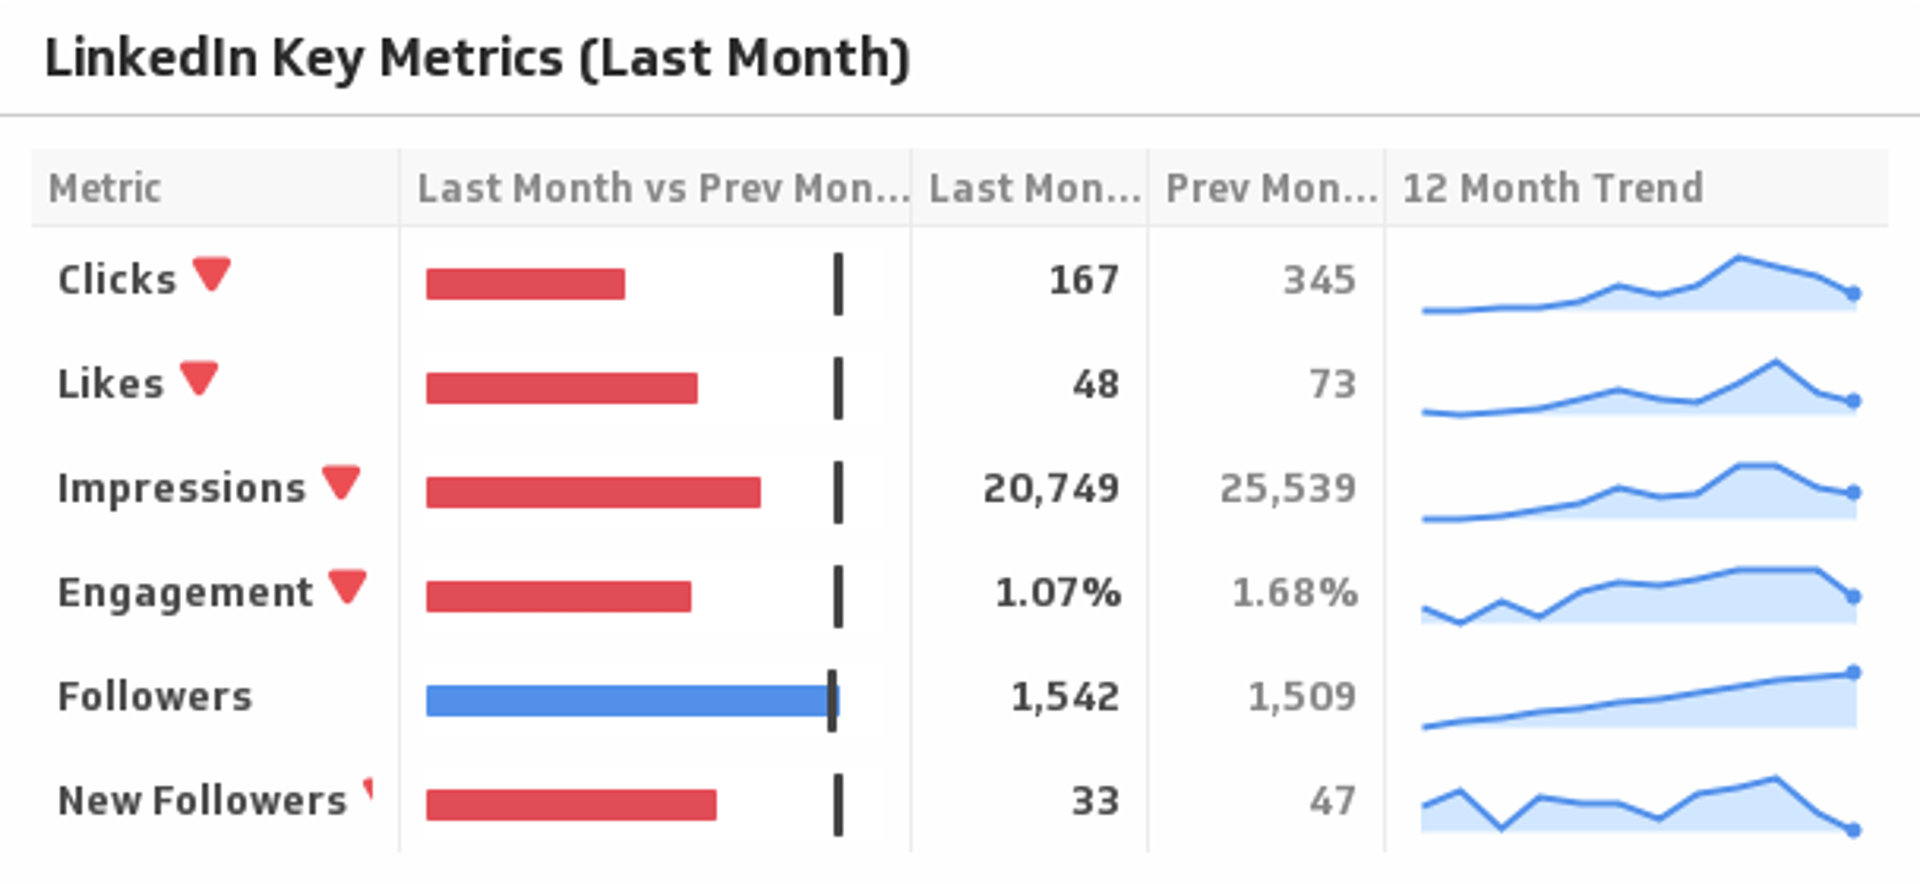
LinkedIn Key Metrics
Use this sophisticated Klip to compare your key LinkedIn metrics last month to the previous month, and display the trends over time.
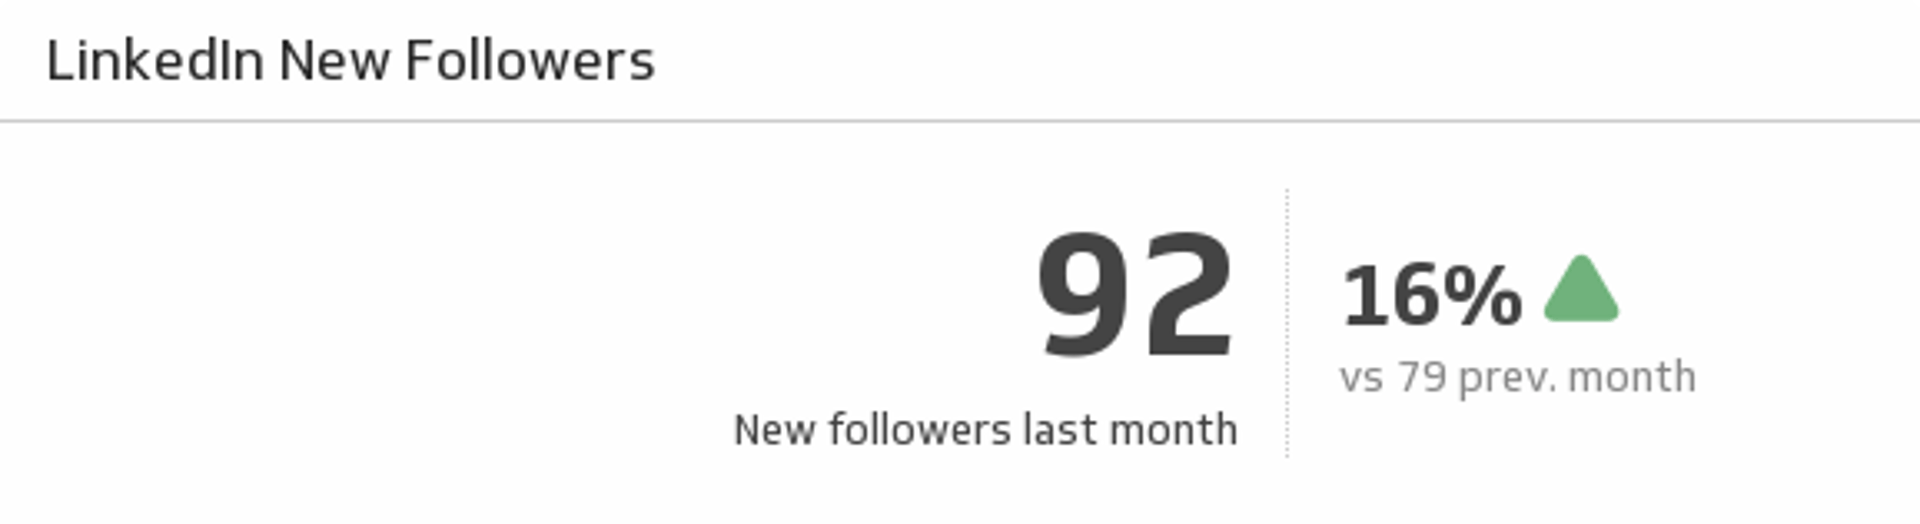
New Followers
See how many new followers your LinkedIn page gained at the end of last month and understand how it compares to the previous month.
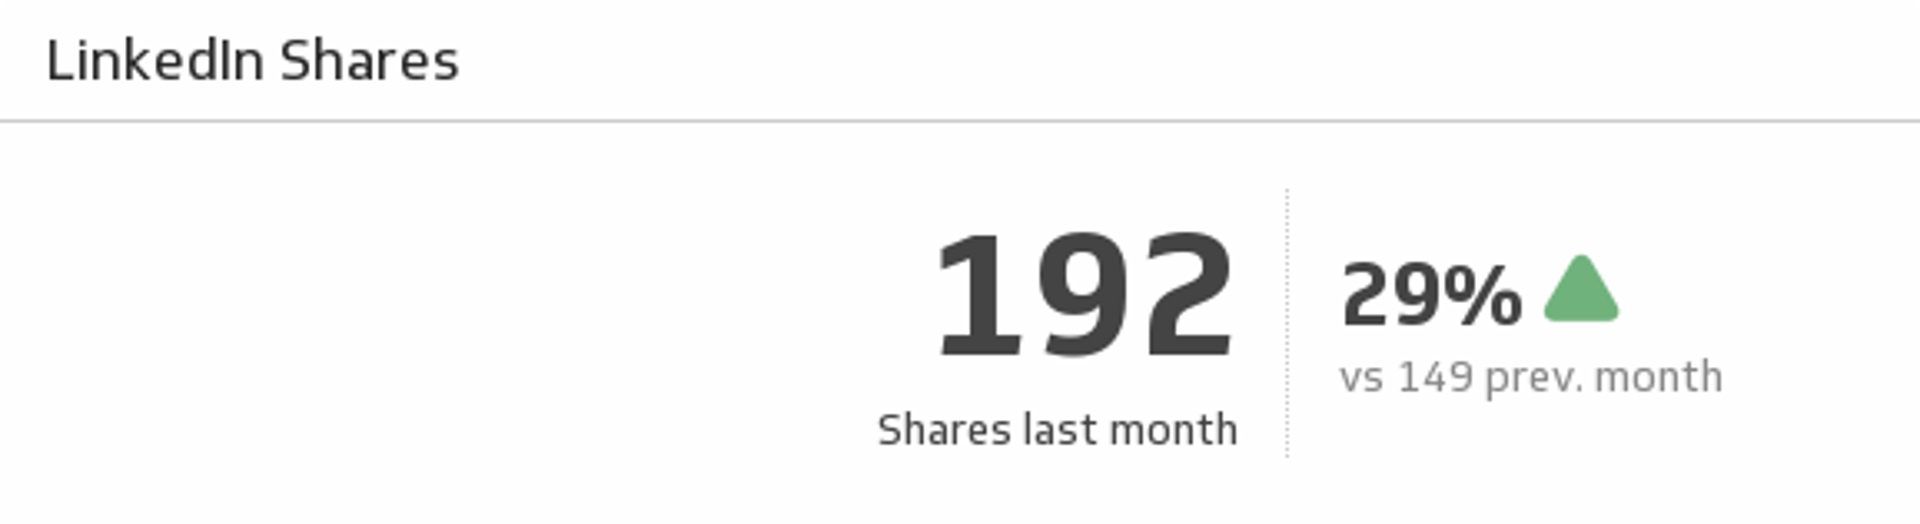
Shares
Determine your success in creating viral updates. See how many shares your page had at the end of last month and compare it to the previous month.
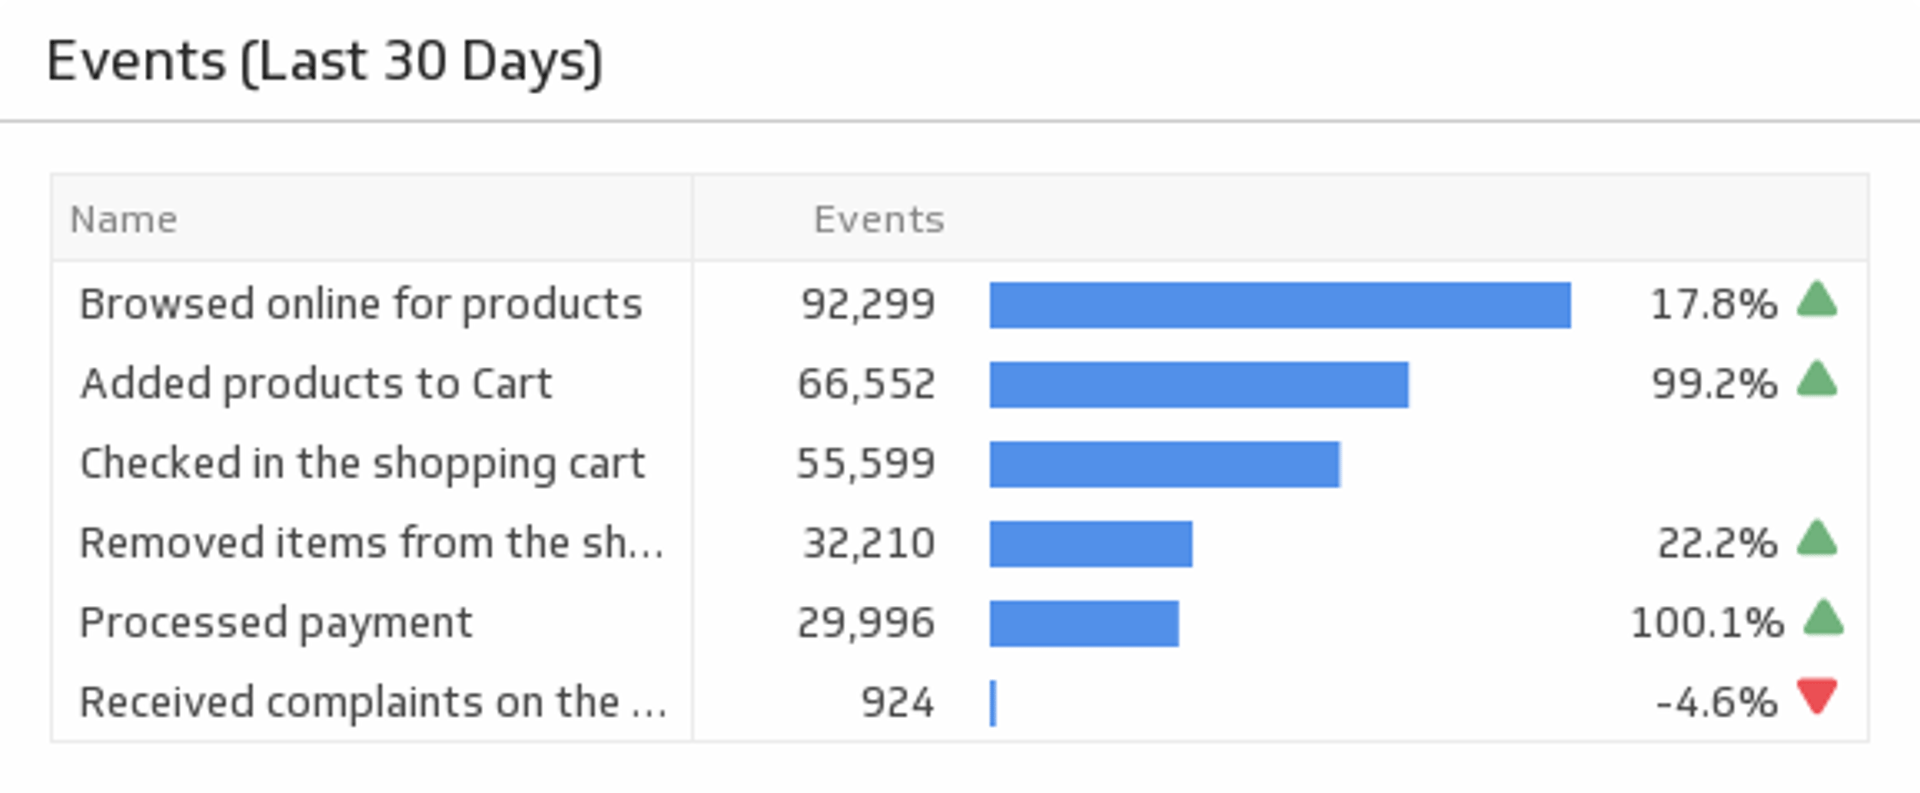
Events (Last 30 Days)
Track the number of times your users triggered an event over the past 30 days.
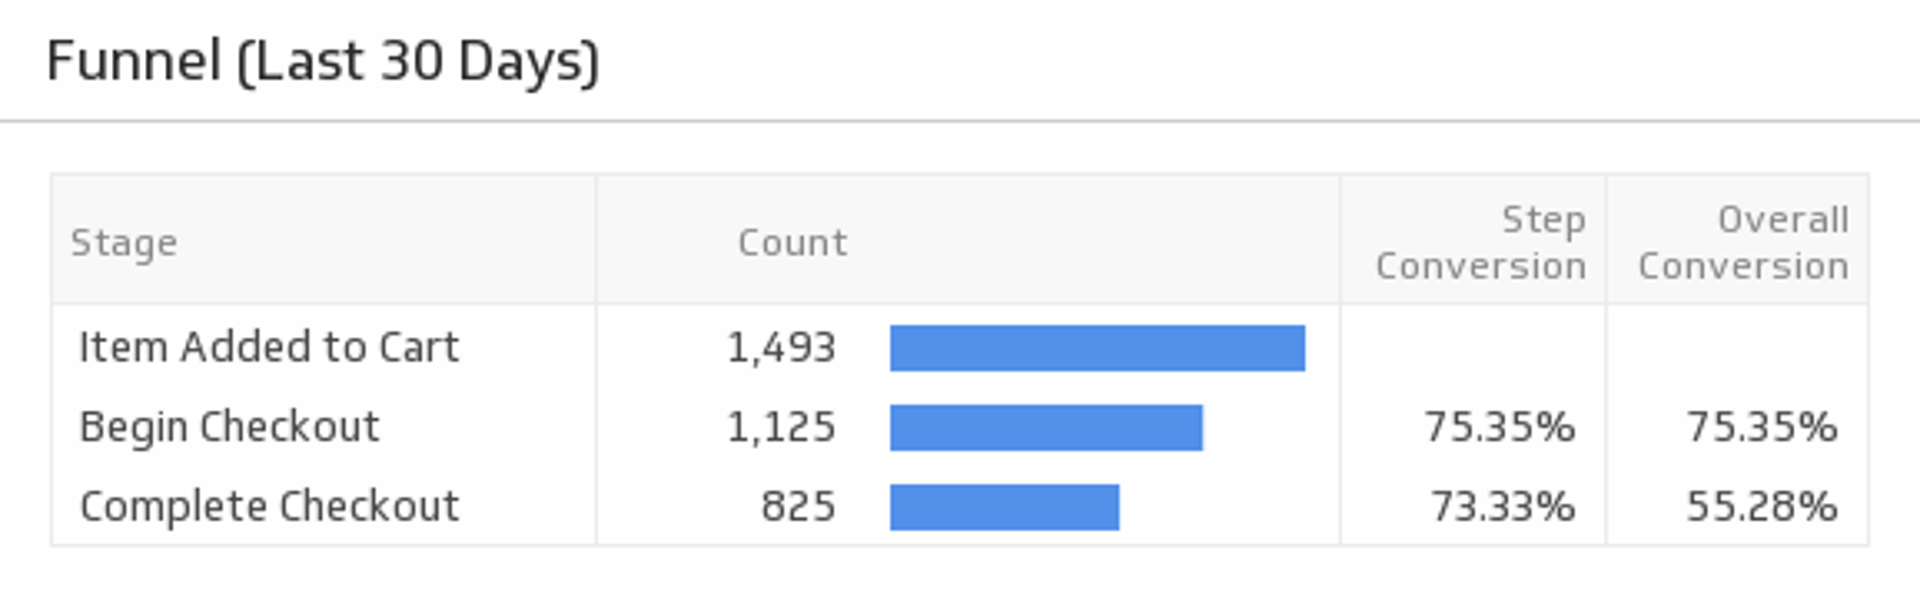
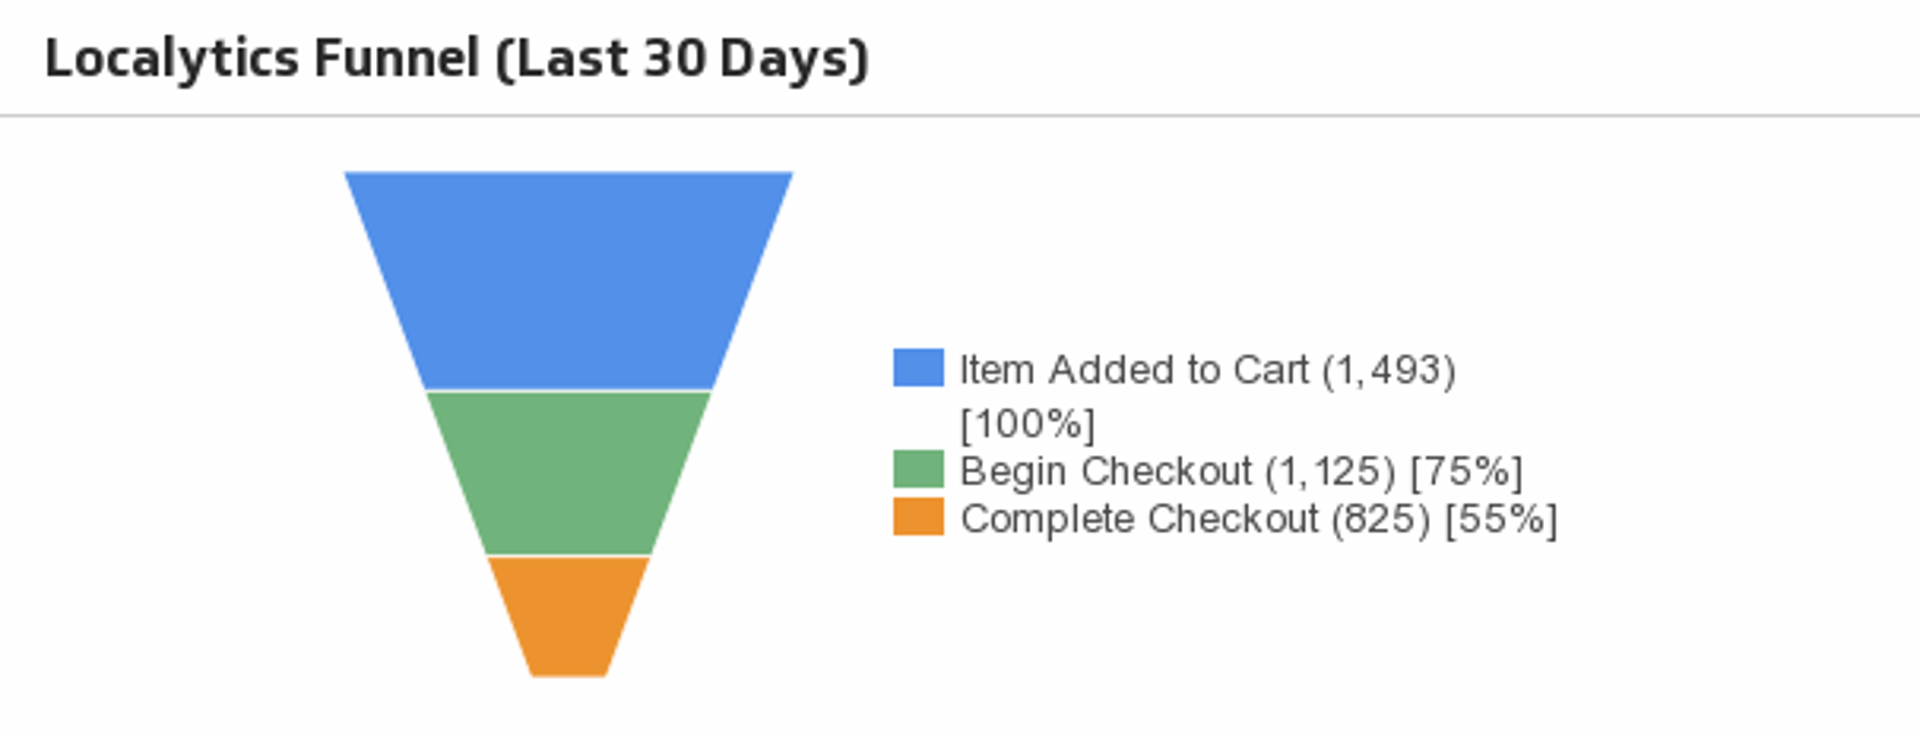
Funnel (Last 30 Days)
Use this Localytics funnel to understand the flow of user activity.
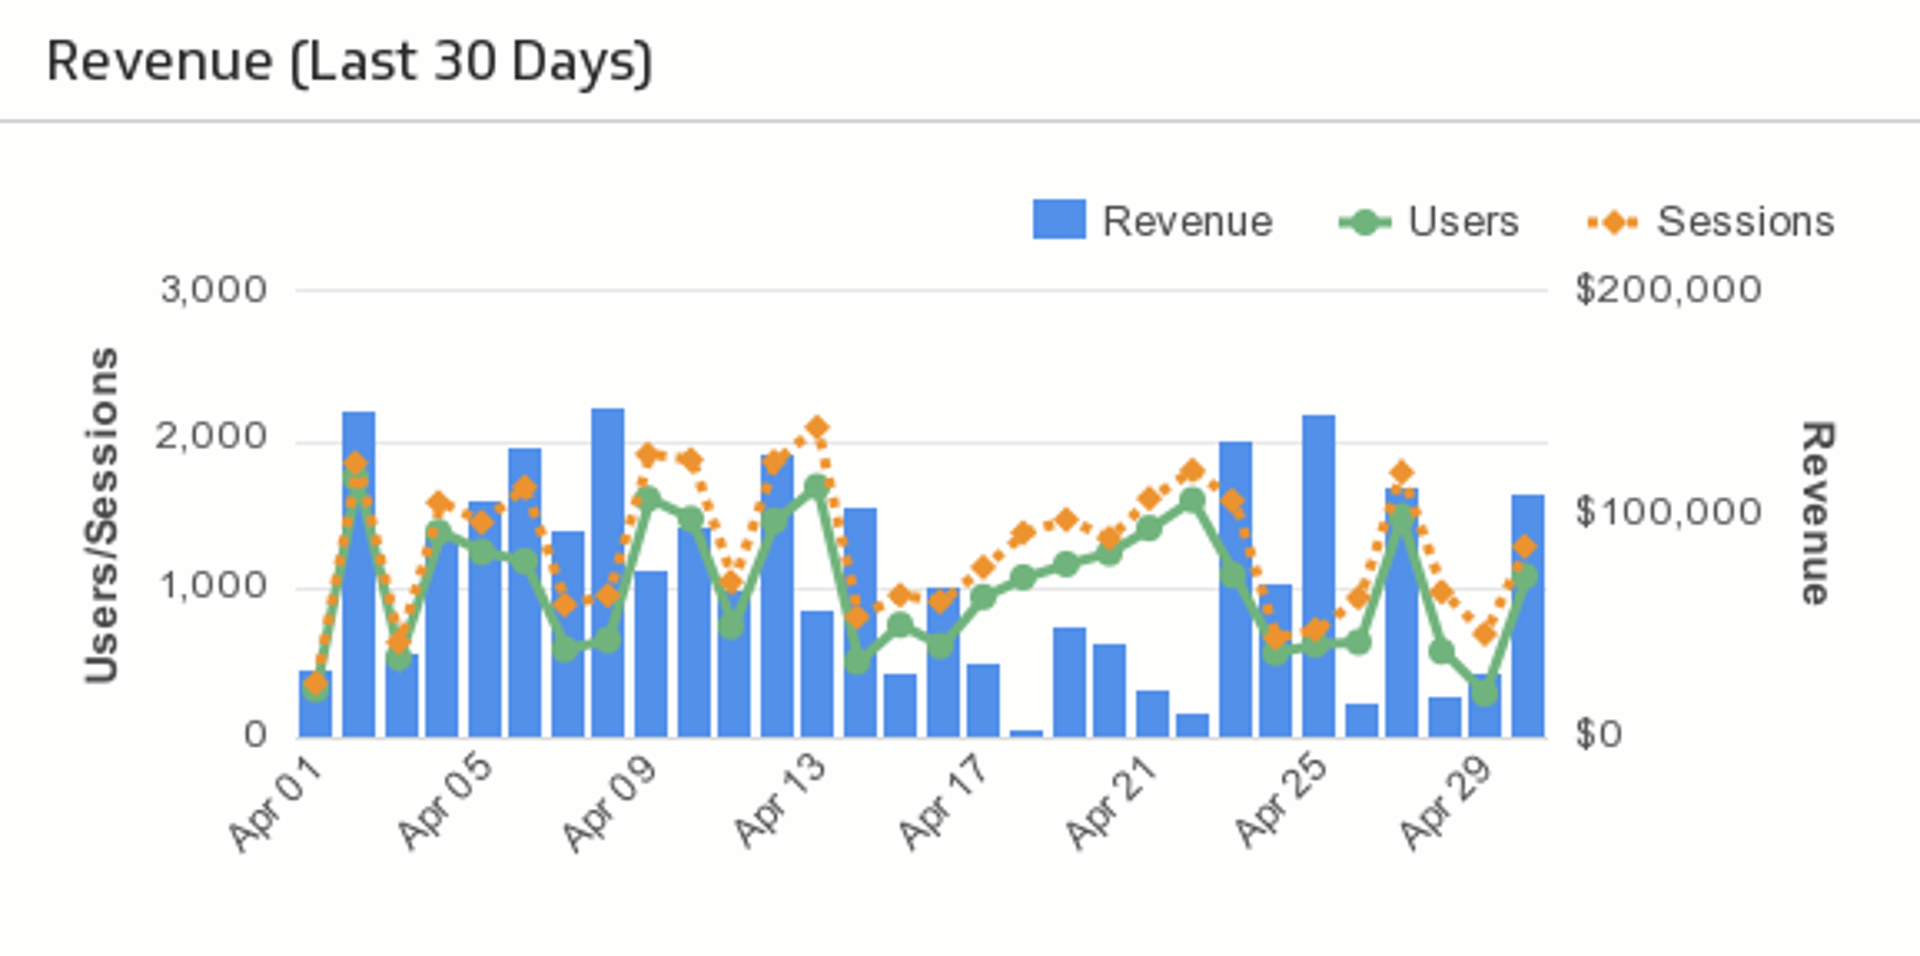
Revenue
Compare your revenue to the number of users and sessions on your app.
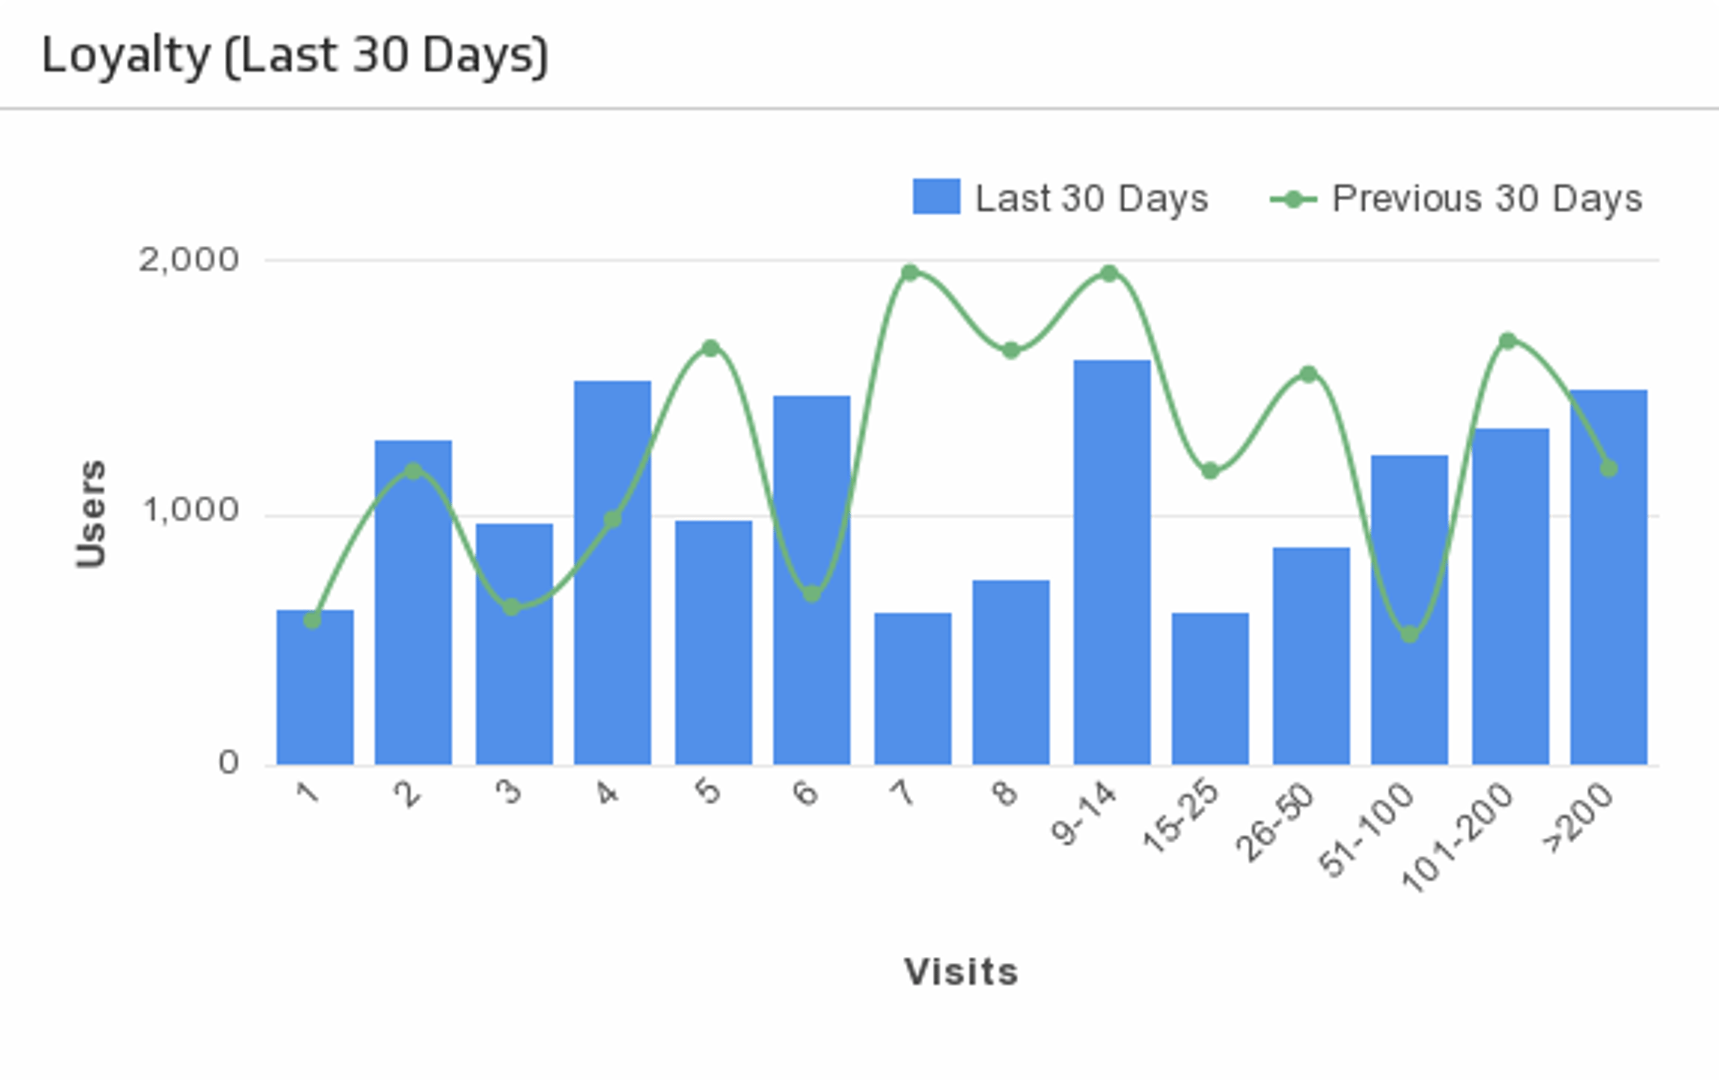
Loyalty (Last 30 Days)
Monitor the loyalty of your website visitors by tracking the number of repeat visits.
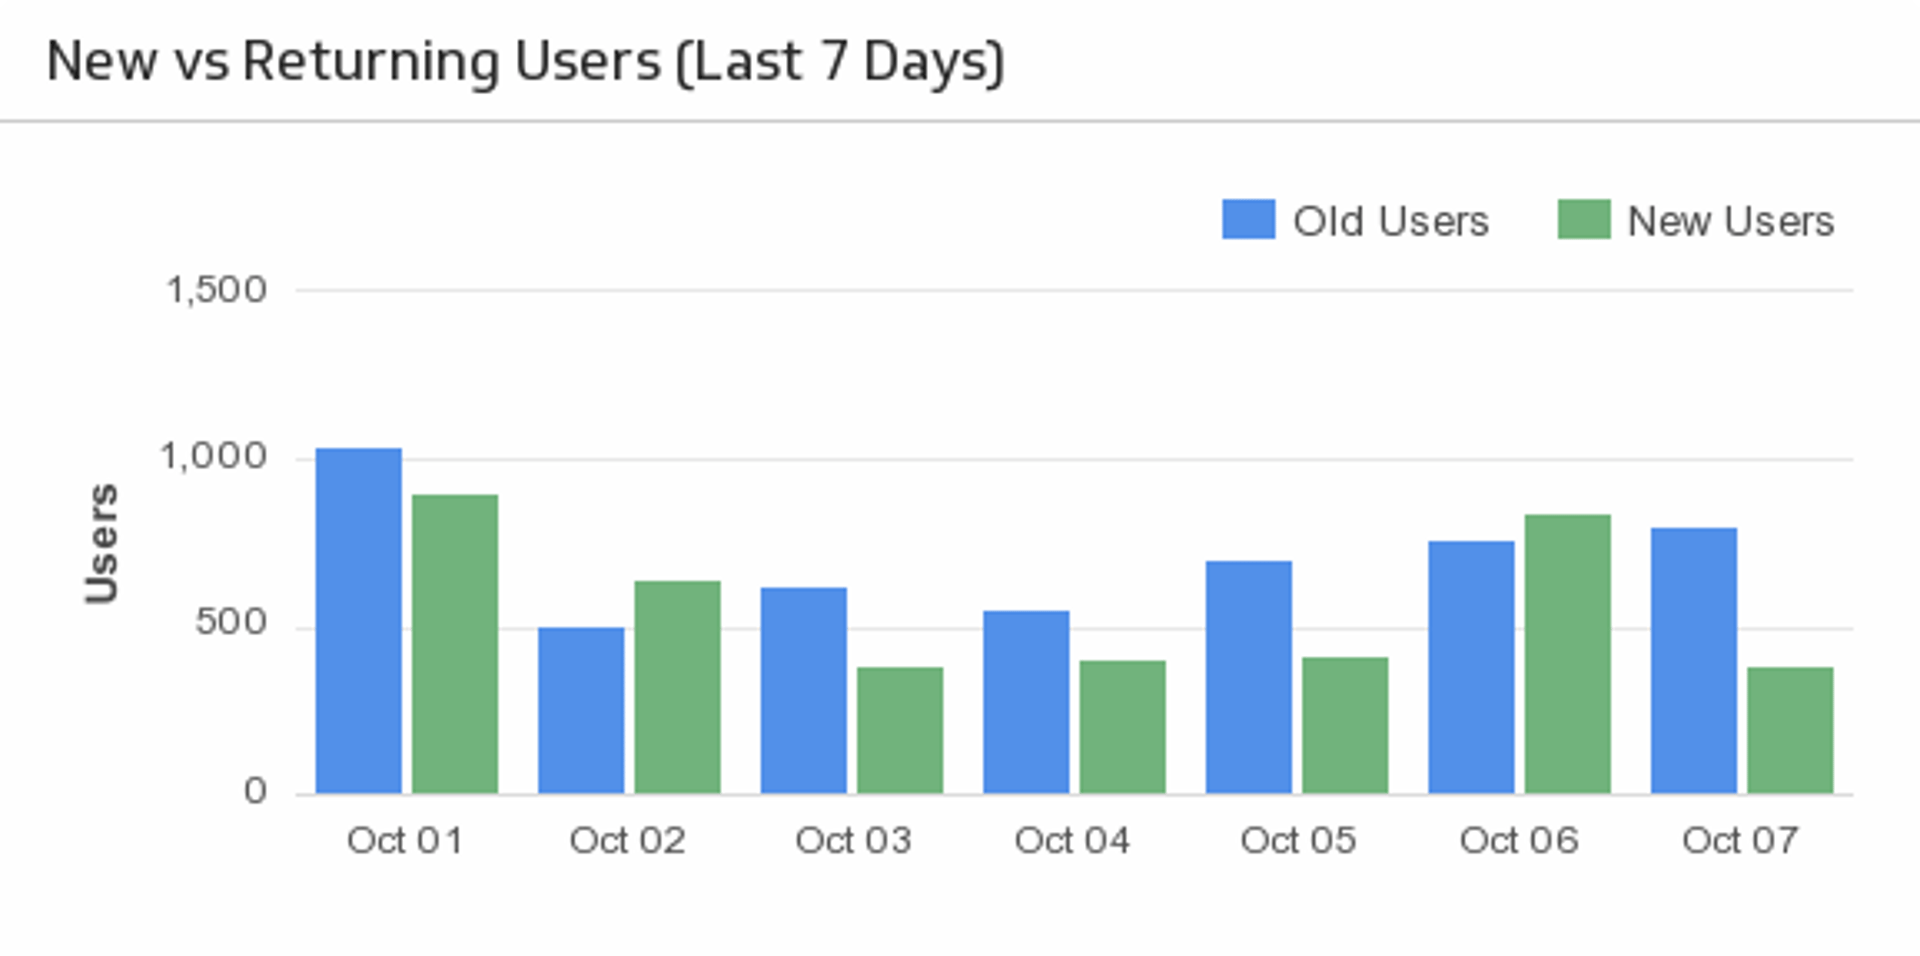
New vs. Returning Users (Last 7 Days)
Use this simple, yet effective, bar chart to compare your new versus returning users over the past 7 days.
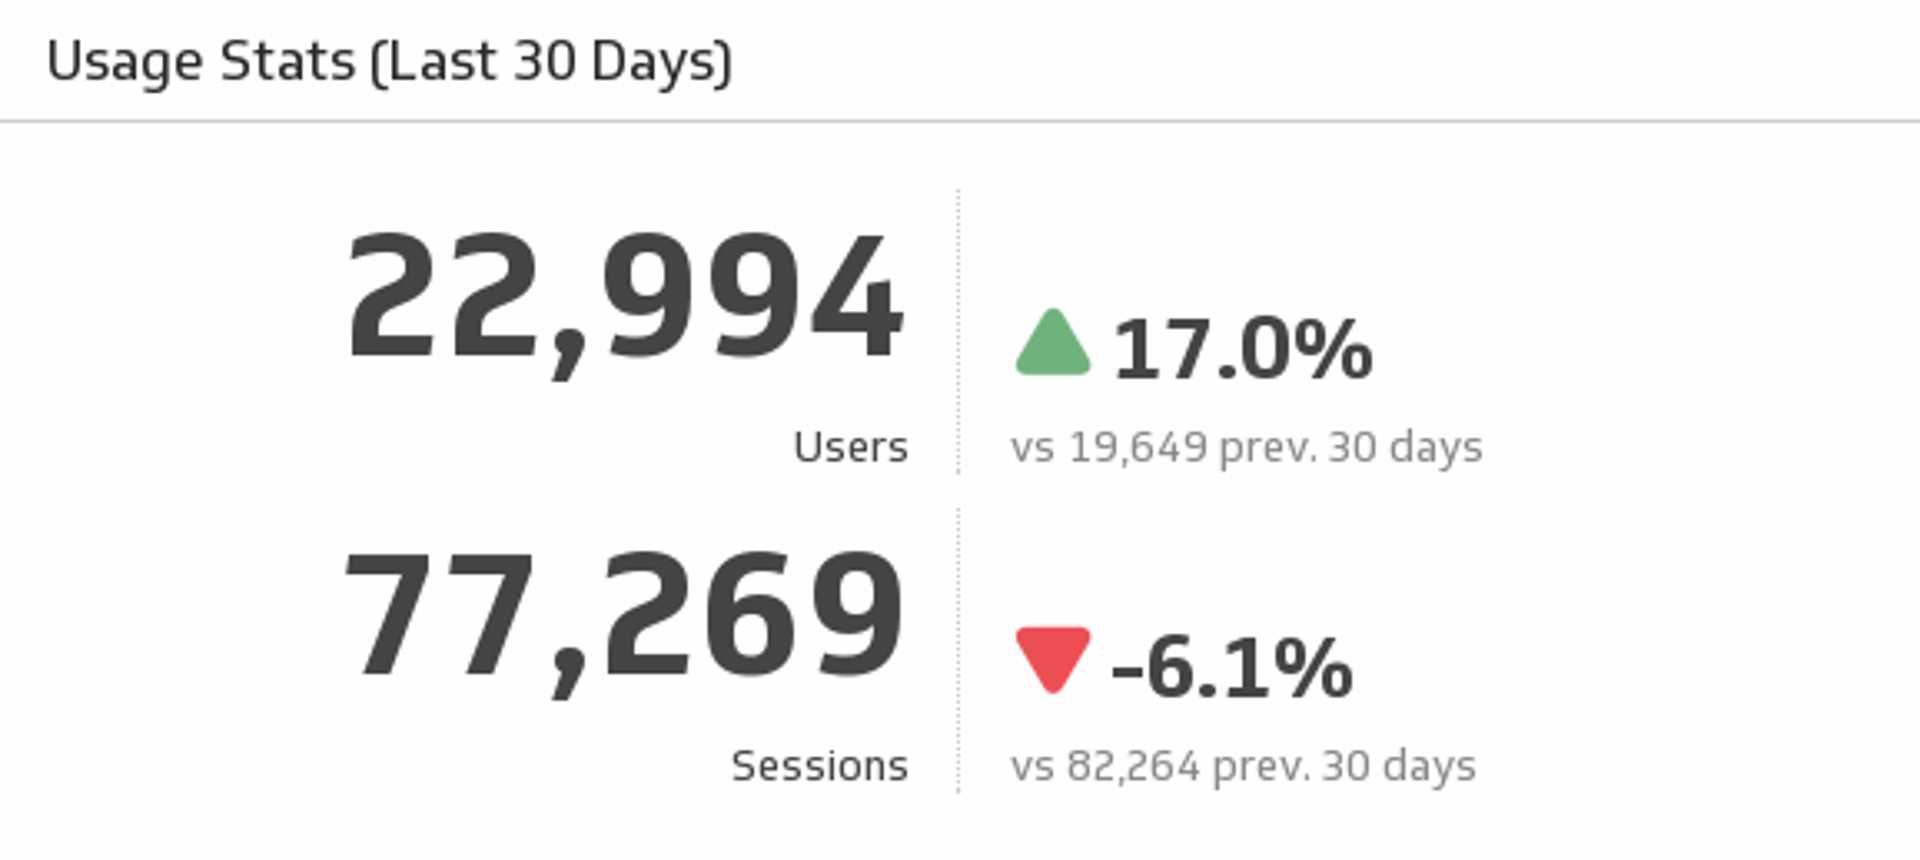
Usage Stats (Last 30 Days)
Track your users and sessions over the past 30 days, and compare it to the previous 30 days.
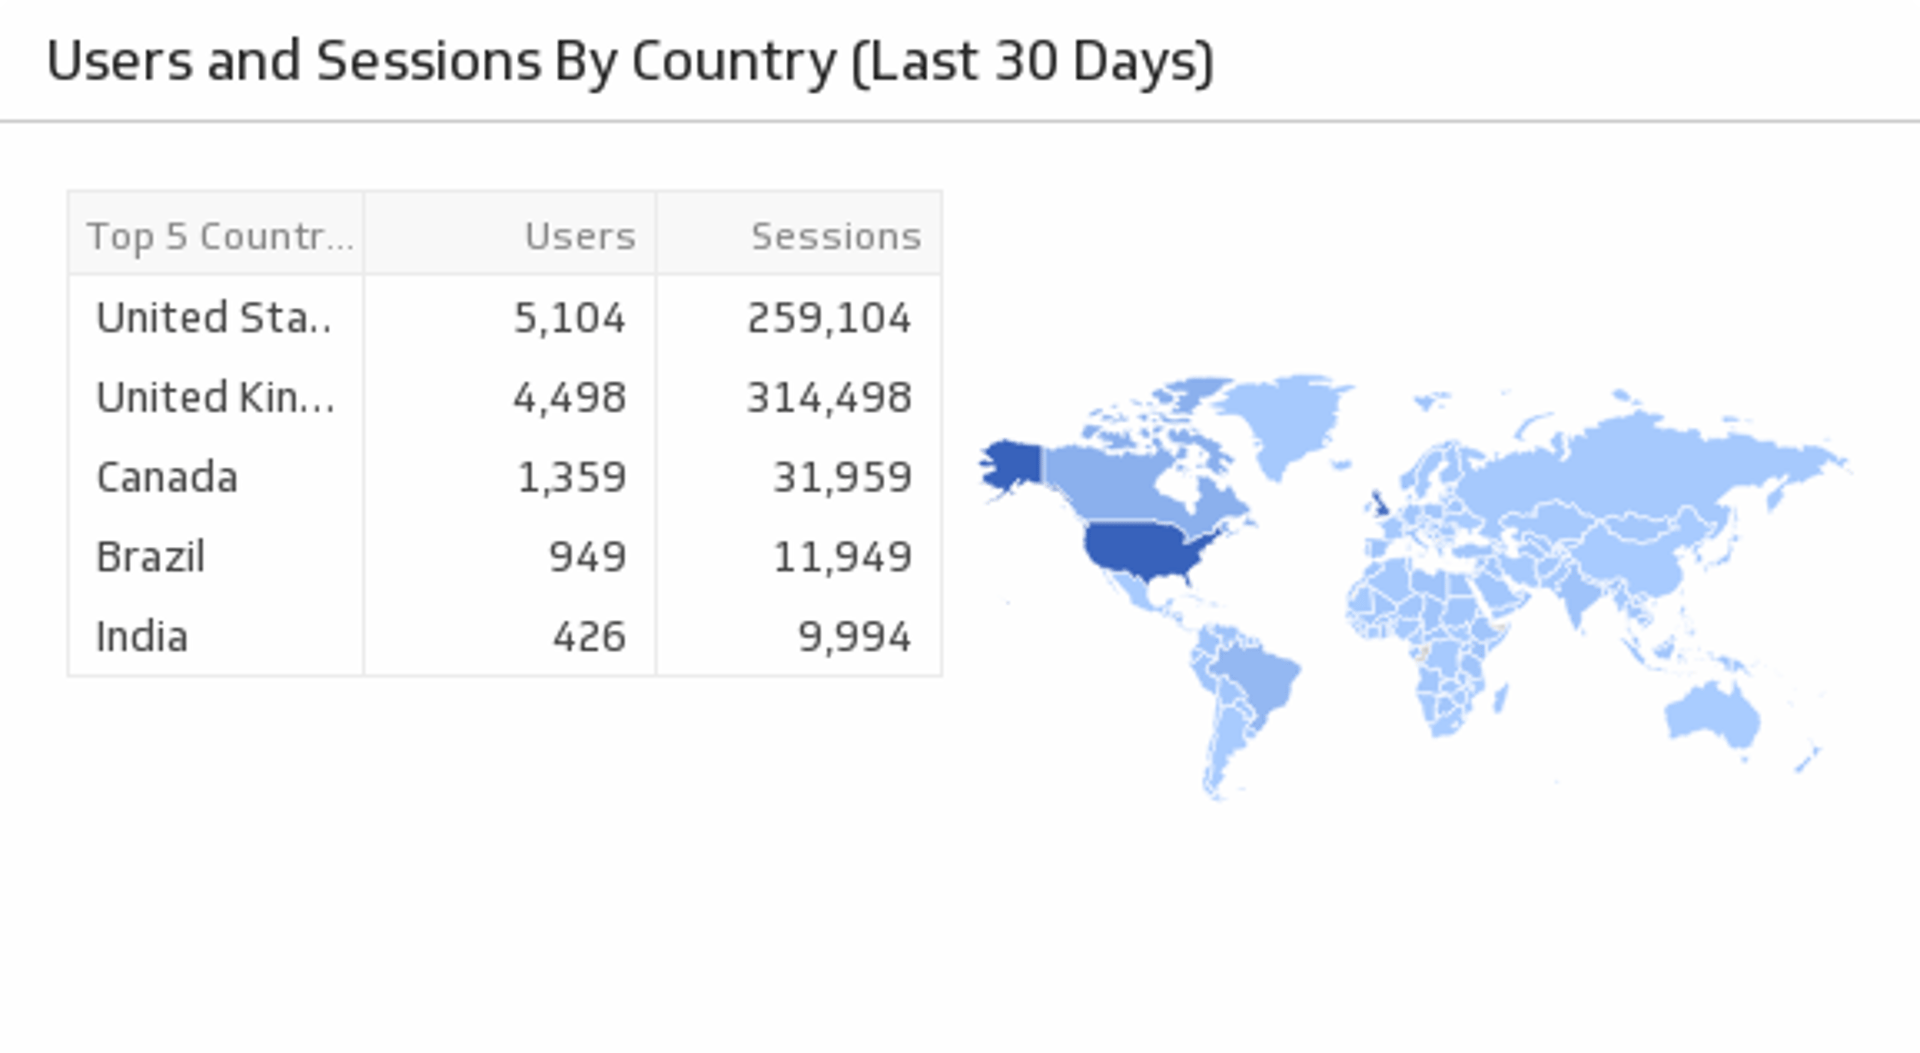
Users and Sessions by Country (Last 30 Days)
Visualize on a map where the majority of your users are coming from.
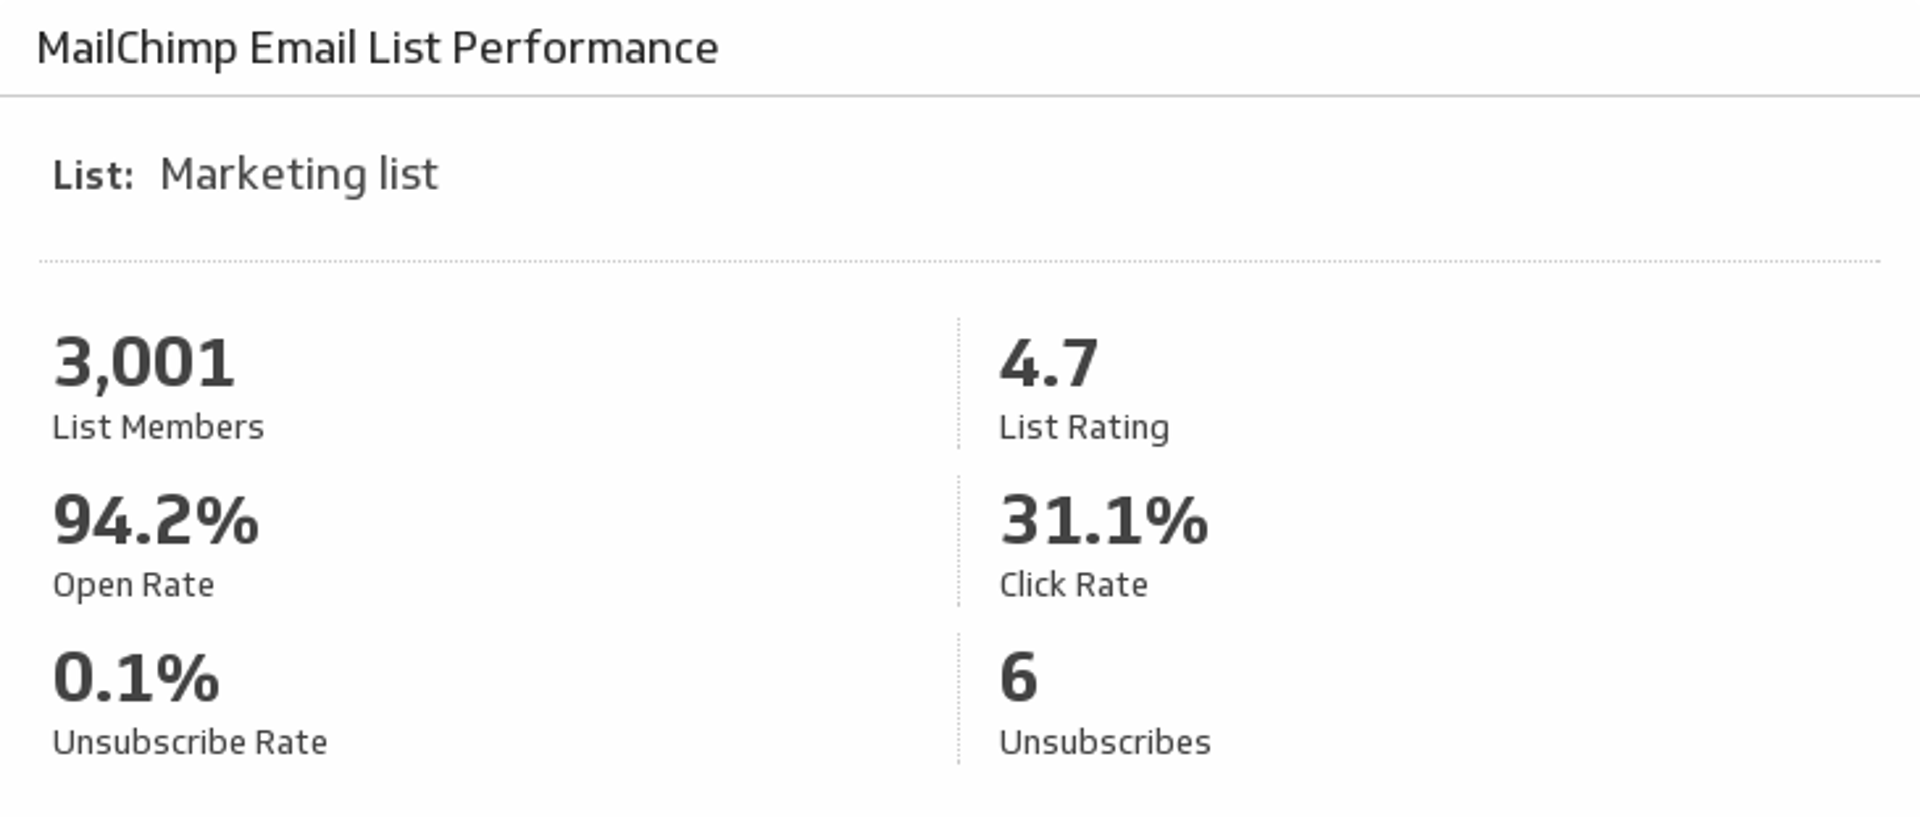
Email List Performance
Monitor your Open, Click, and Unsubscribe rates as well as your List Ratings from MailChimp.
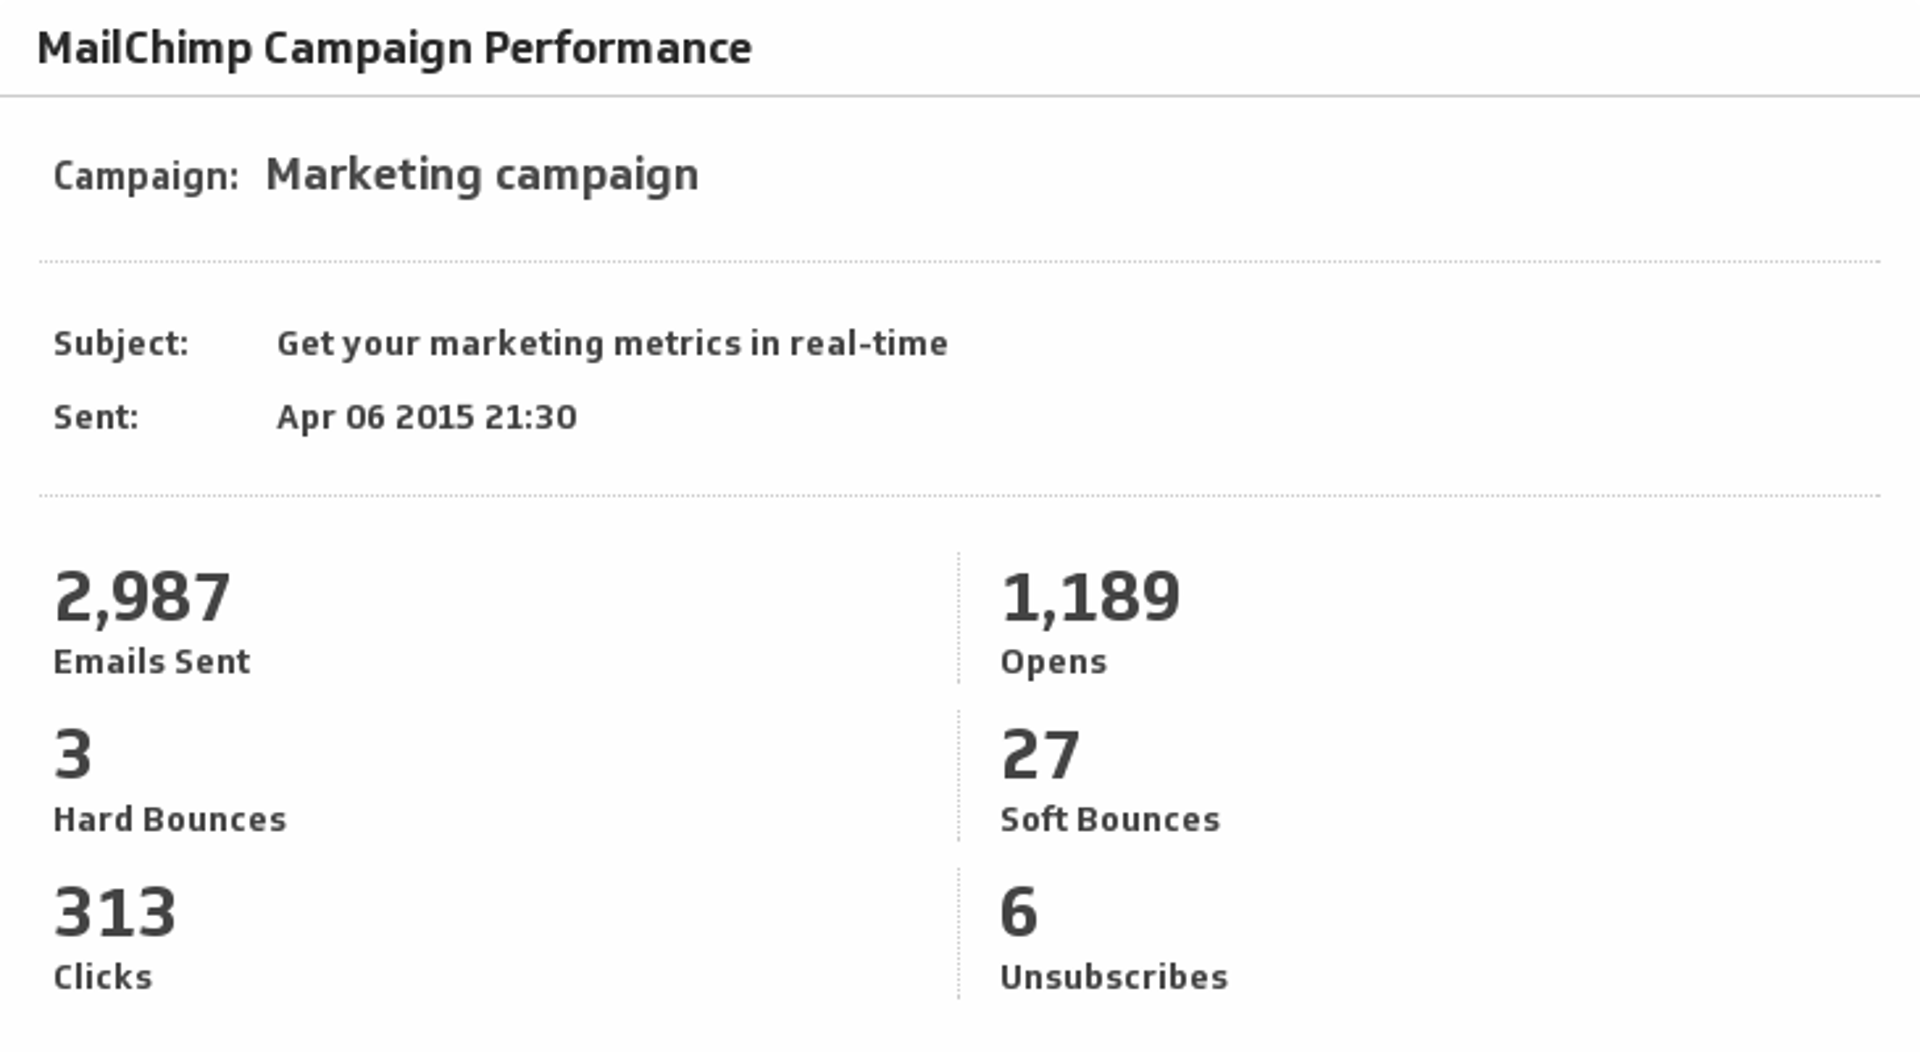
MailChimp Campaign Performance
Monitor your Sent, Opens, Bounces, Clicks and Unsubscribes for your campaigns in MailChimp.
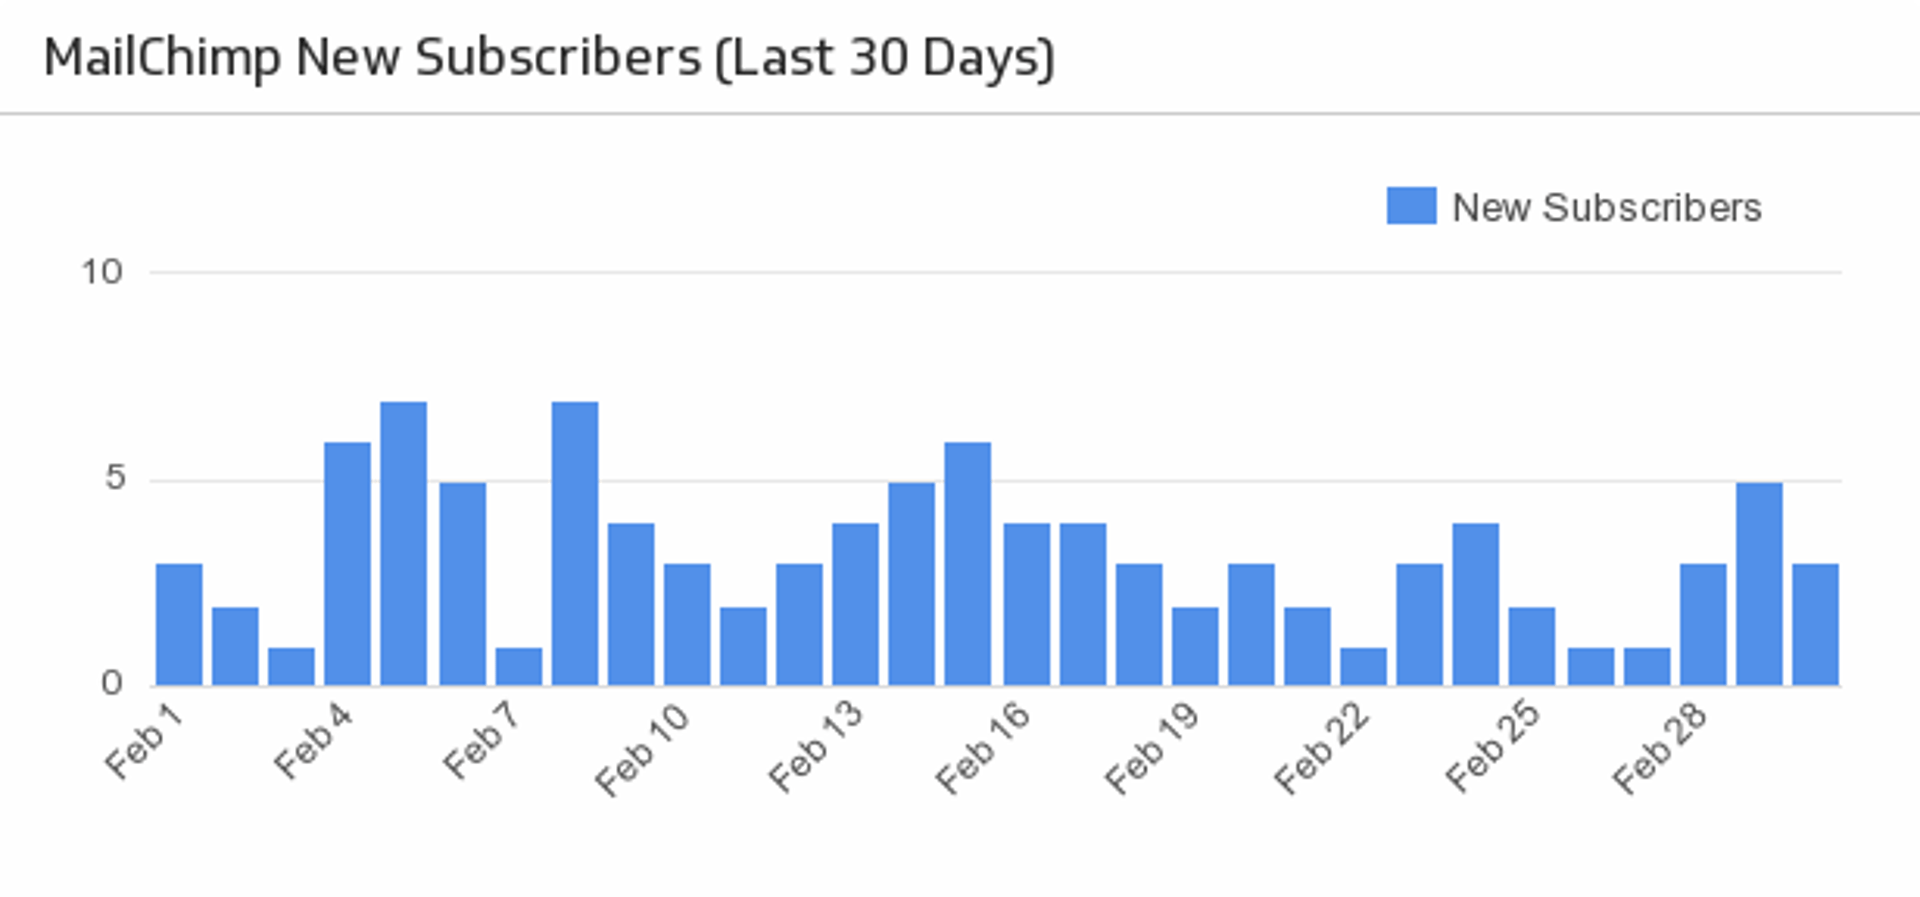
MailChimp New Subscribers
Make sure your MailChimp email campaigns are fruitful with a handy bar chart monitoring the daily number of new subscribers over the past month.
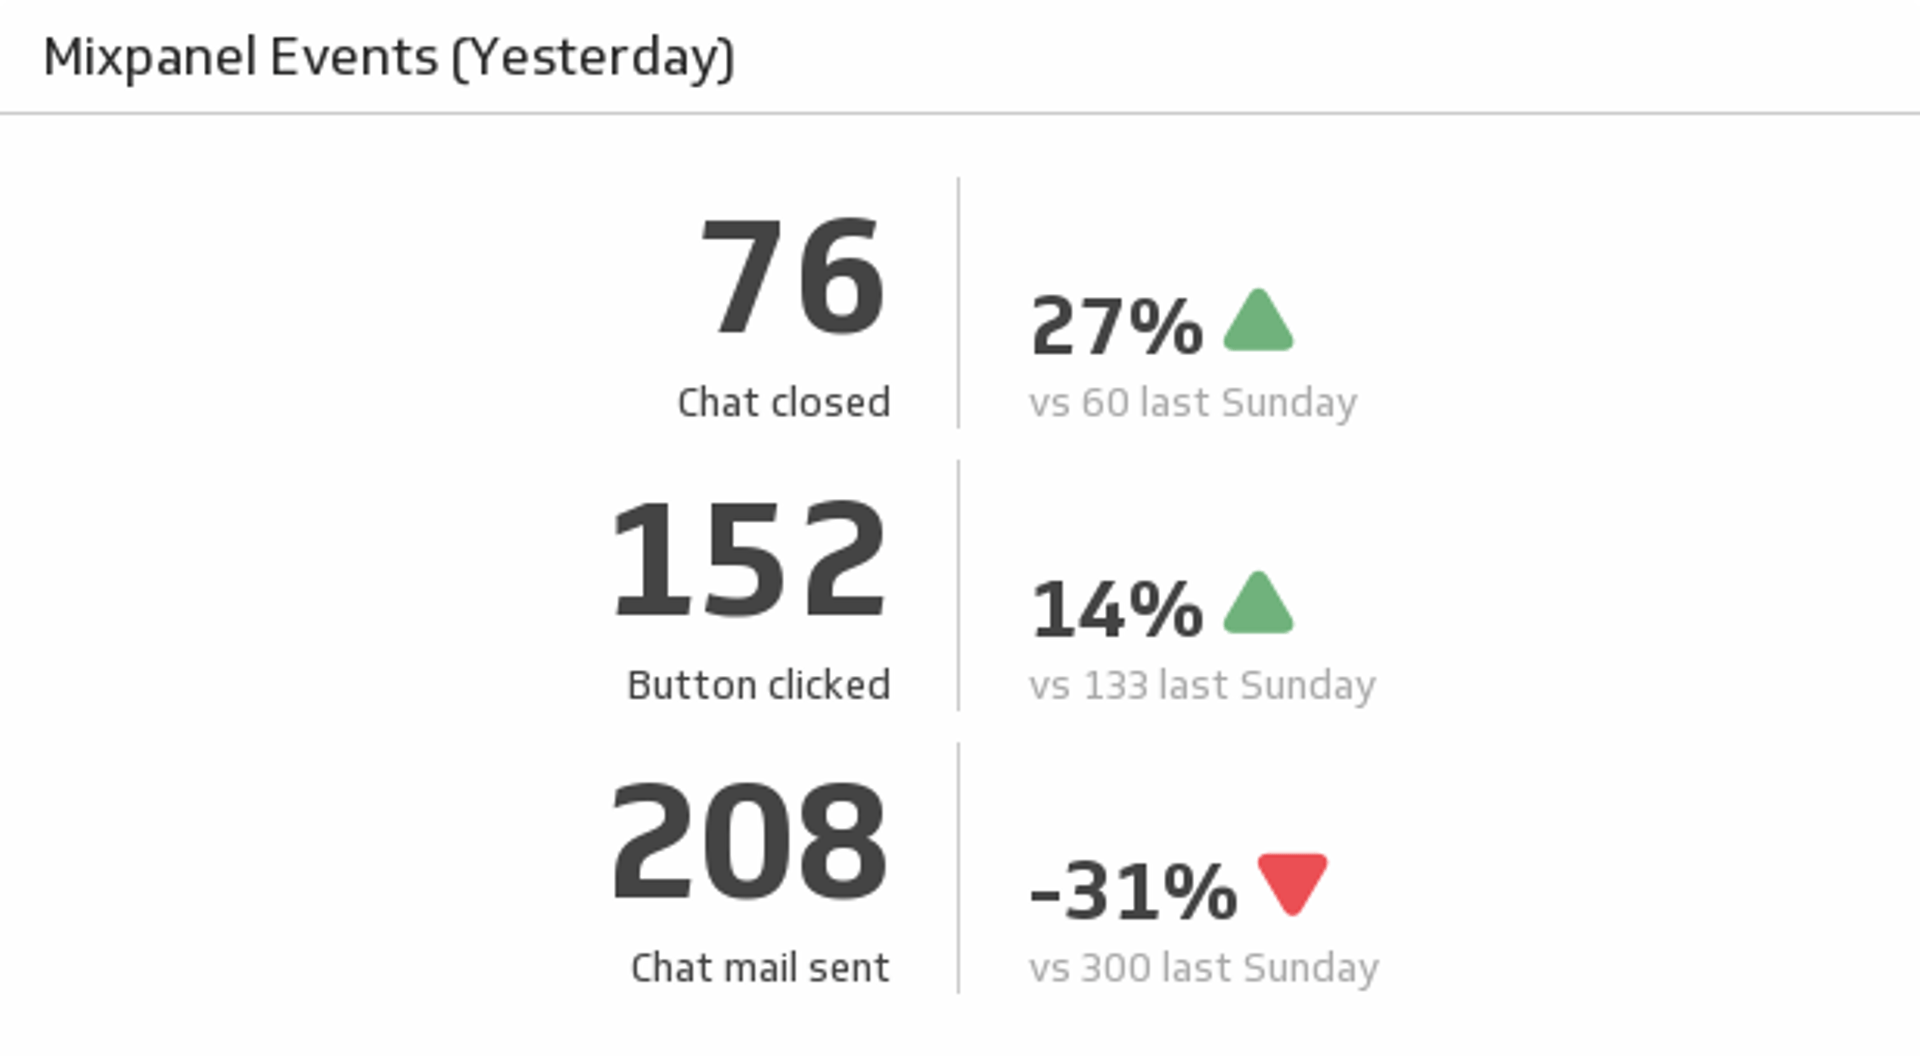
Events (Yesterday)
Discover and compare the essential metrics on three of your Mixpanel events.
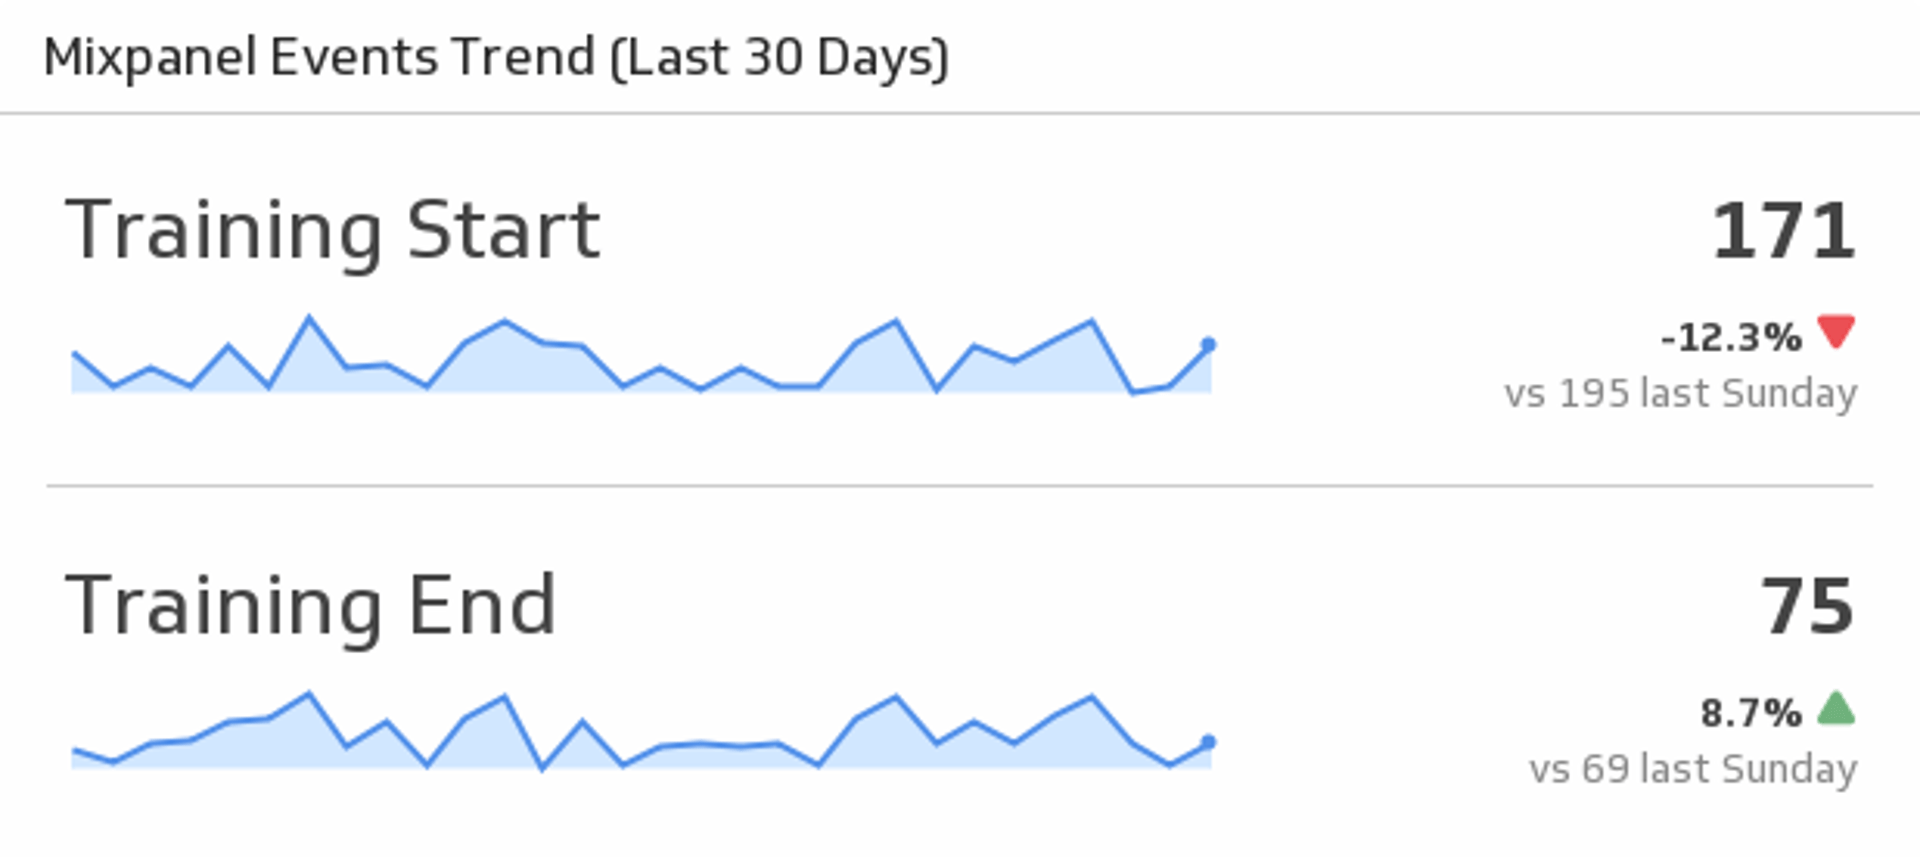
Events Trend (Last 30 Days)
Track your Mixpanel events by monitoring the 30 day trend, and compare the totals from yesterday with a week prior to yesterday.
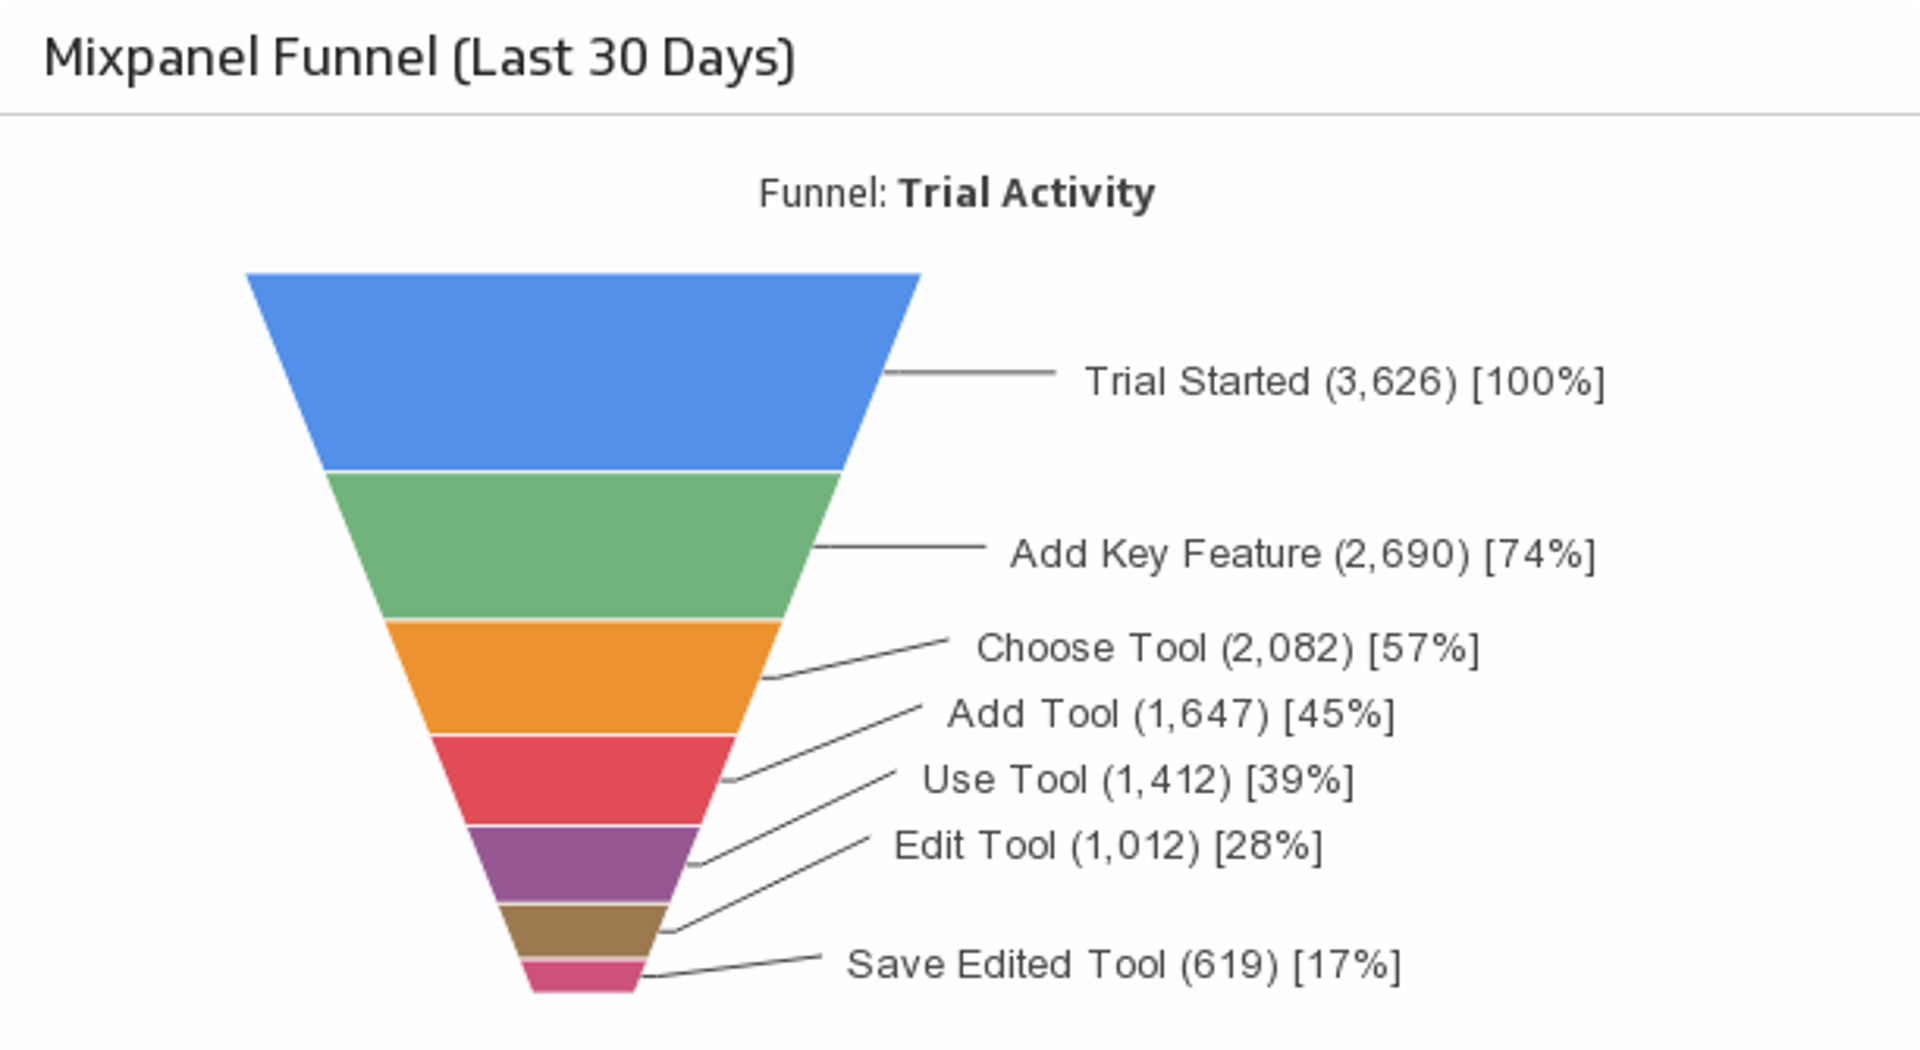
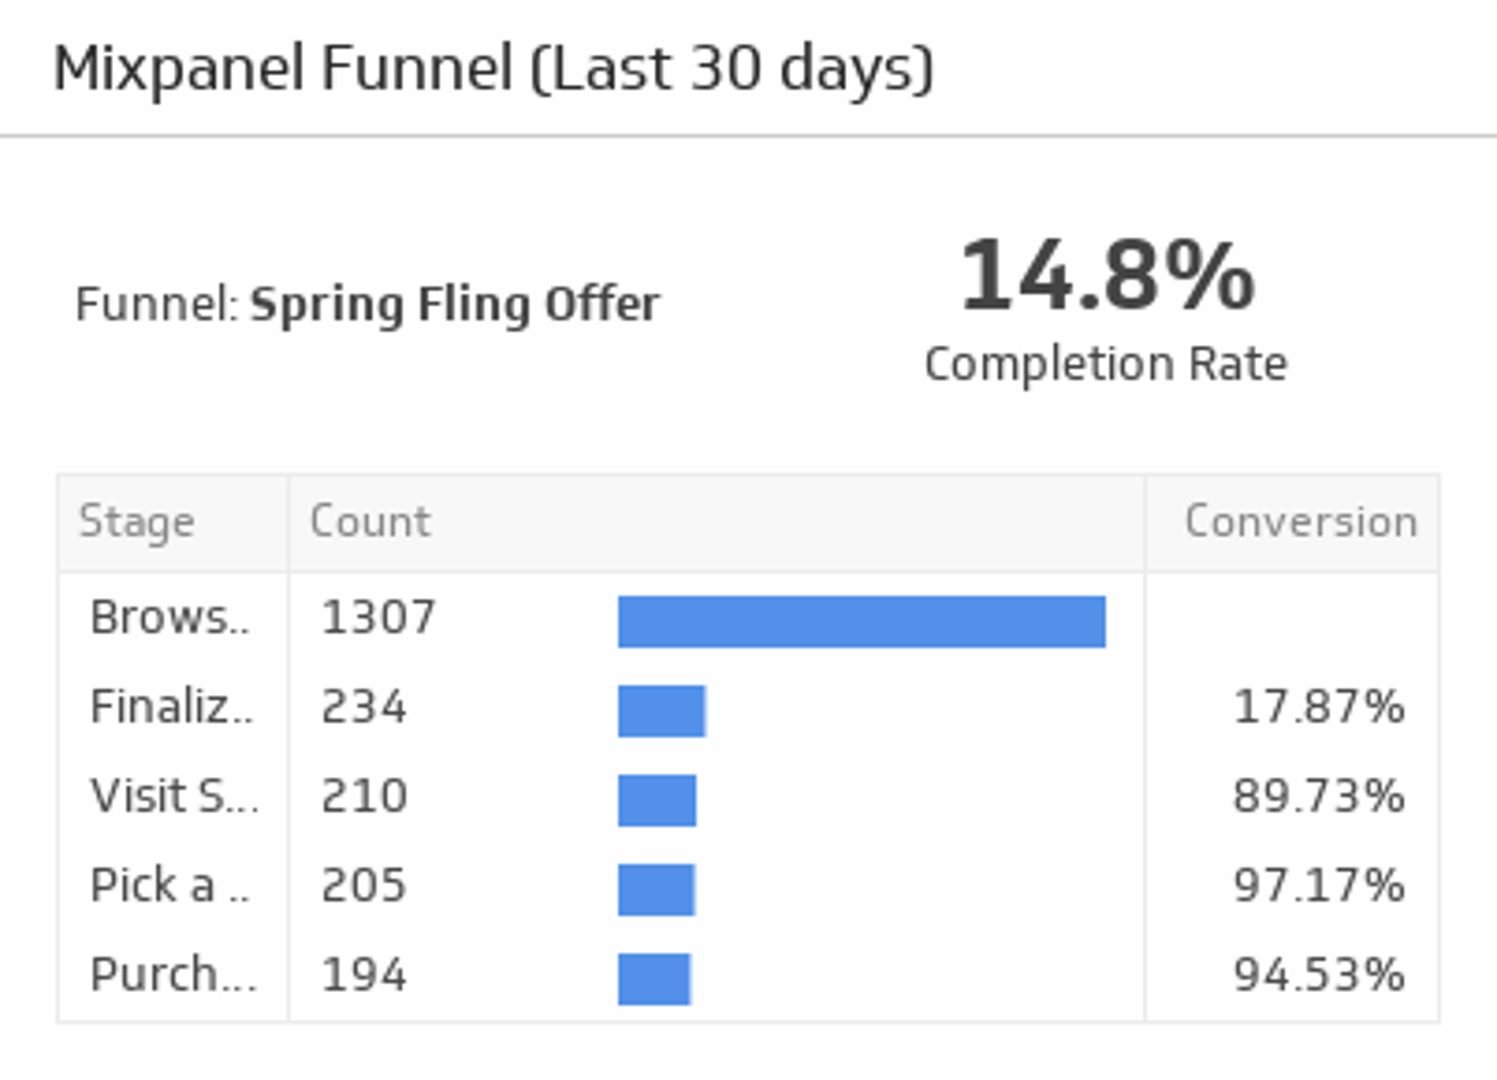
Funnel (Last 30 Days)
Track your conversion rate between the stages of a Mixpanel funnel, and compare it to your average funnel completion rate.
Funnel (Last 30 Days)
Increase your conversion rates by taking the time to monitor a funnel displaying your app activity.
Top 5 Events by Property
Track your top 5 properties and the total number of their corresponding events.
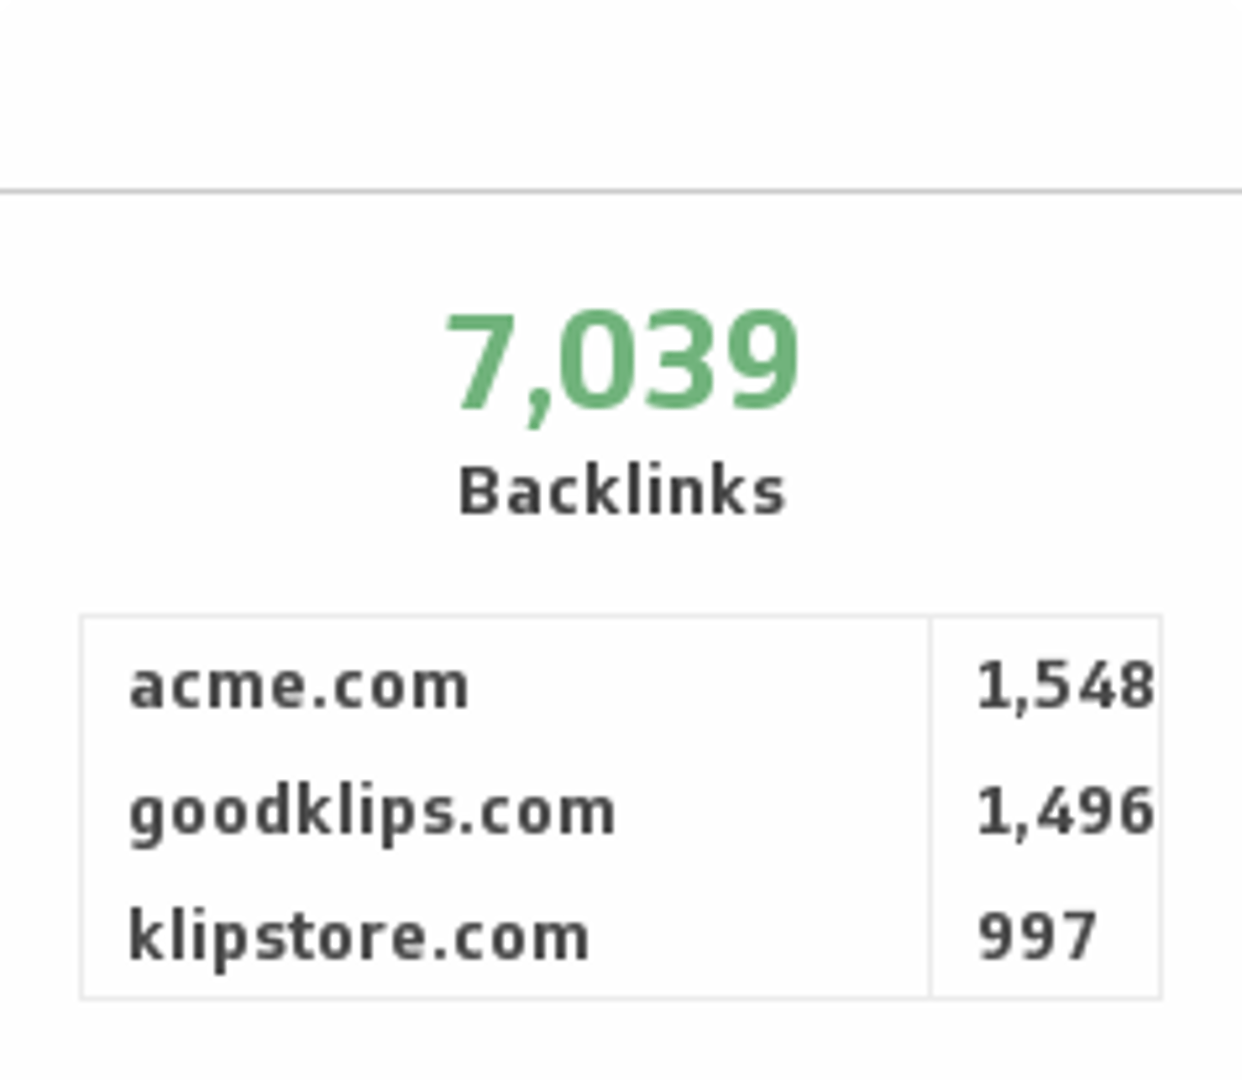
Backlinks
Monitor the number of backlinks to your website and compare it to your competitors.
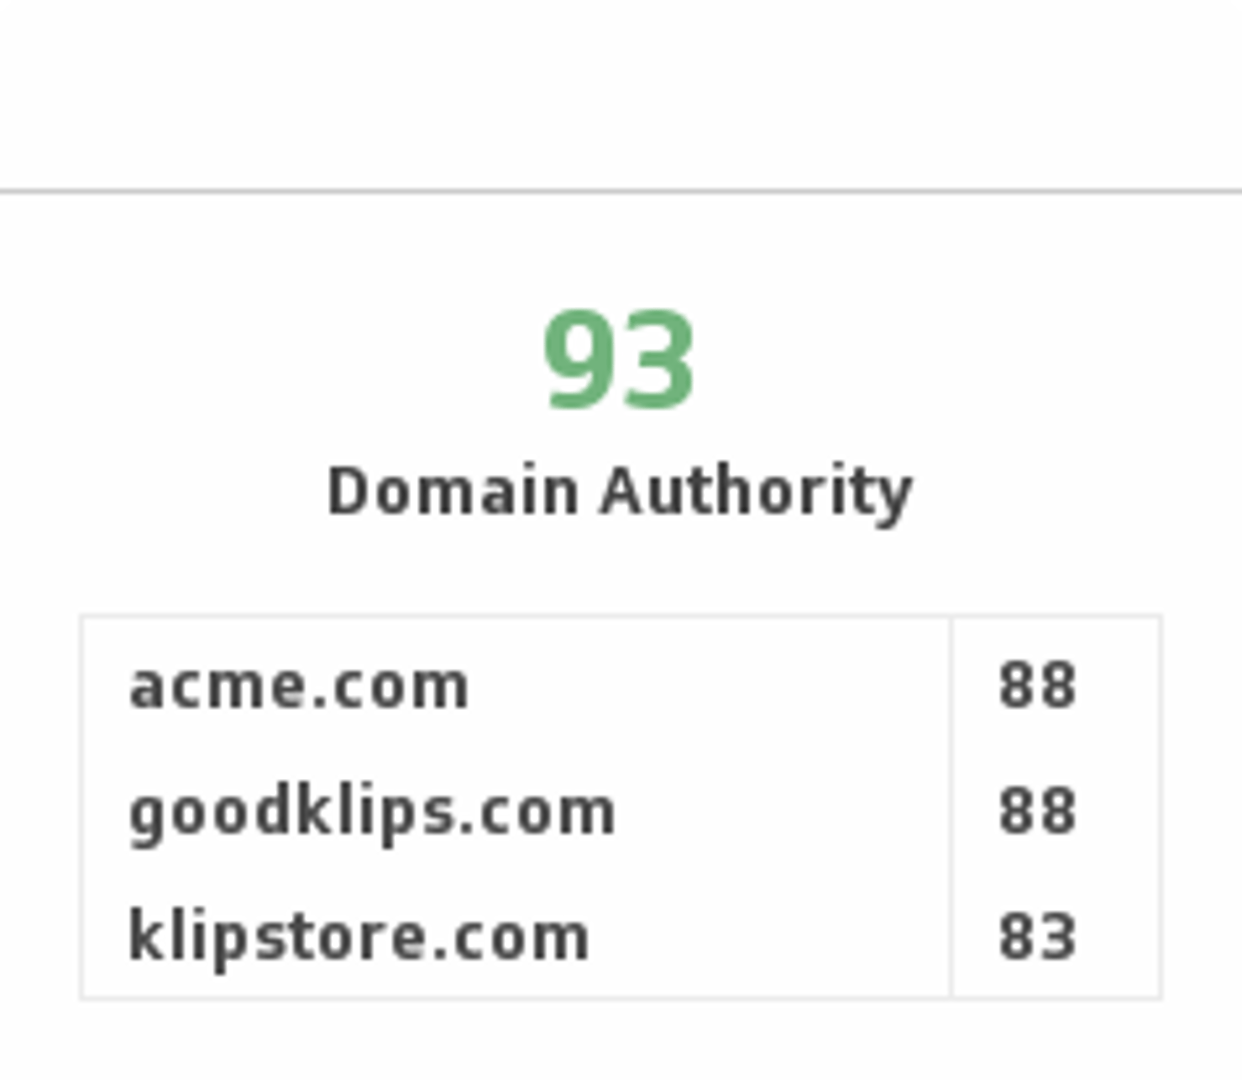
Domain Authority
Predict how well a website will rank on search engines by tracking Domain Authority and comparing it with competitors.
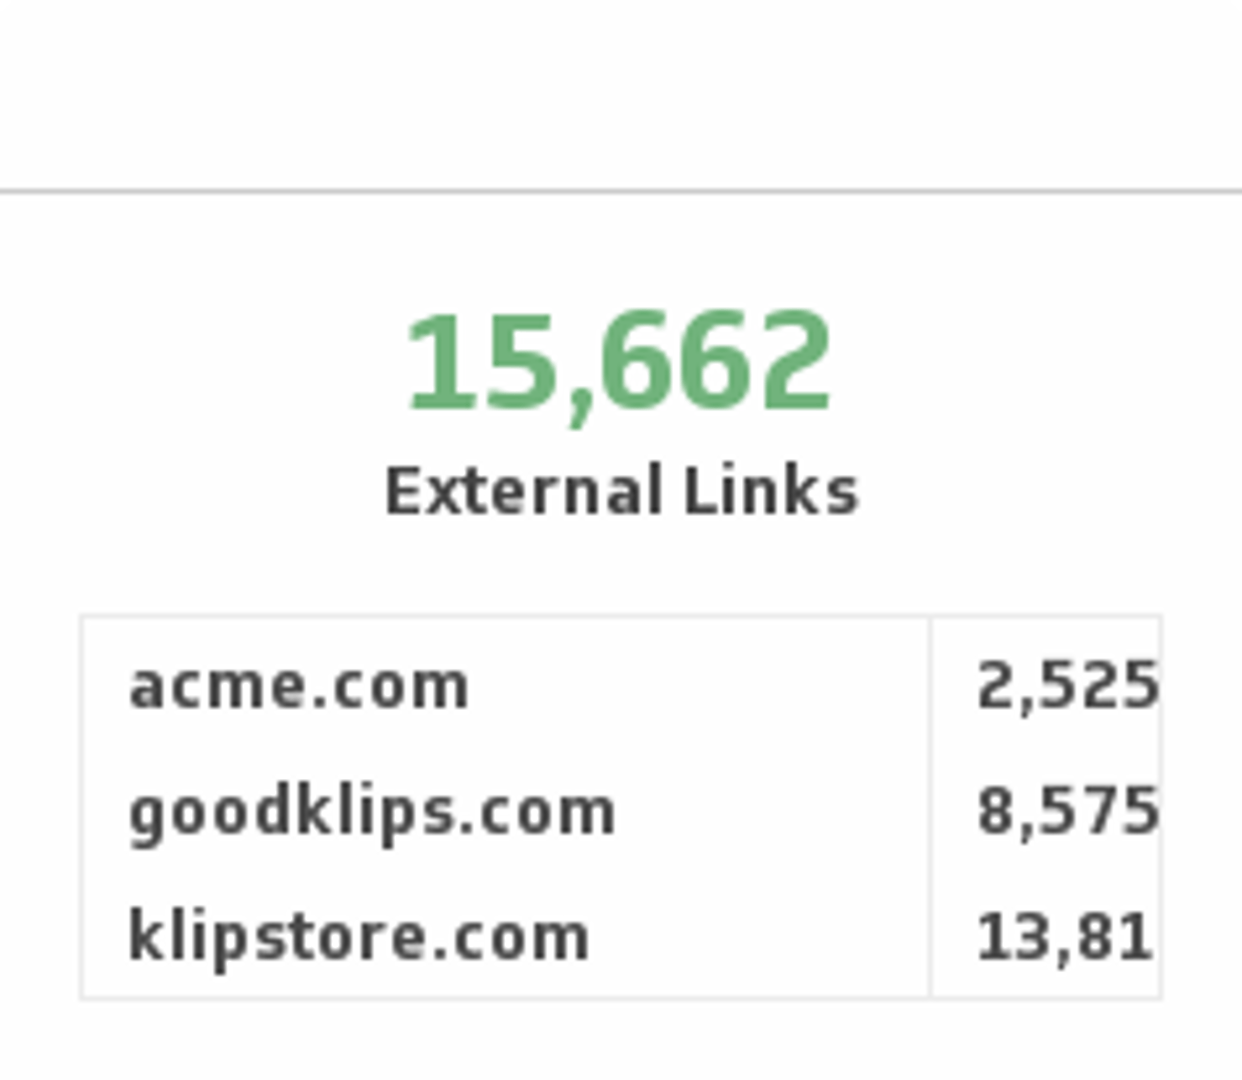
External Links
Monitor the number of external links to your site and compare it with your competitors.
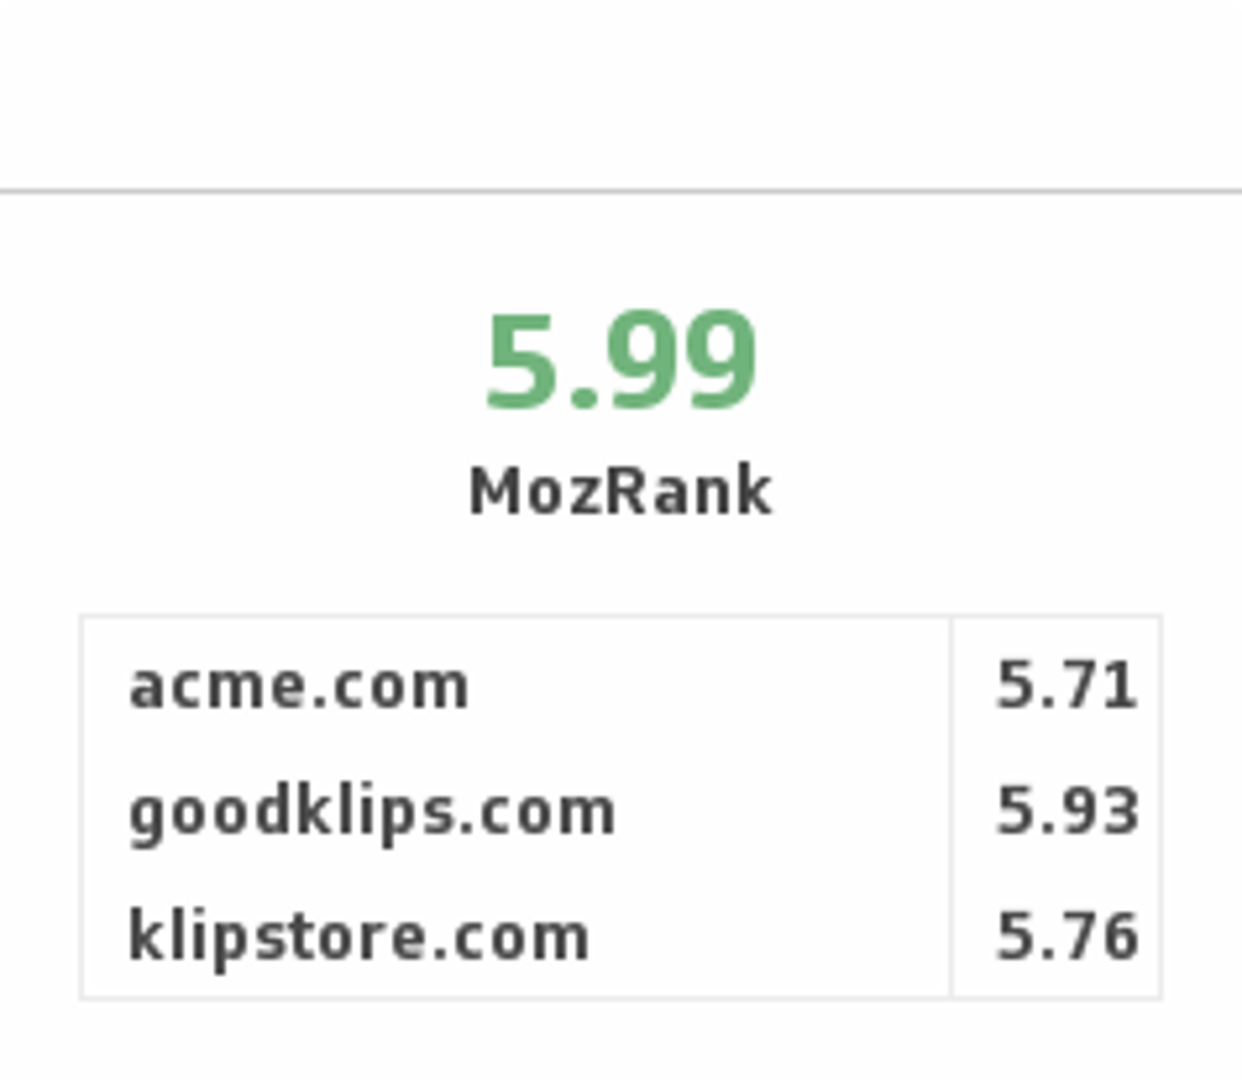
Moz Rank
Ensure you have high quality incoming links by monitoring your Moz Rank and comparing it with your competitors.
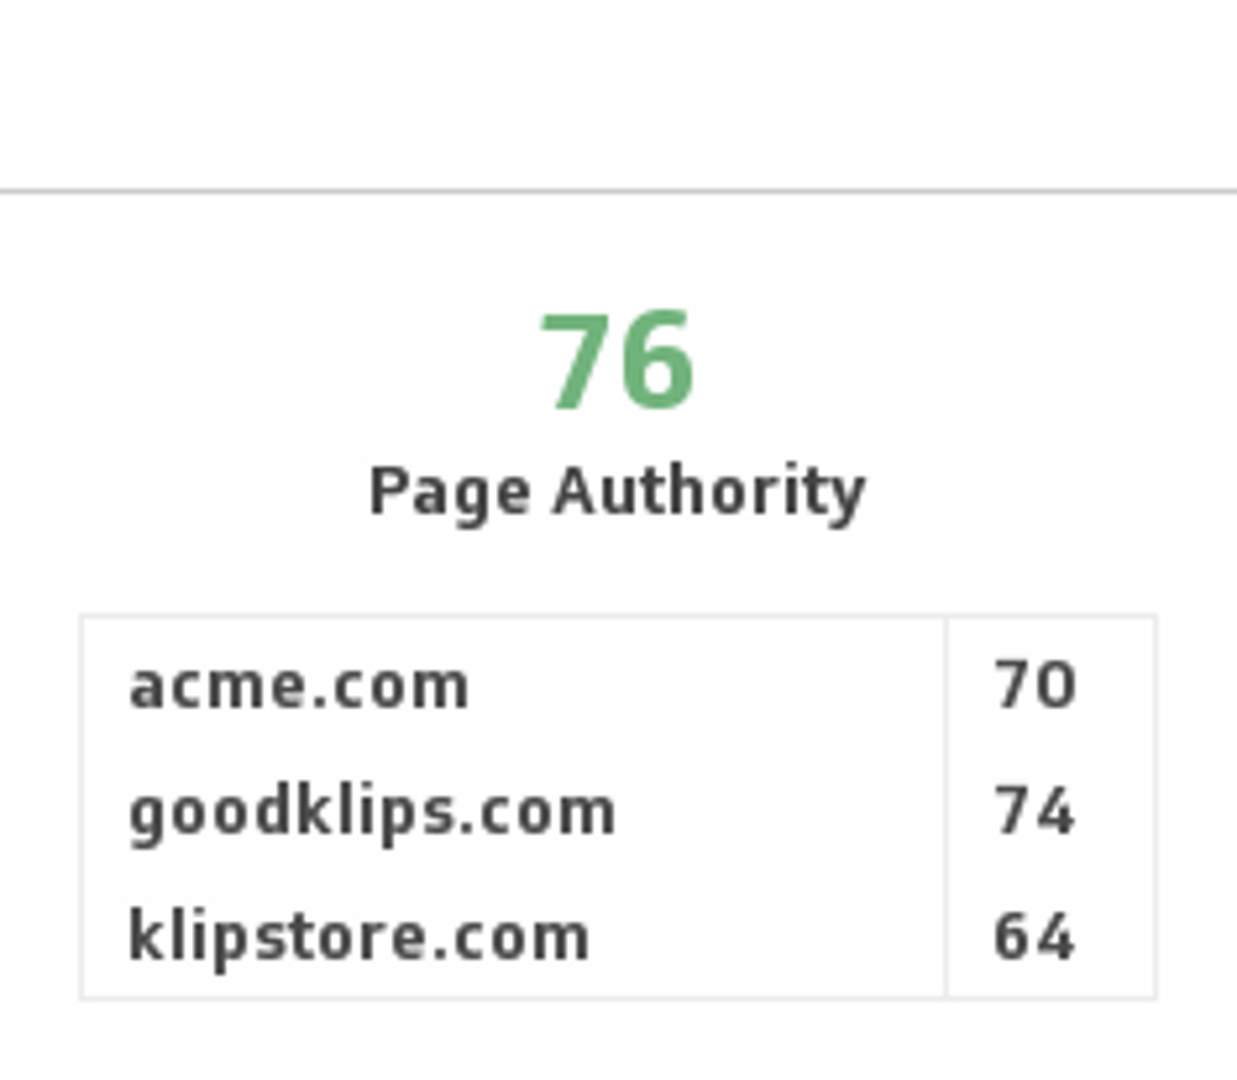
Page Authority
Compare your page authority with your competitors and predict where you stand on search engine rankings.
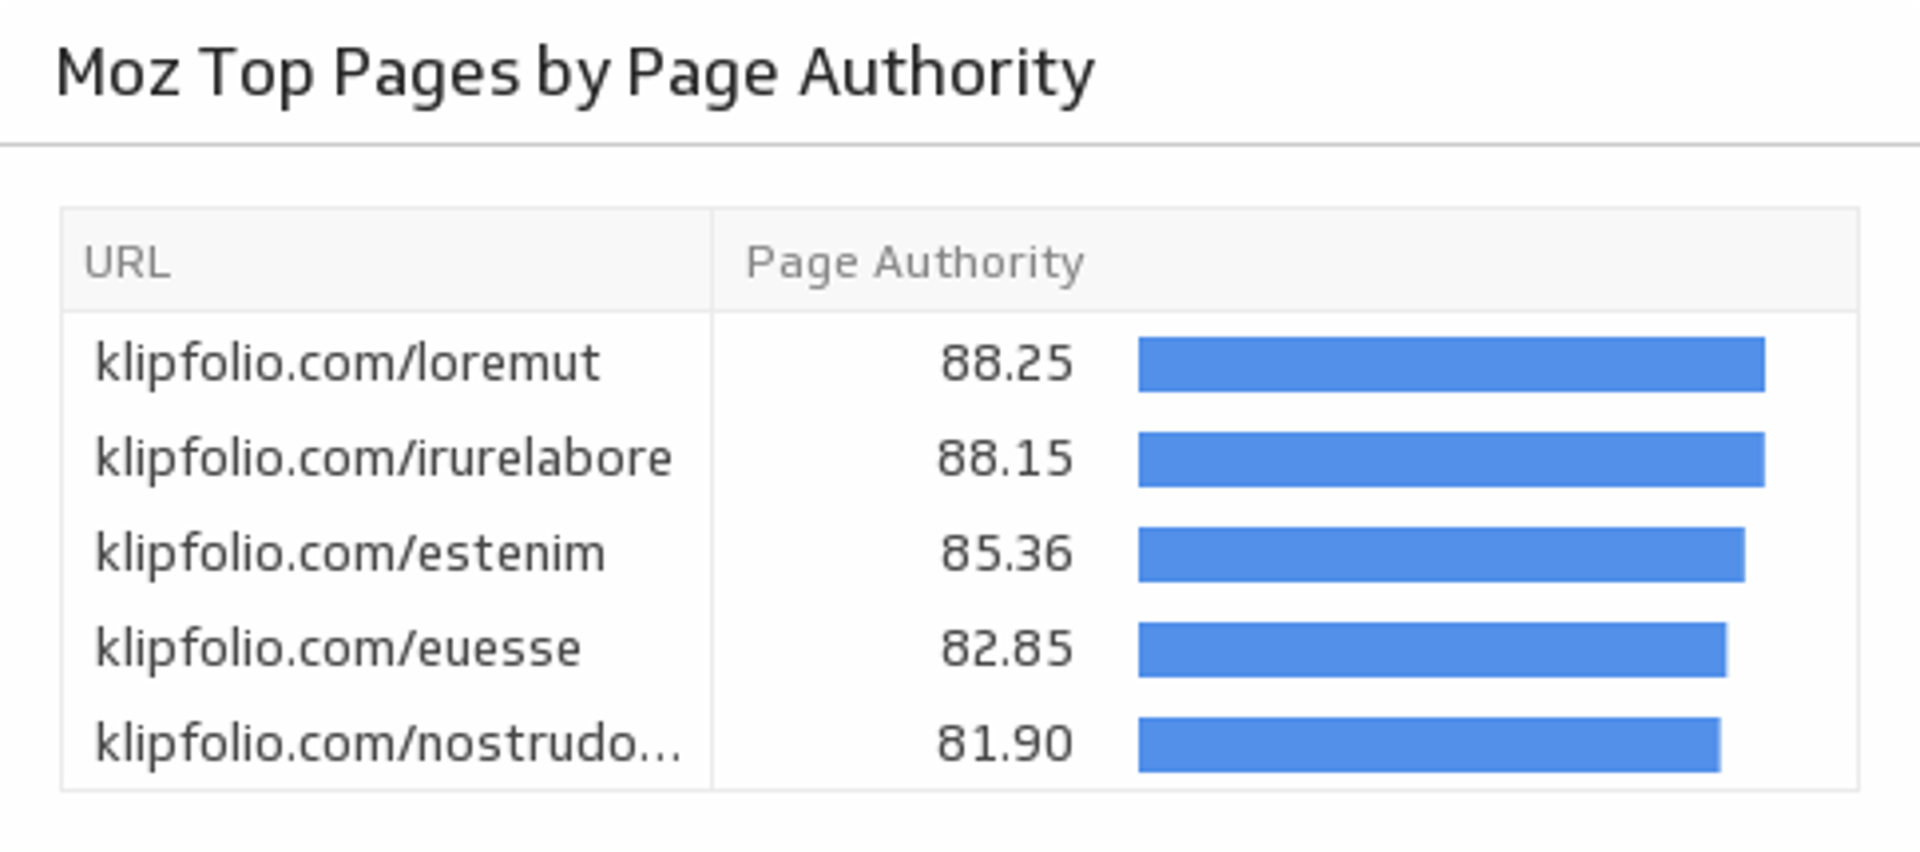
Top Pages by Page Authority
Discover the top pages on your website by ranking them by Page Authority. This Klip requires the Moz API paid subscription.
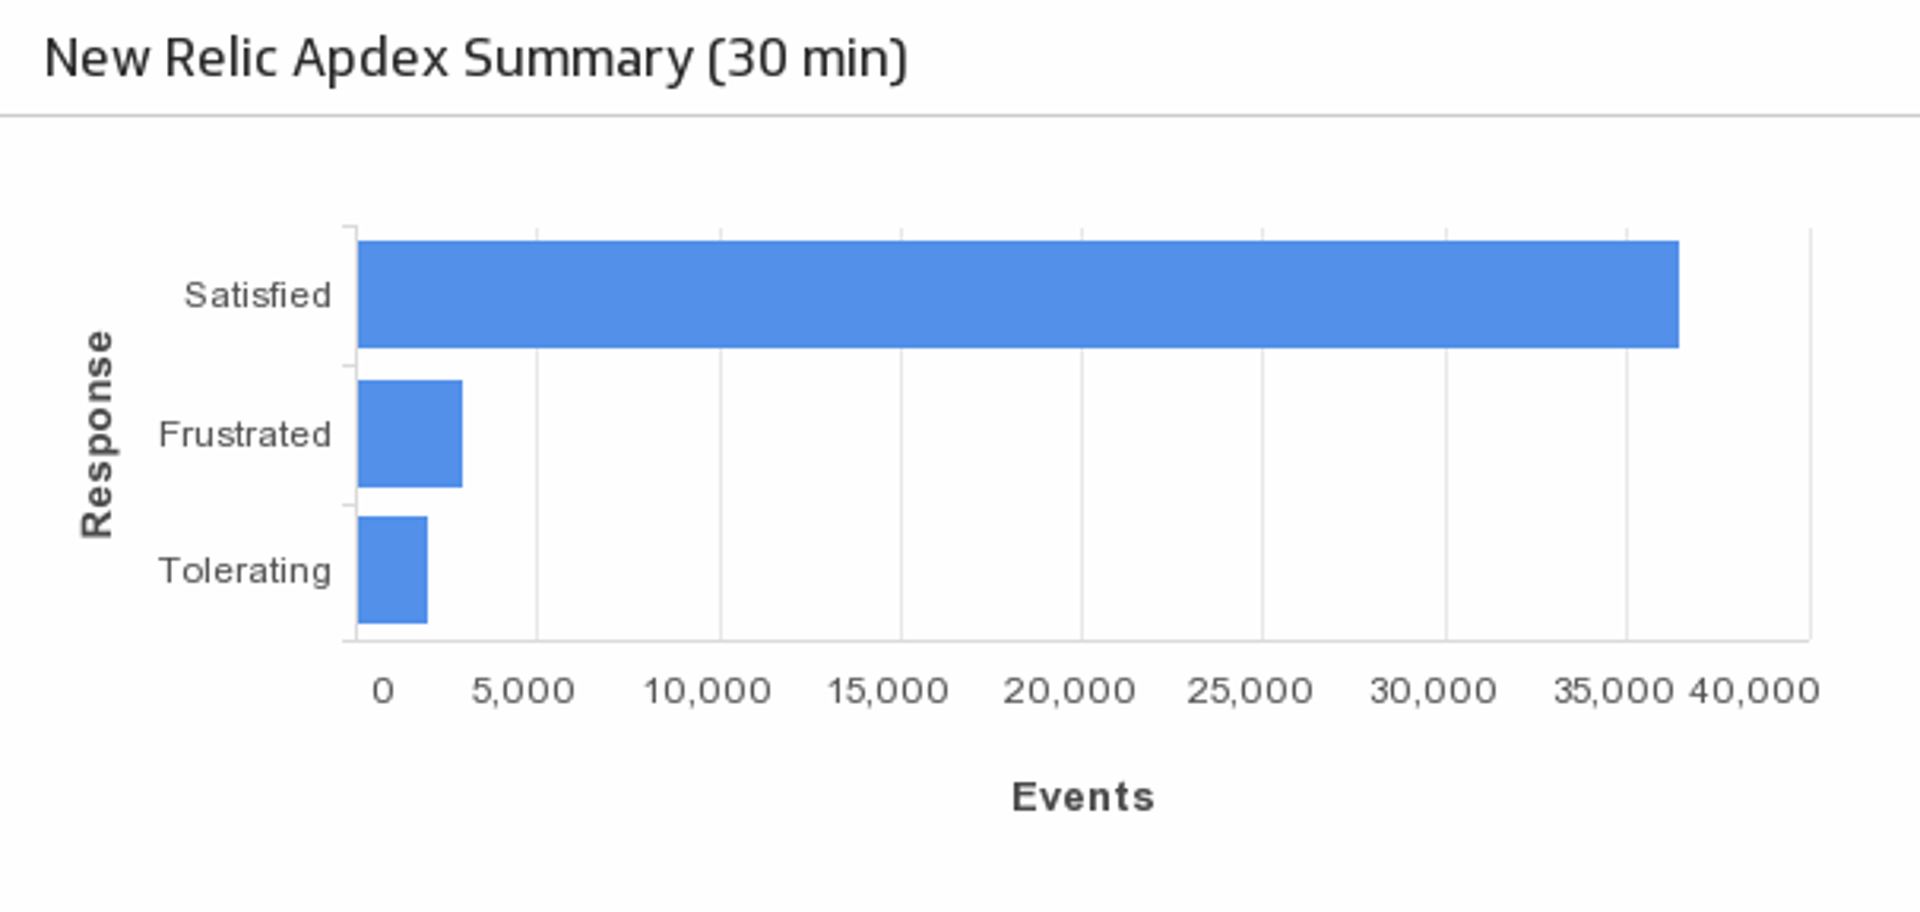
Apdex Summary
Displays a summary of application performance for the last 30 minutes.
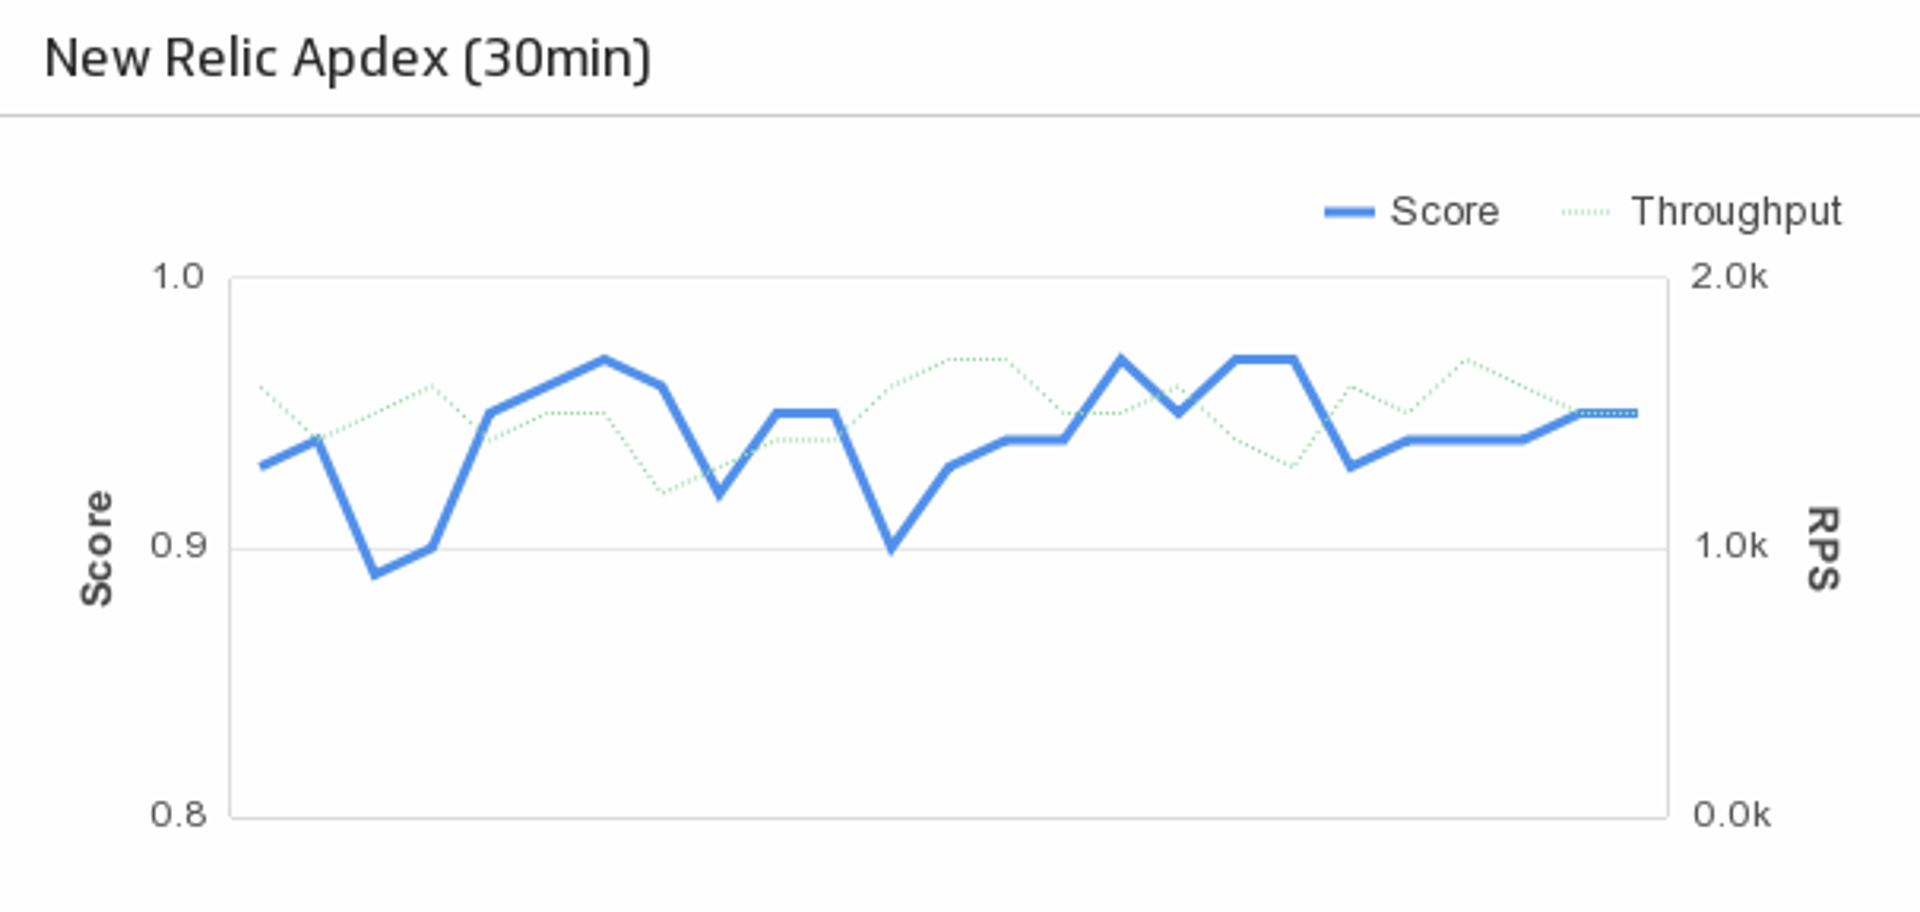
Application Apdex
Displays application apdex score and throughput for the last 30 minutes.
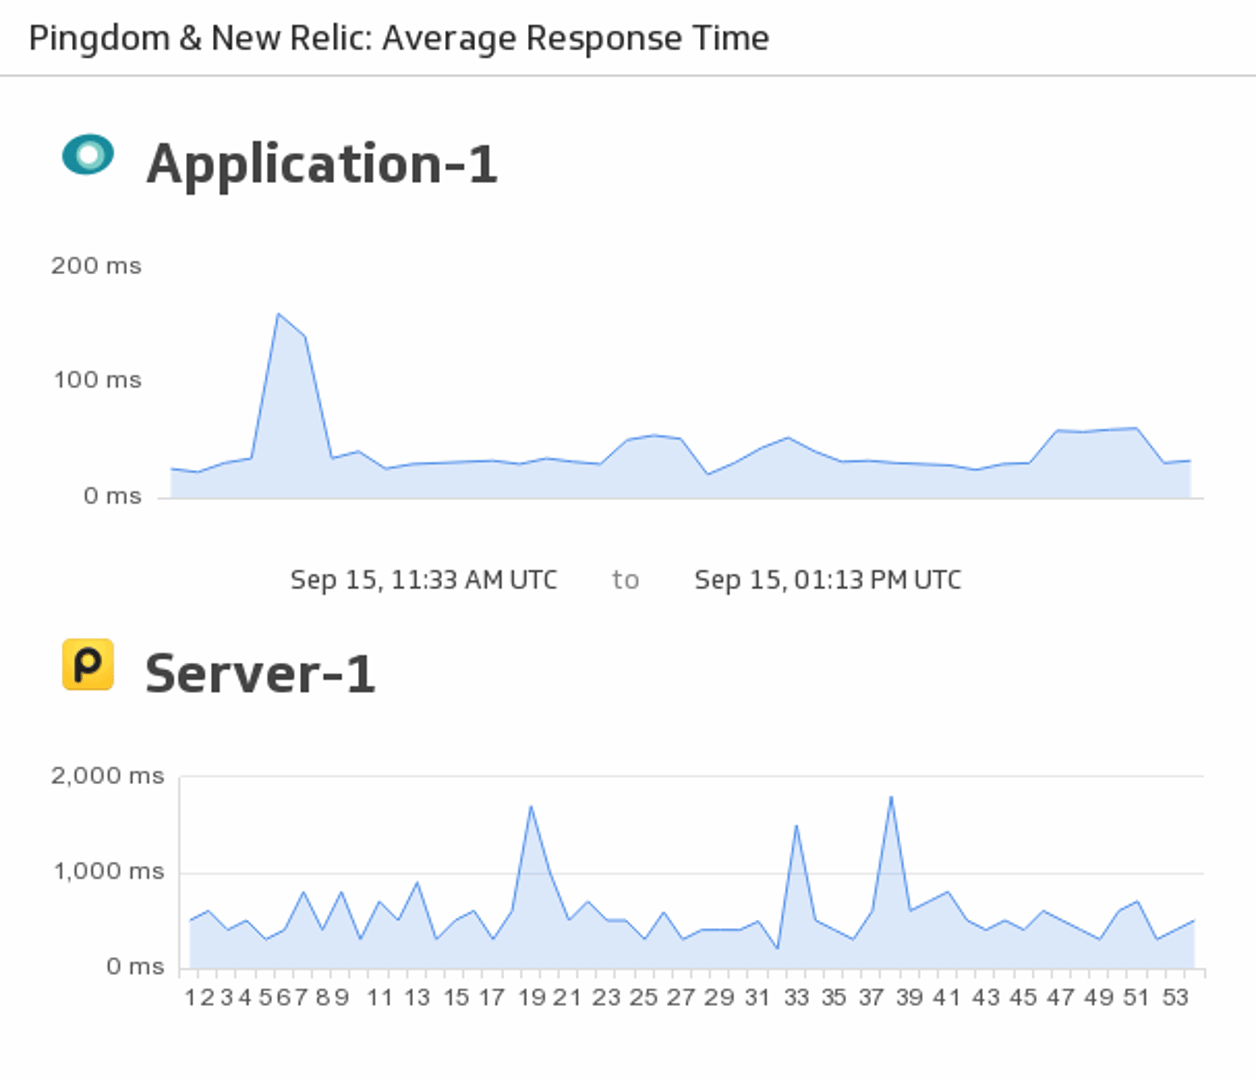
Average Response Time
Make sure to stay on top of your server and application response time by merging your New Relic and Pingdom data to monitor responsiveness in real-time.
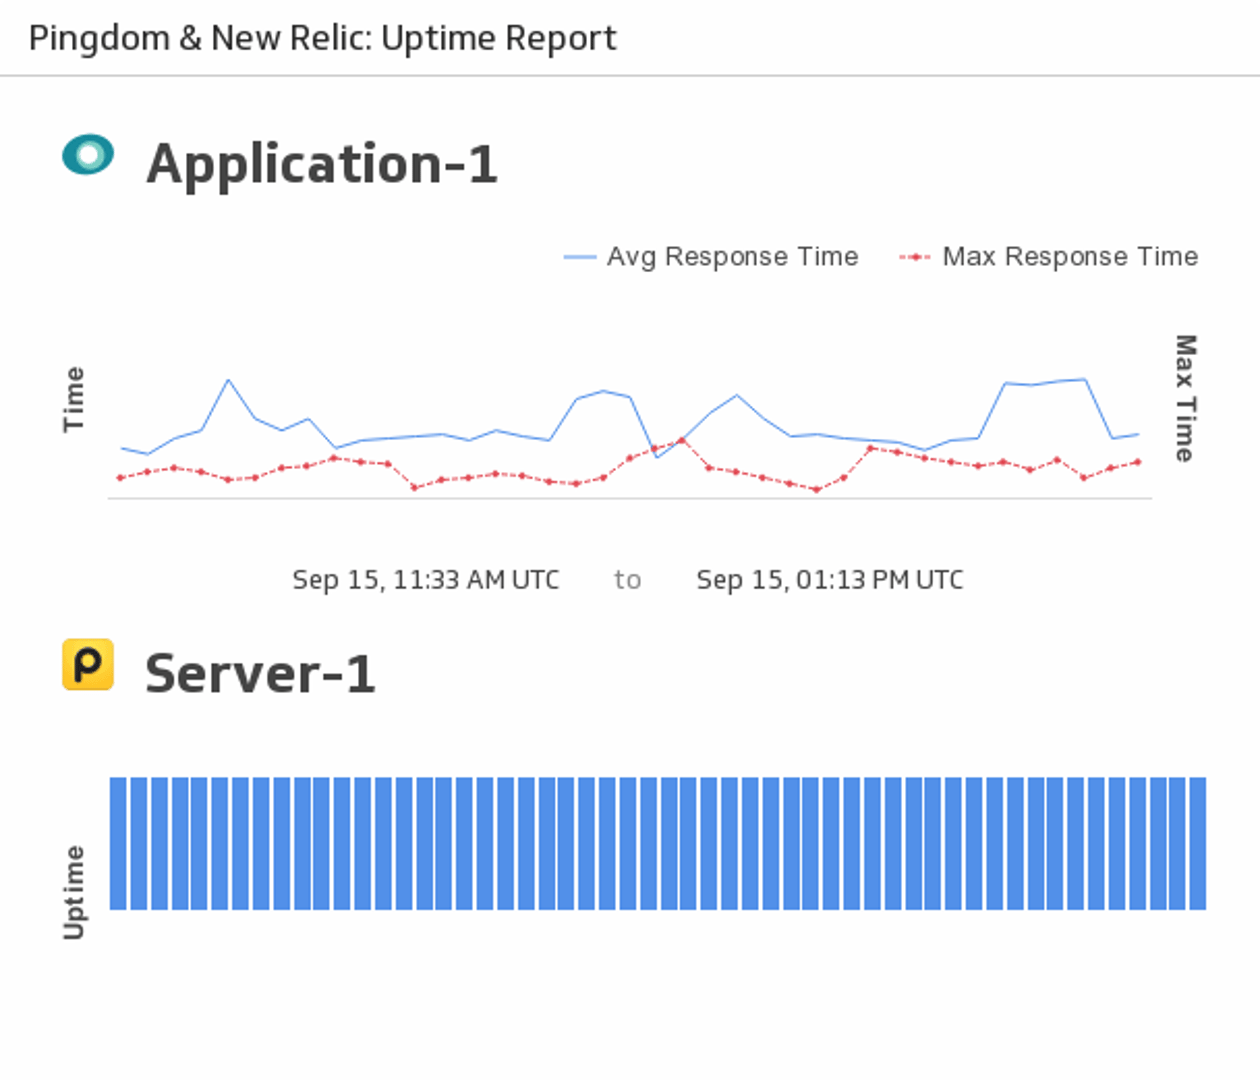
Uptime Report
Monitor the uptime of your chosen server using New Relic and Pingdom.
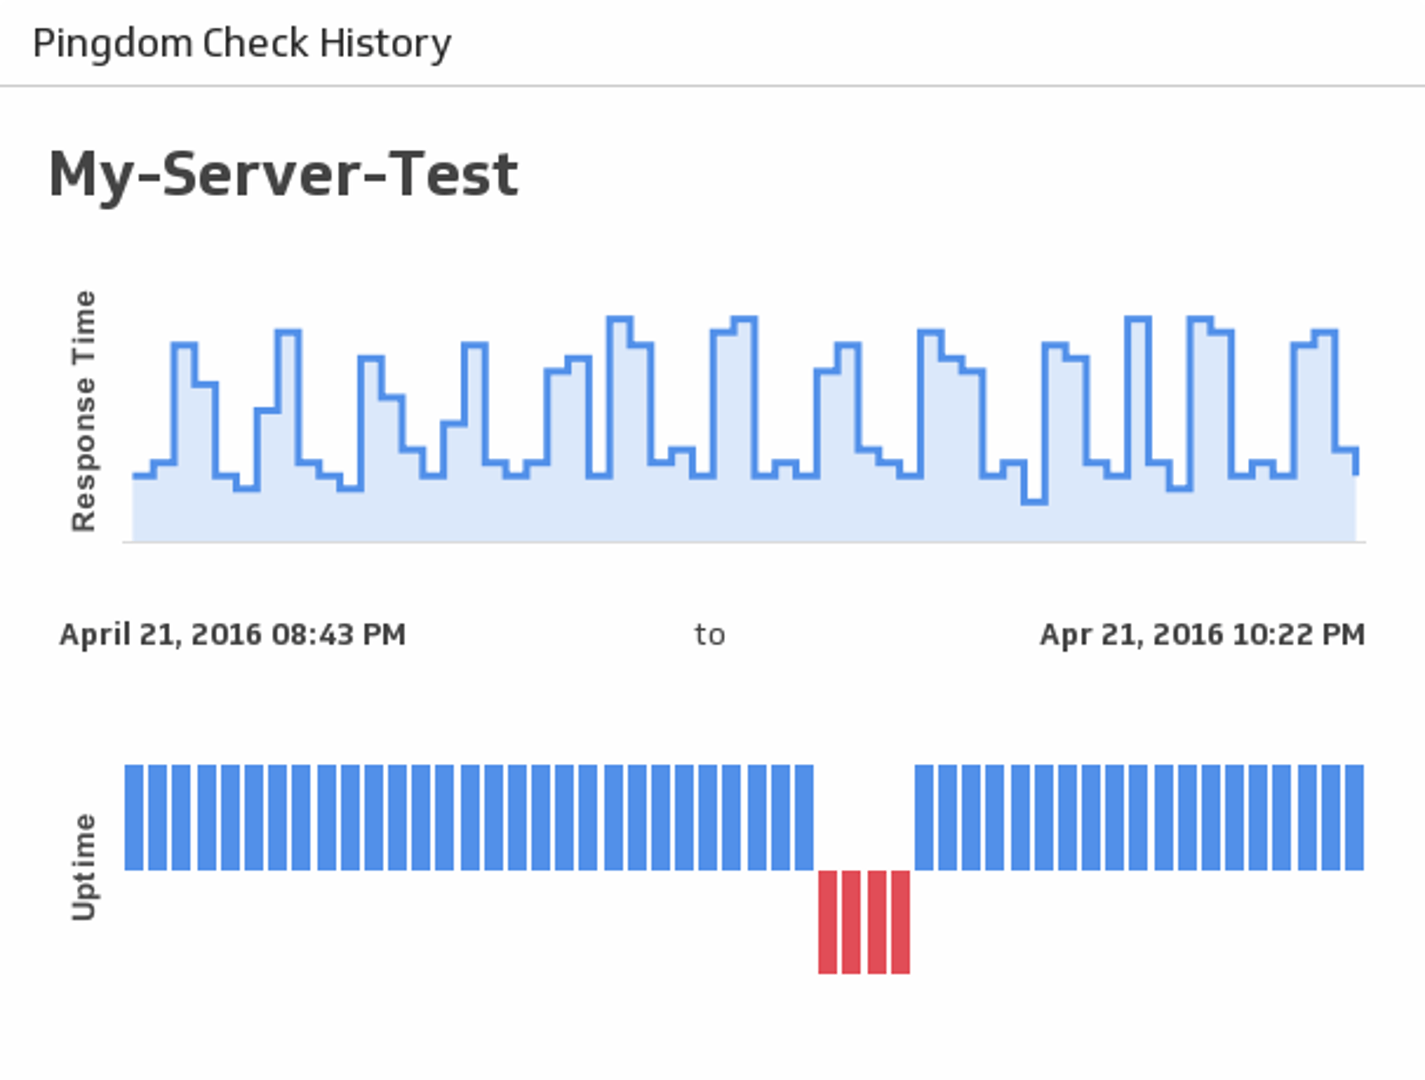
Check History
See historical uptime and response times for a server of your choice.
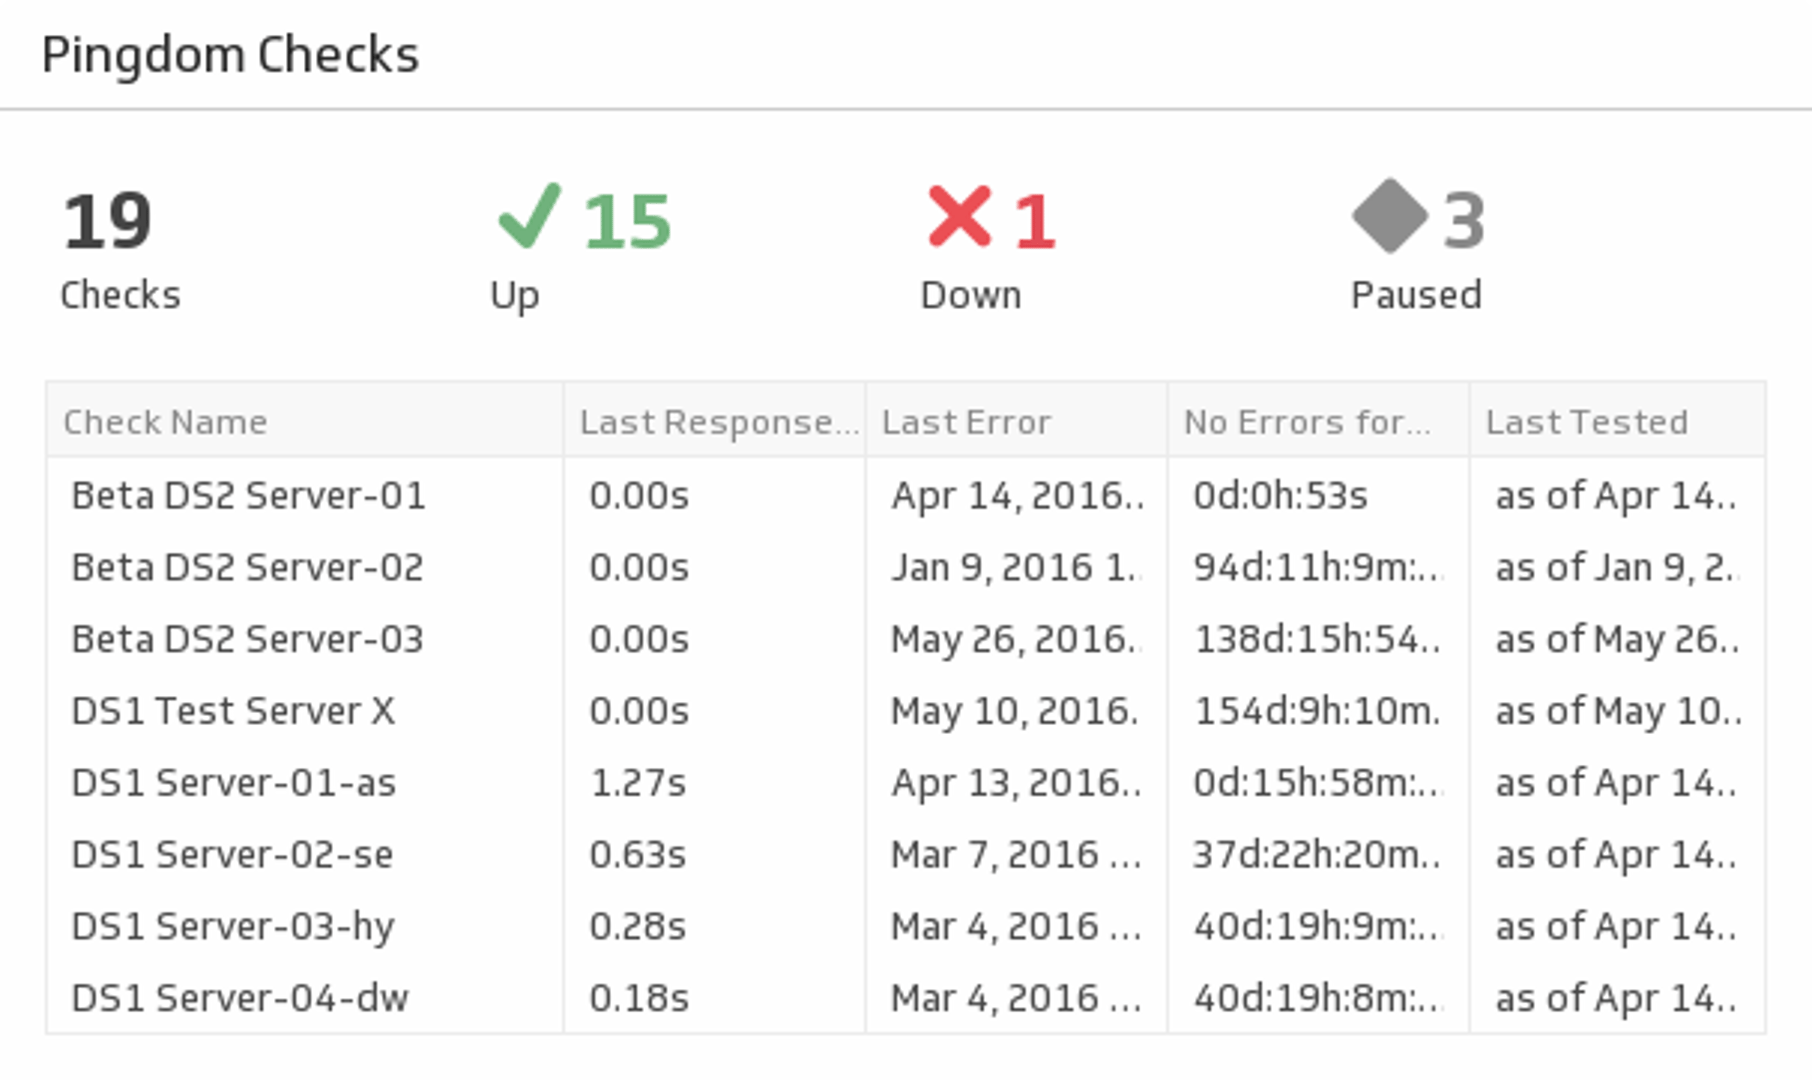
Checks Summary
See stats for your services including statuses, response times and error times.
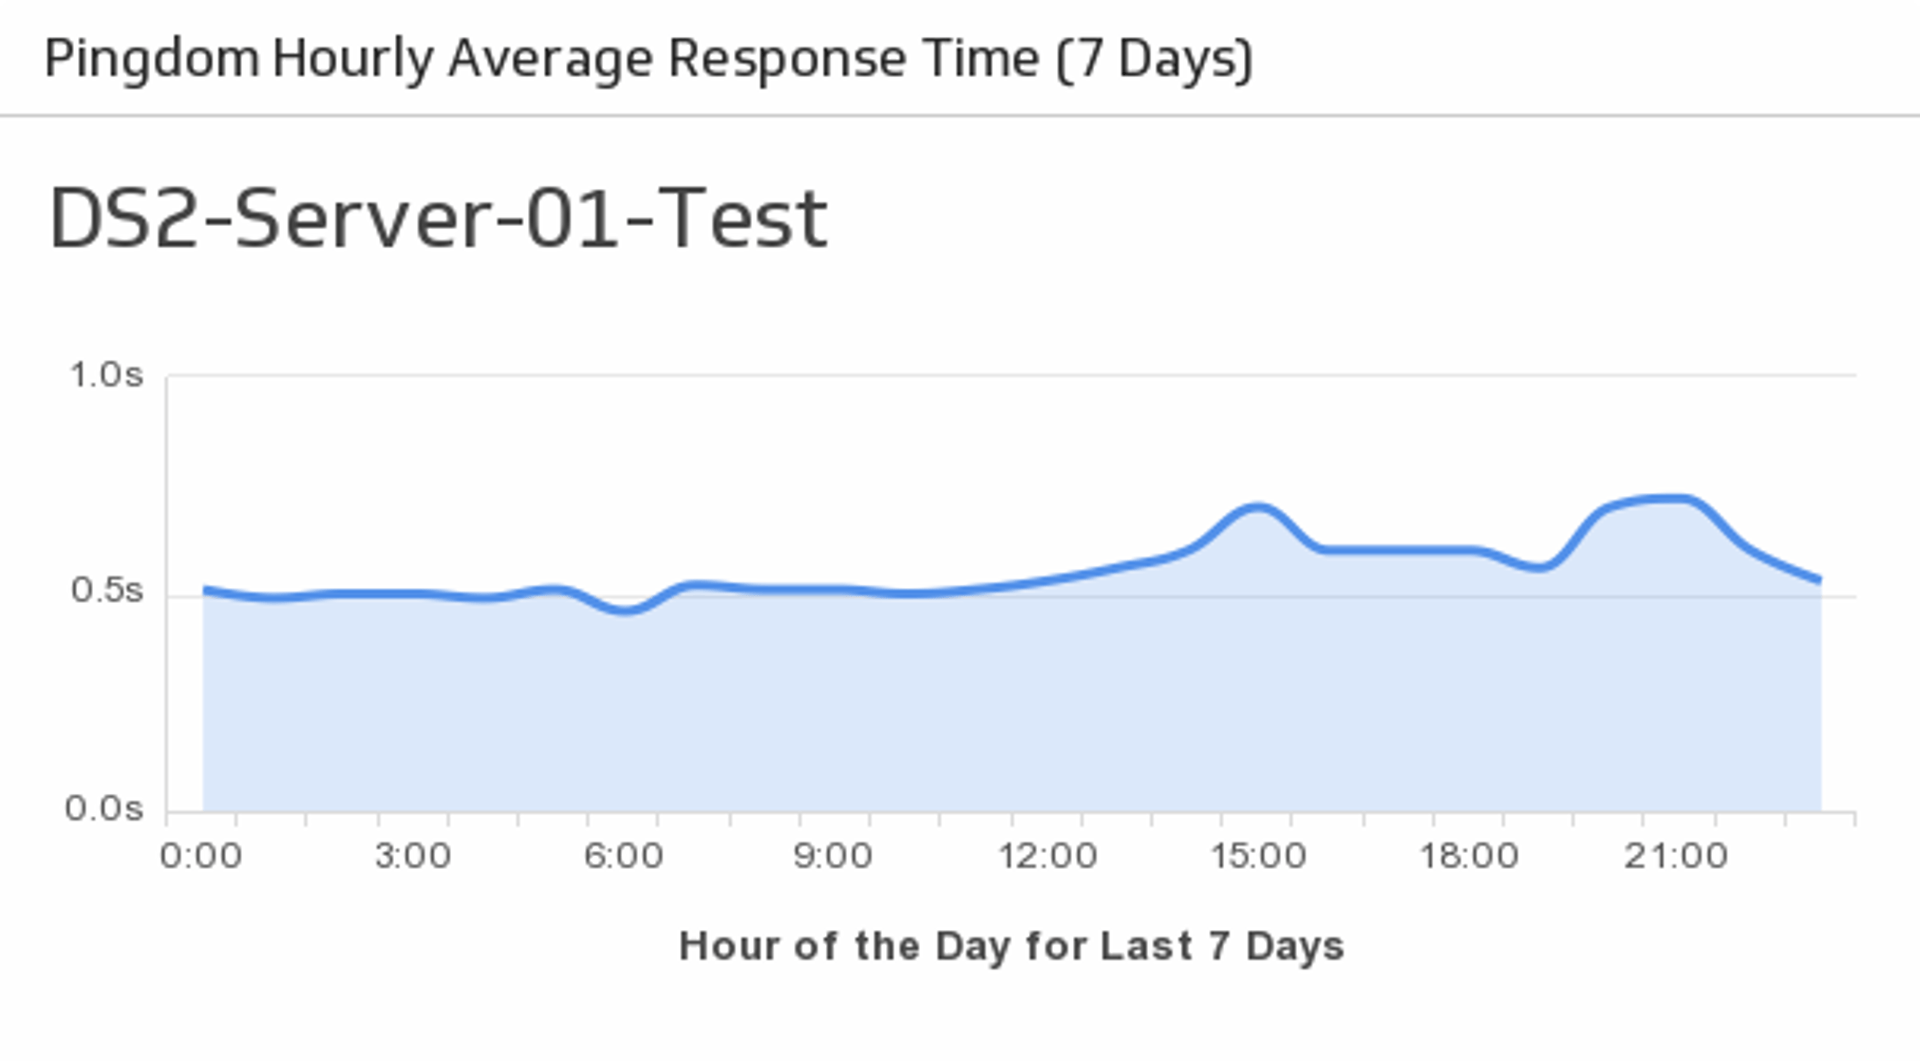
Hourly Average Response Time
Monitor the average response times for your specified server over the past week.
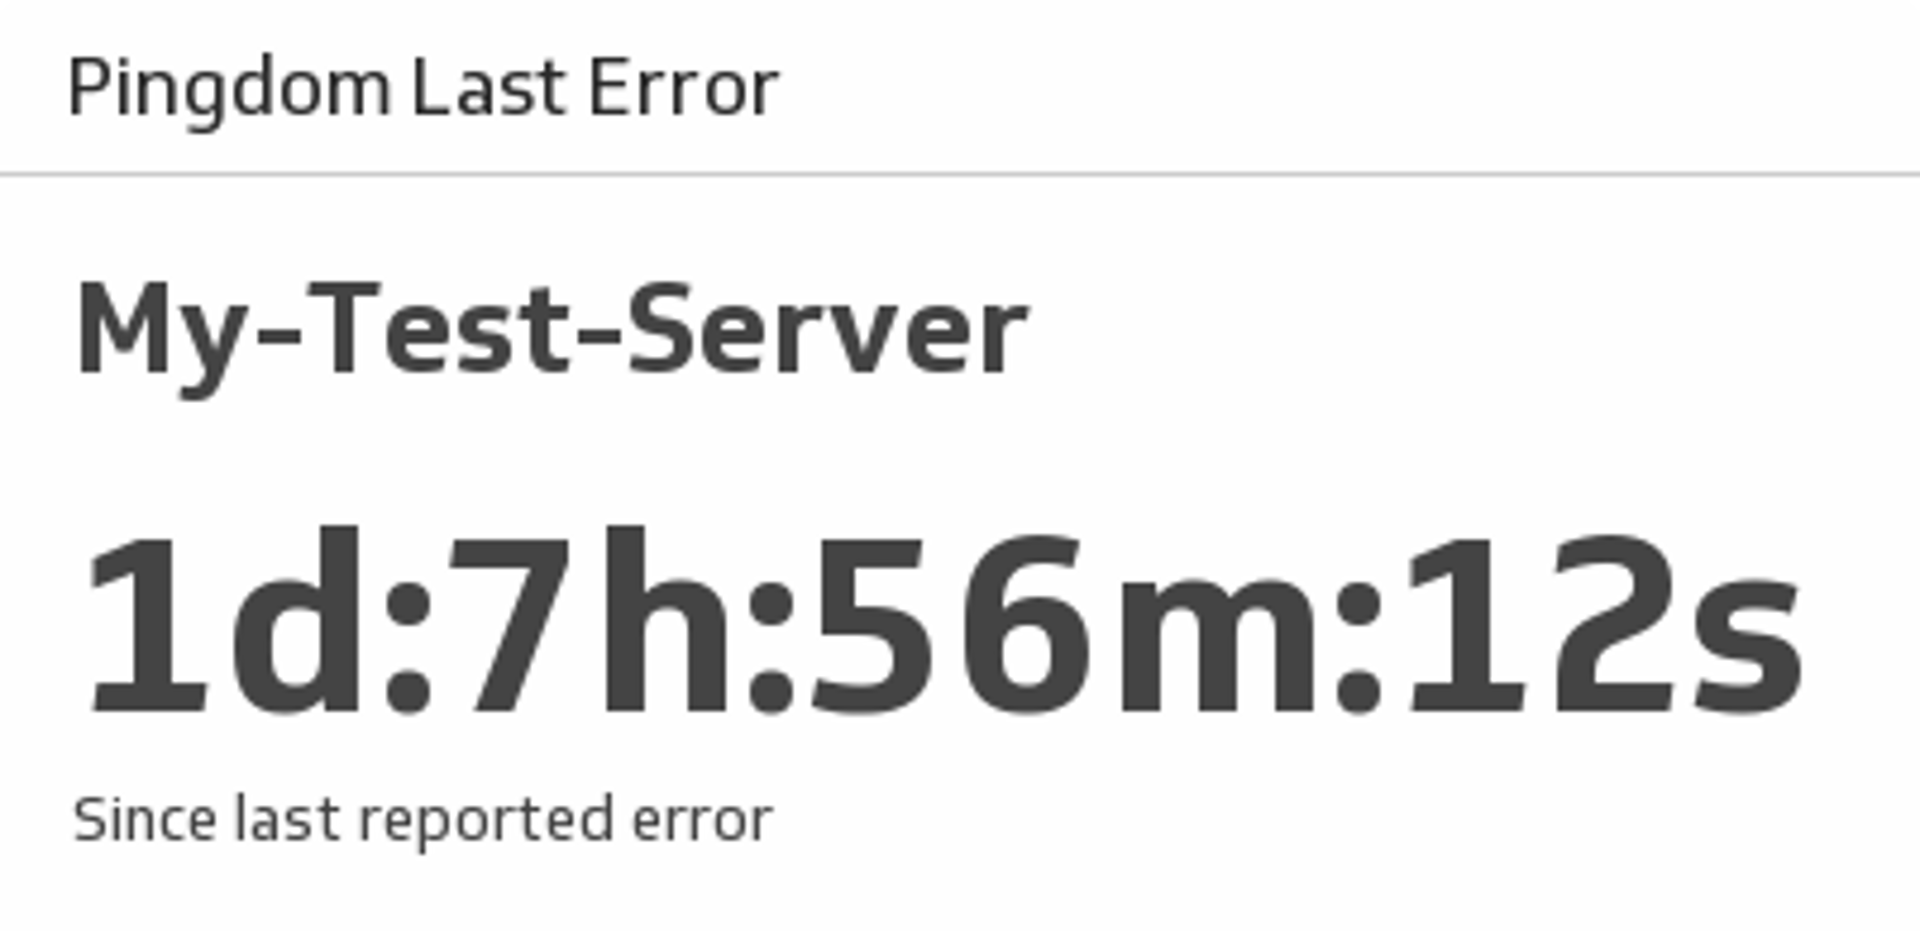
Last Error
See the amount of time that has passed since your last Pingdom error.
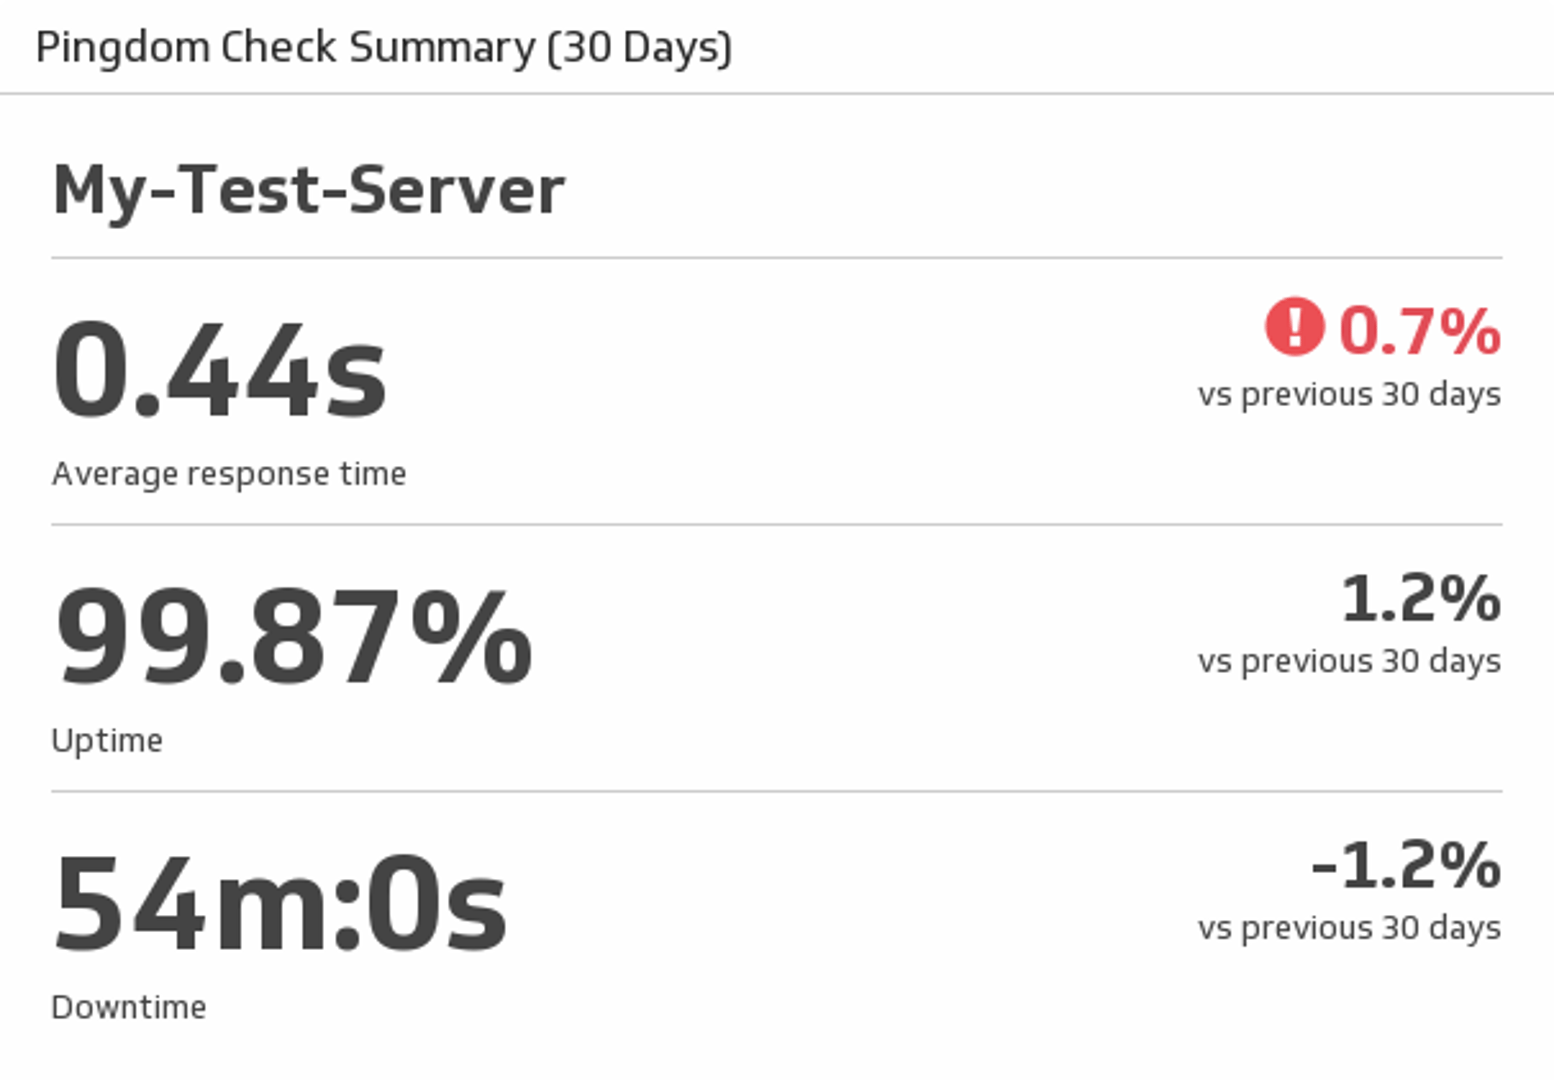
Server Overview
See average response time, uptime and downtime for a specified Pingdom server.
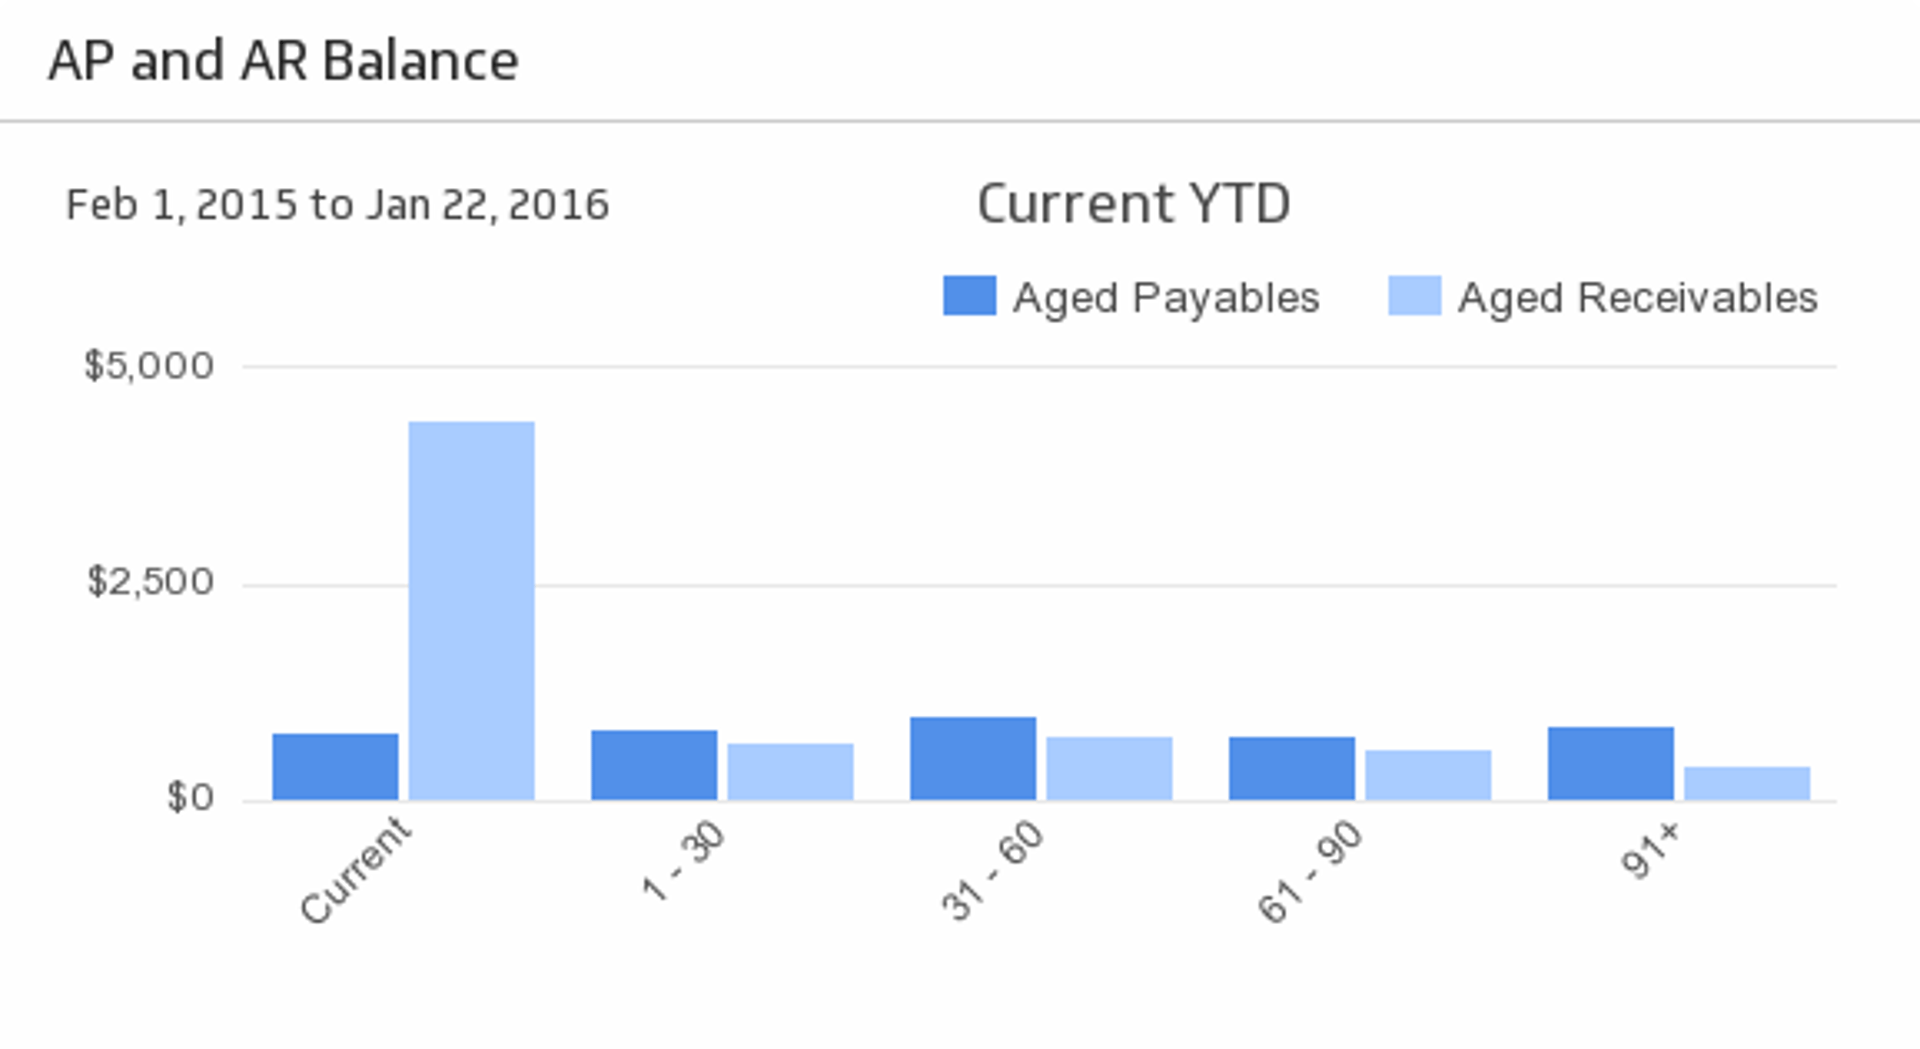
AP and AR Balance
See your Accounts Payable and Accounts Receivable at-a-glance during the time period of your choice.
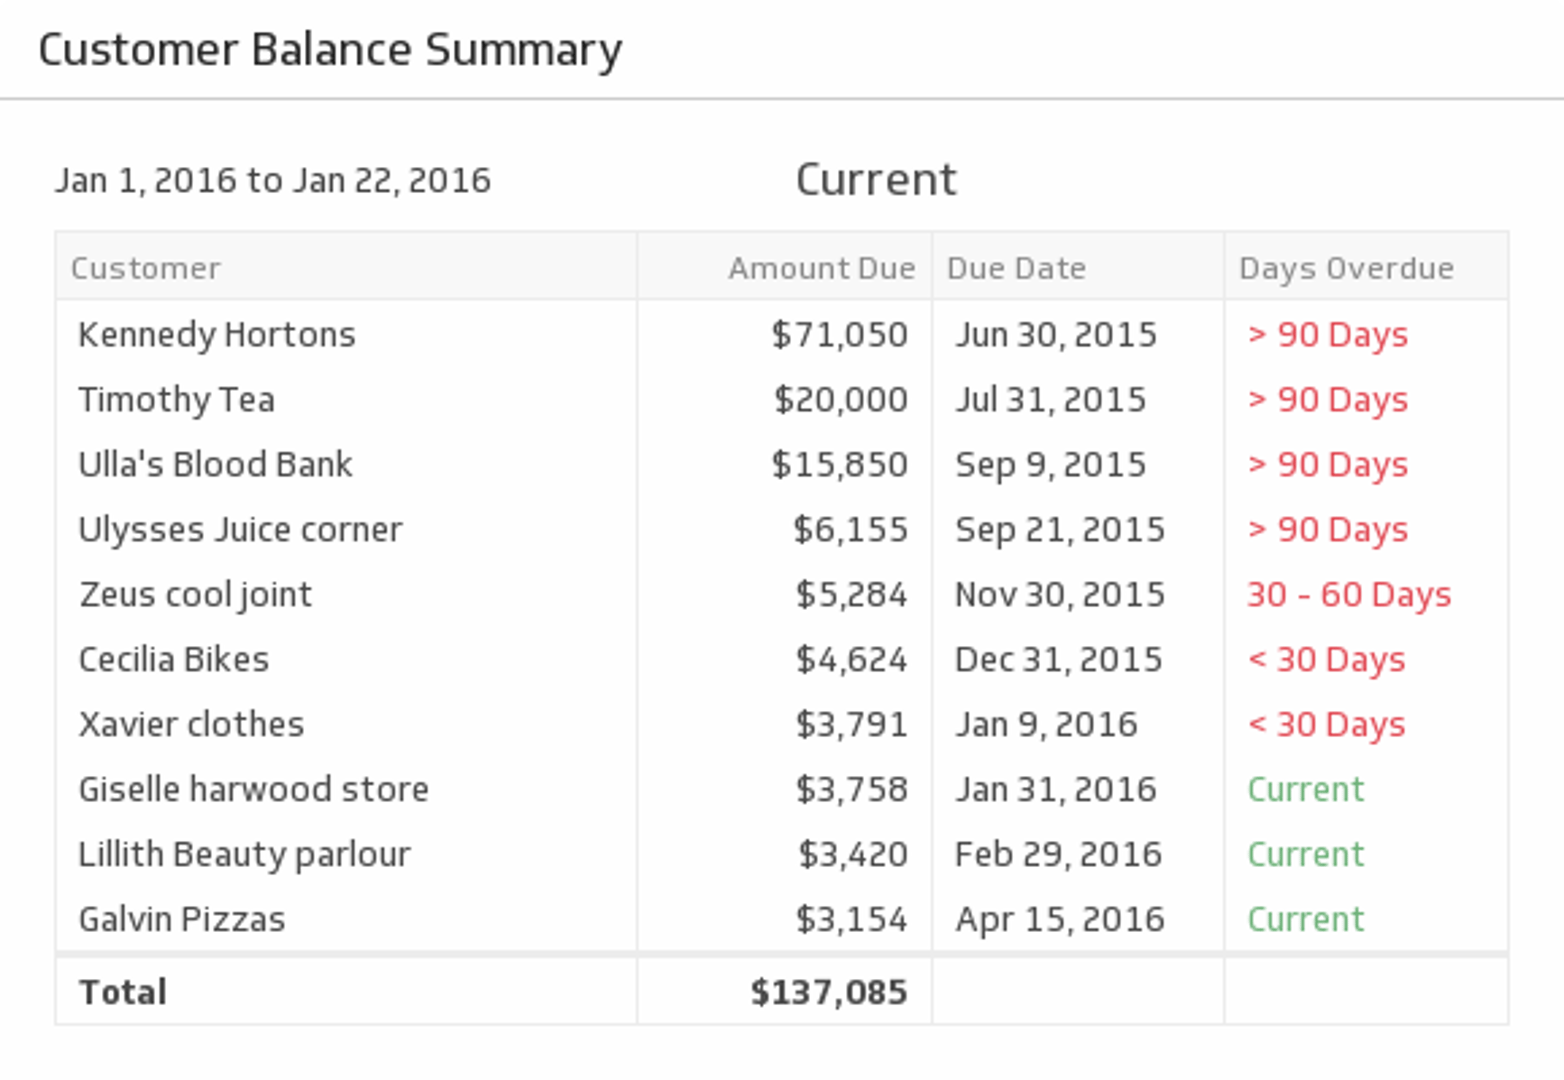
Customer Balance Summary
Cash-flow can make or break a venture. See which customers are current and which ones owe you money during the time period of your choice.
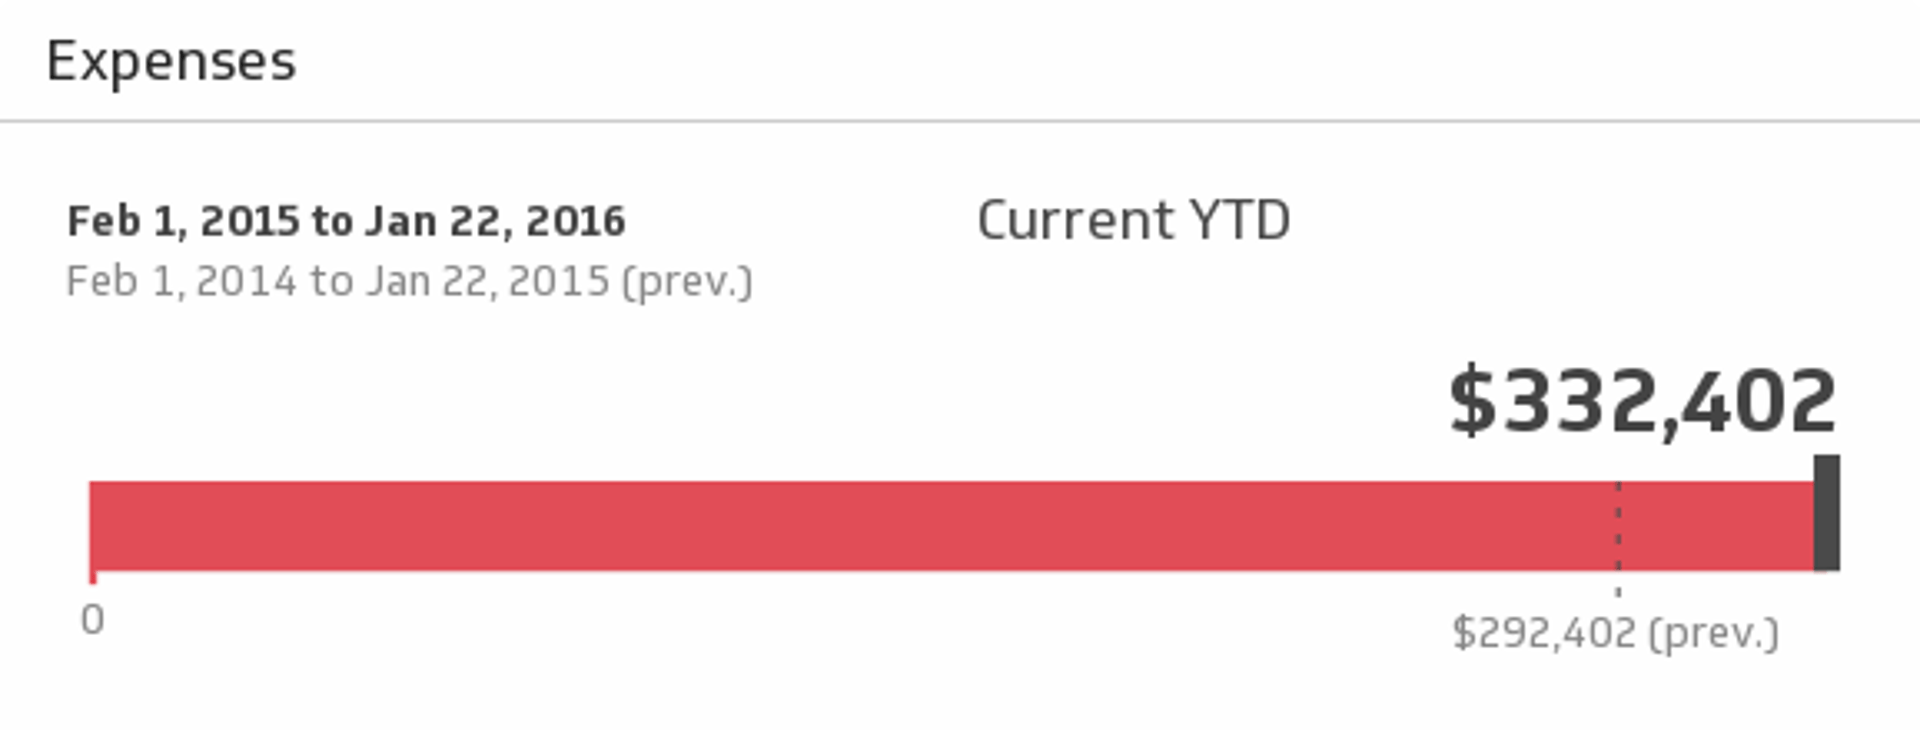
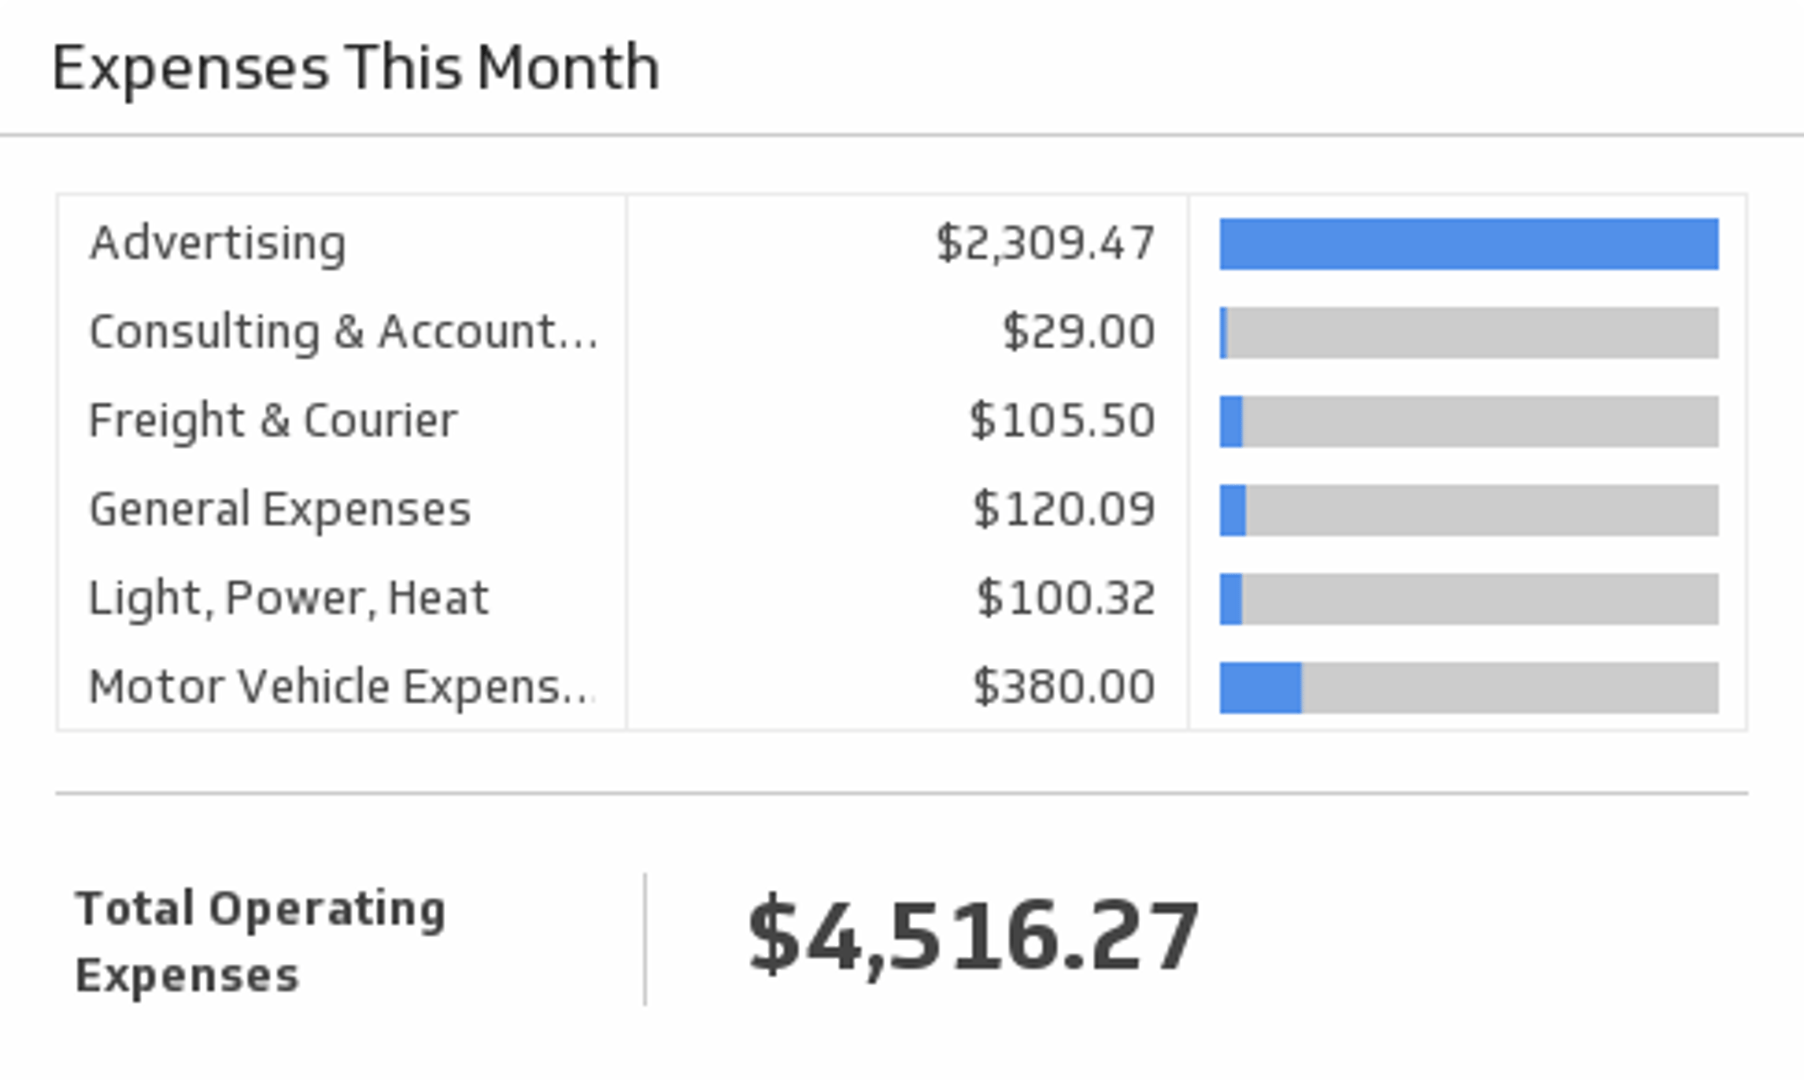
QuickBooks Expenses
You have to spend money to make money! Monitor your expenses for the time period of your choice and compare it to the previous period.
QuickBooks Income and Expenses
Bring your key accounting puzzle pieces - Income, Expenses, and Profit - together to help you make actionable decisions. Choose the time period of your choice from the drop-down menu, and compare to the previous period.
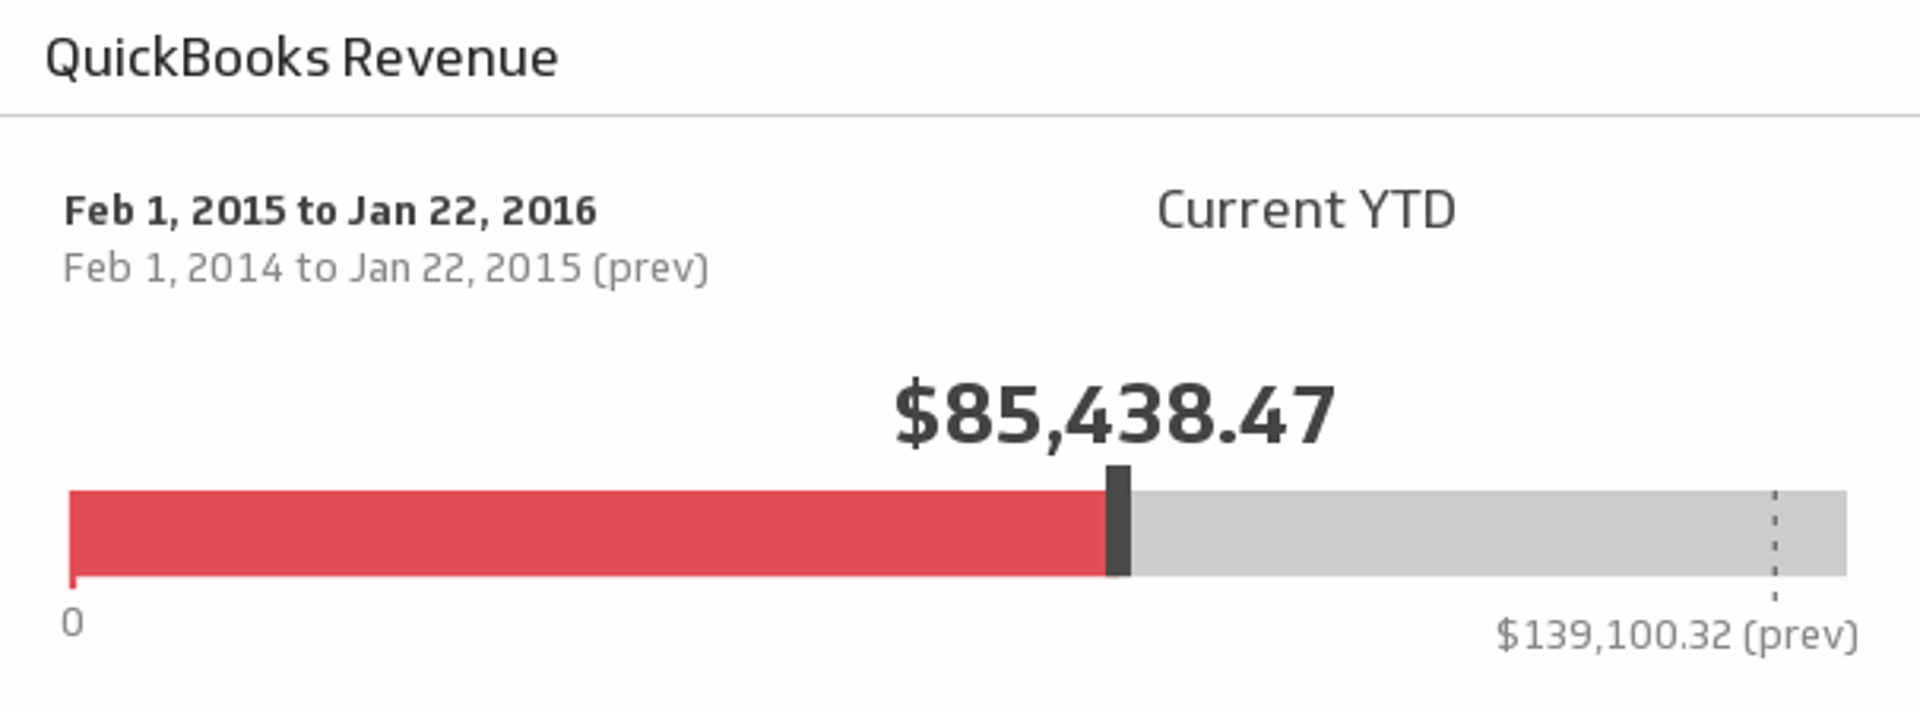
QuickBooks Revenue
Ensure the financial health of your business is in tip-top shape with this simple, real-time report on revenue for the time period of your choice.
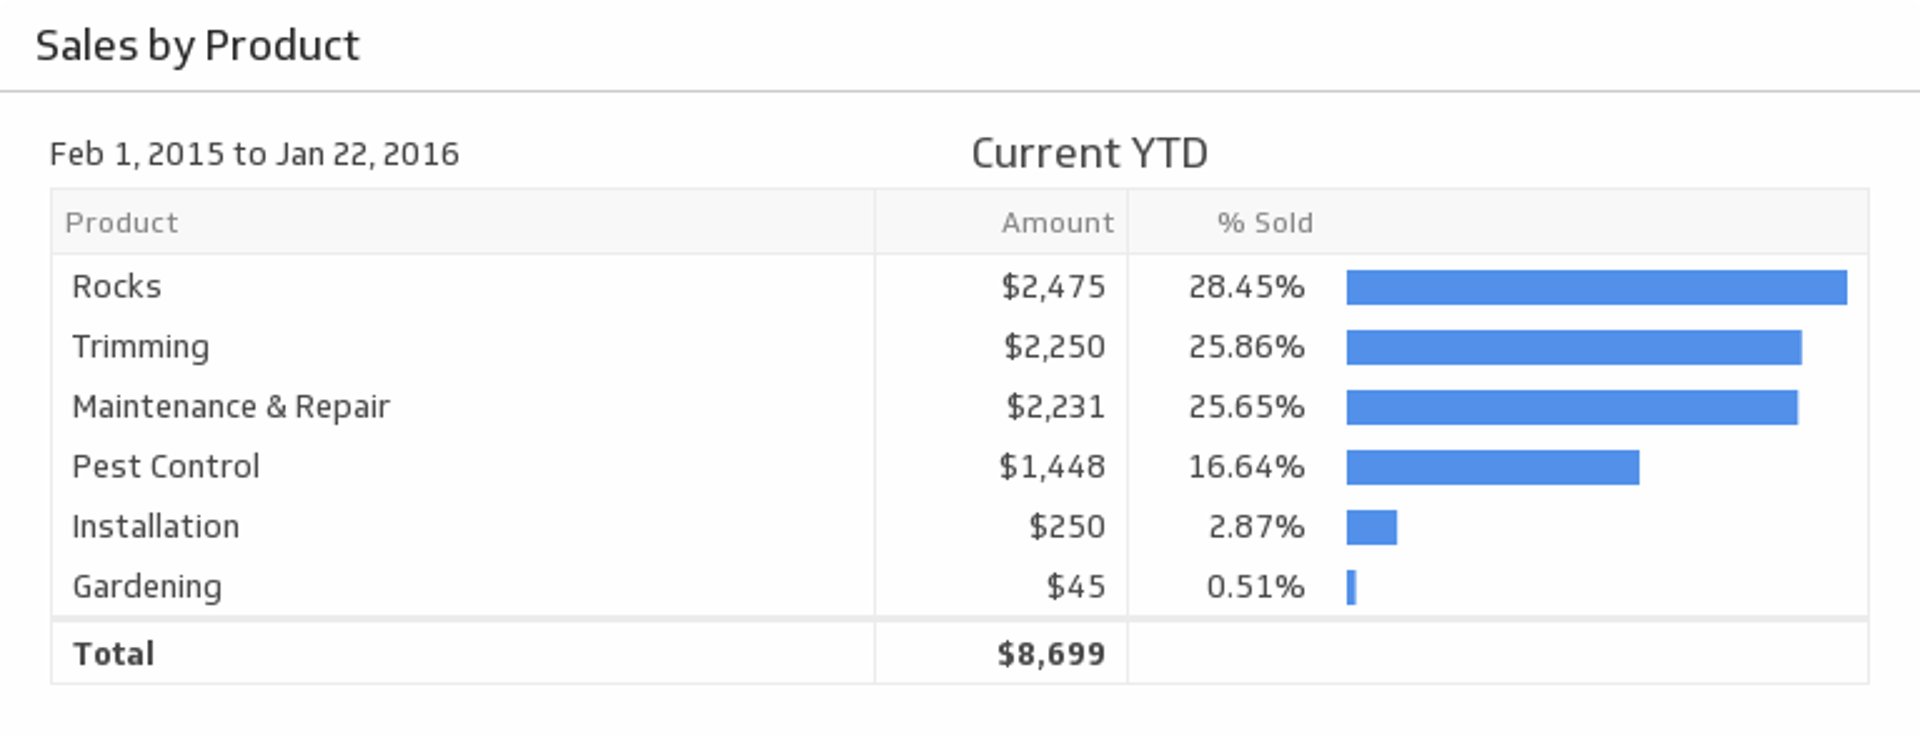
Sales by Product
Make sure your products are profitable by monitoring each of their sales metrics during the time period of your choice.

Marketing Expenses and Sales
Mash up your QuickBooks and Shopify data to see your Marketing Expenses and Sales for the last 30 days.
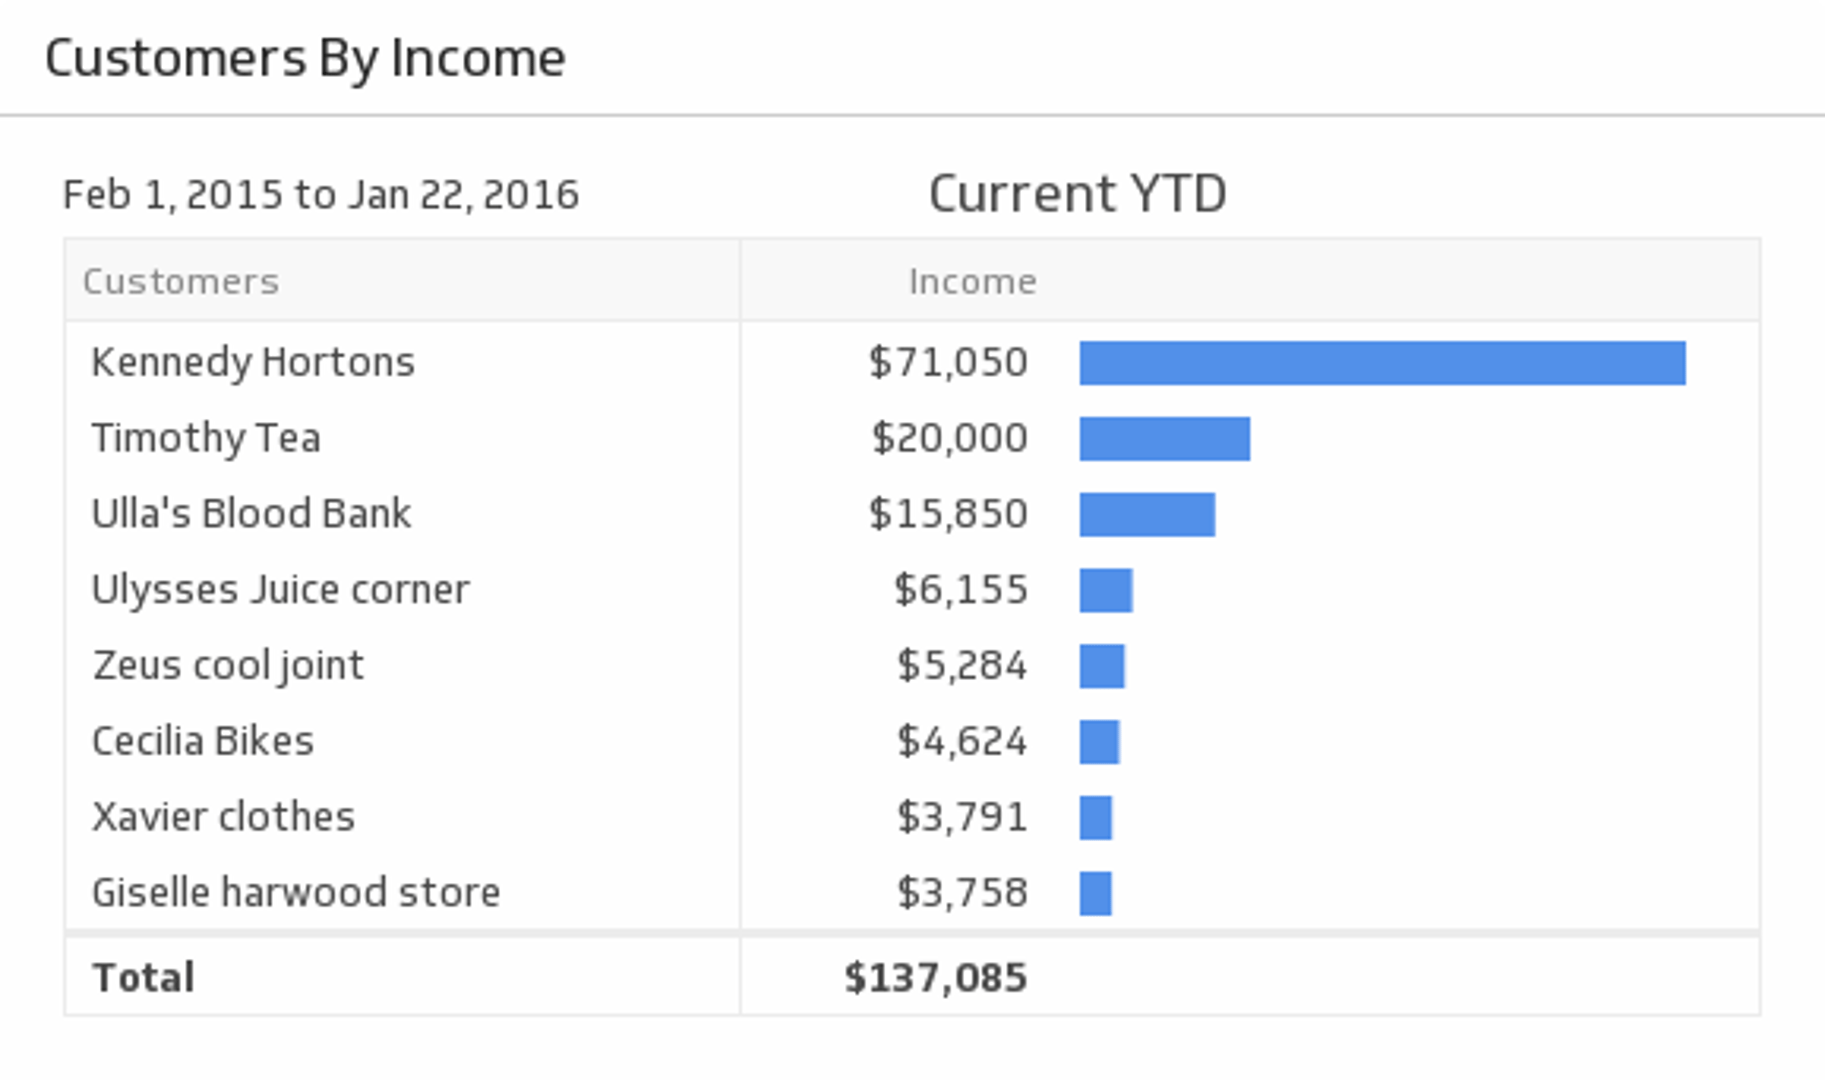
Top 10 Customers by Income
Gain a steady flow of profitable clients by monitoring your top 10 income-earning customers during the time period of your choice.
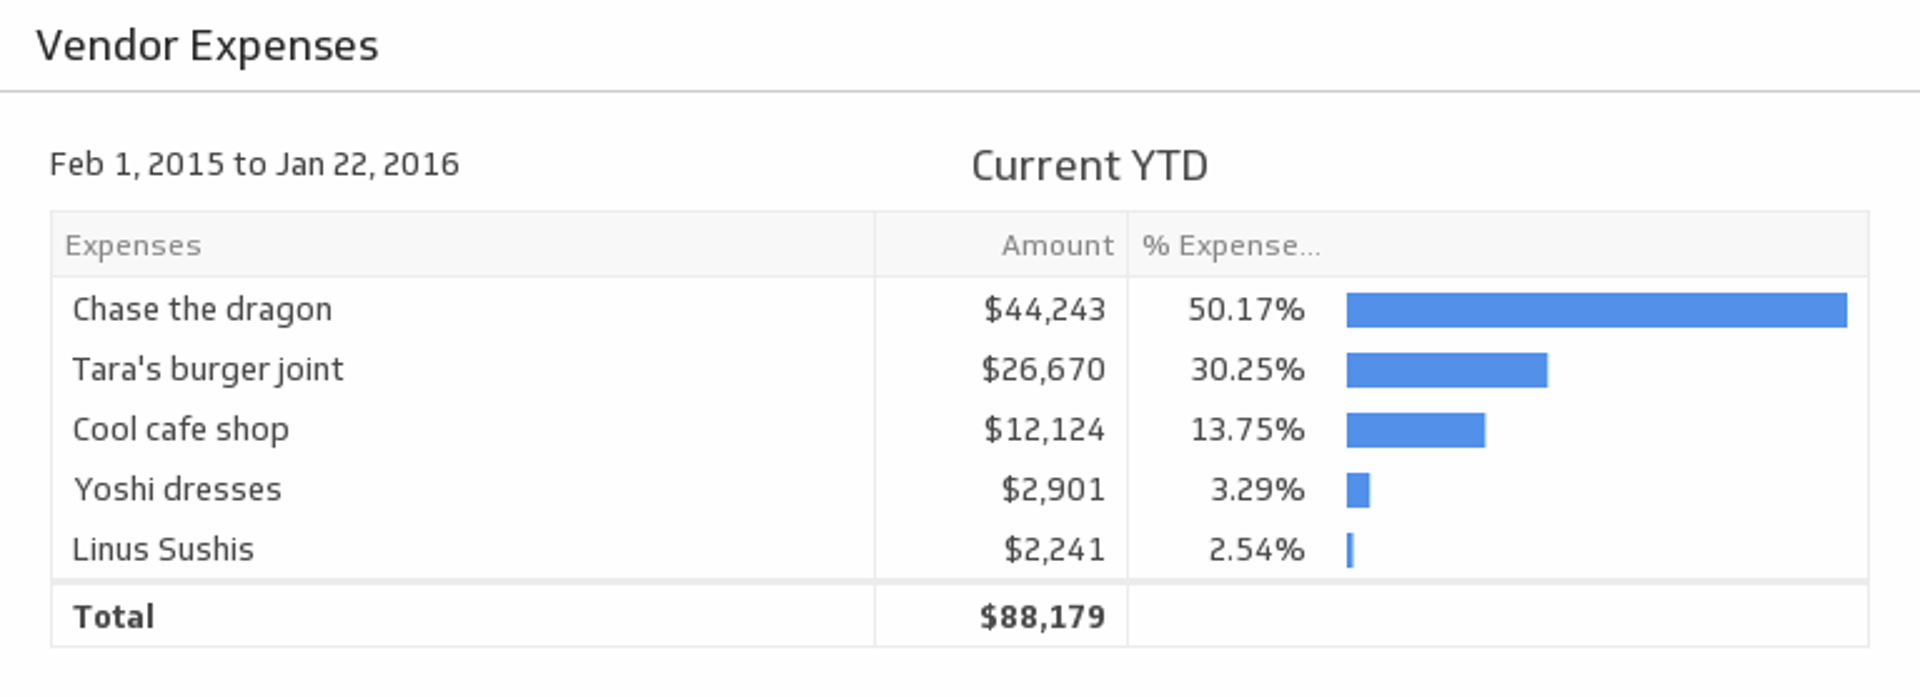
Vendor Expenses
Monitor your vendor expenses on an ongoing basis. Delve into individual vendor expenses and see the total for the time period of your choice.
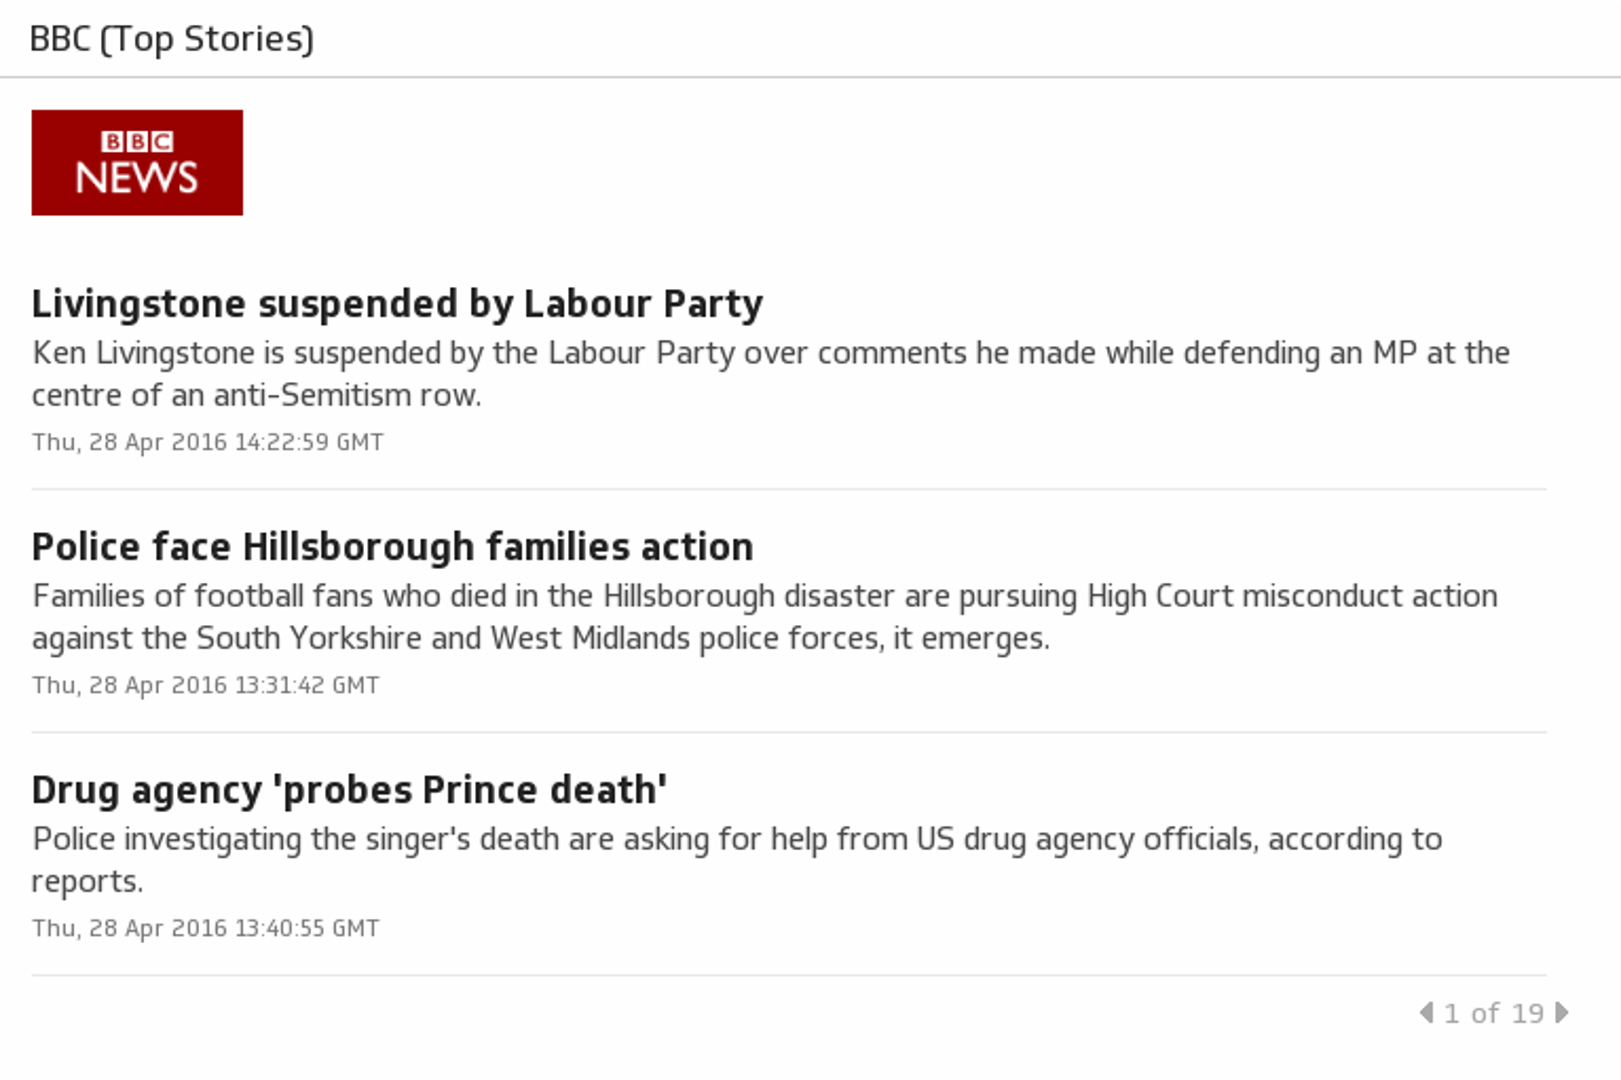
BBC (Top Stories)
BBC News provides trusted World and UK news as well as local and regional perspectives.
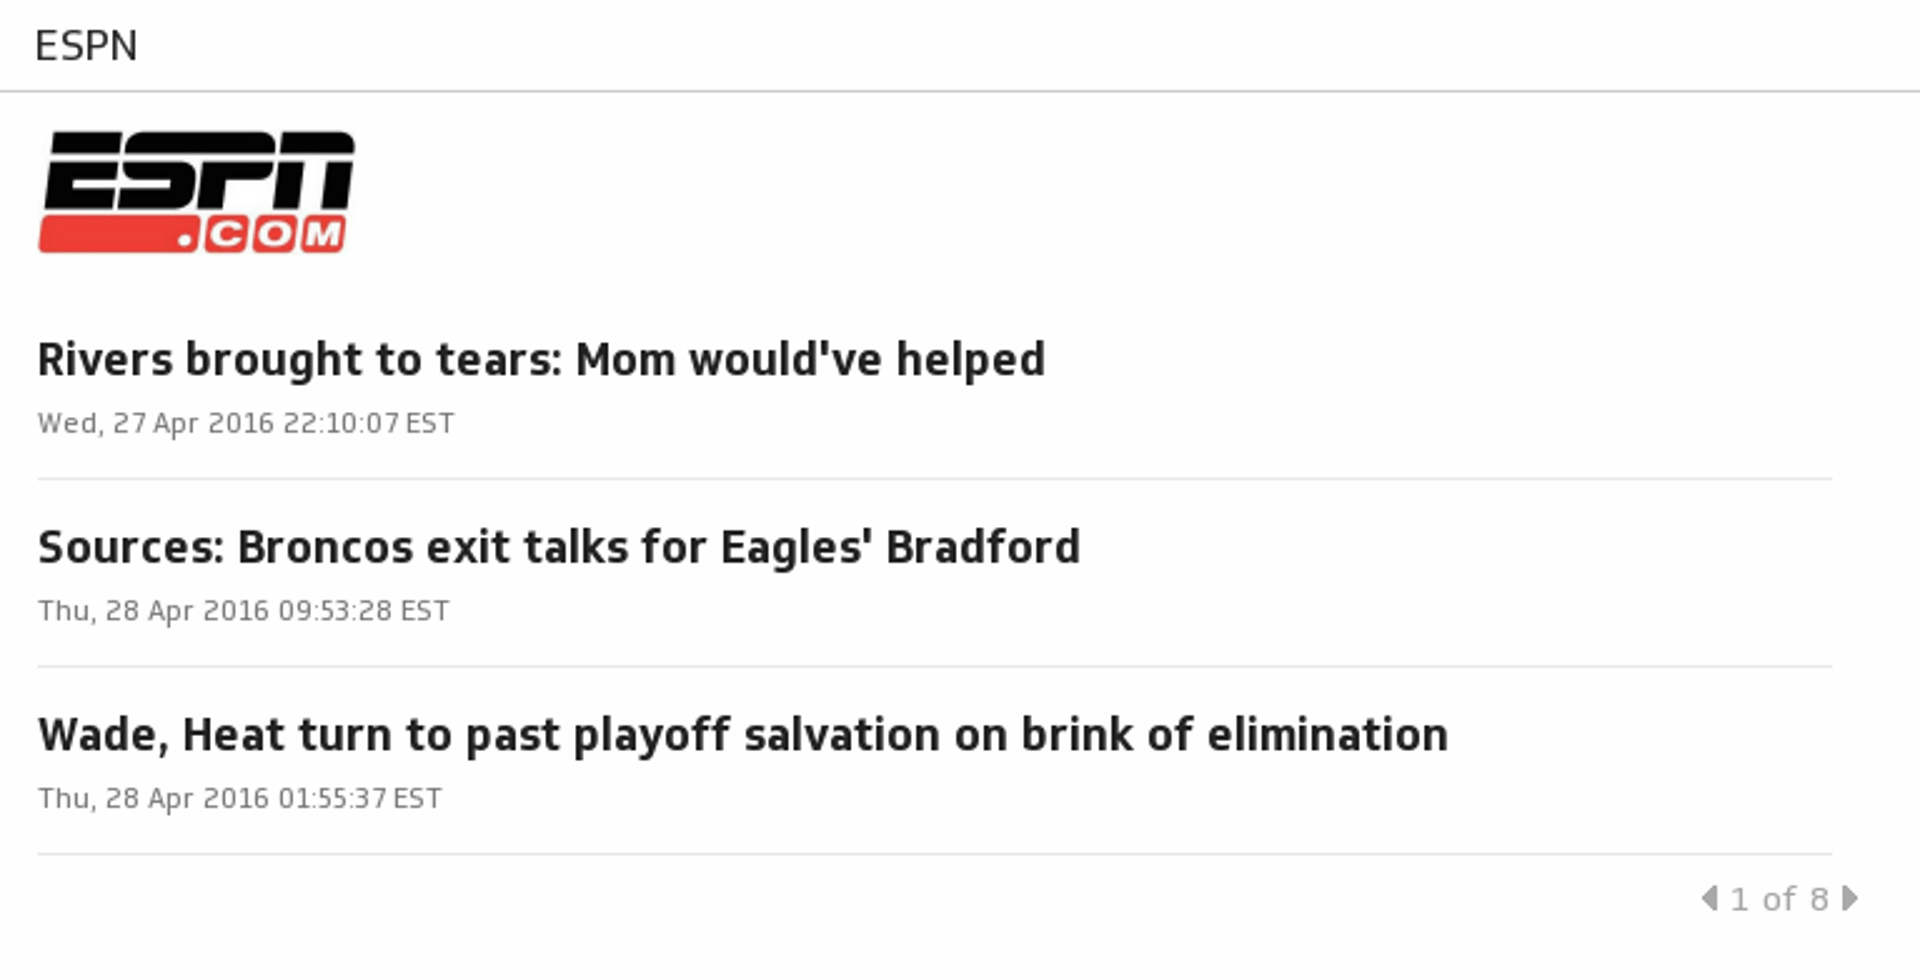
ESPN
Get sports news coverage, highlights and commentary for NFL, MLB, NBA, College Football, NCAA Basketball and more.
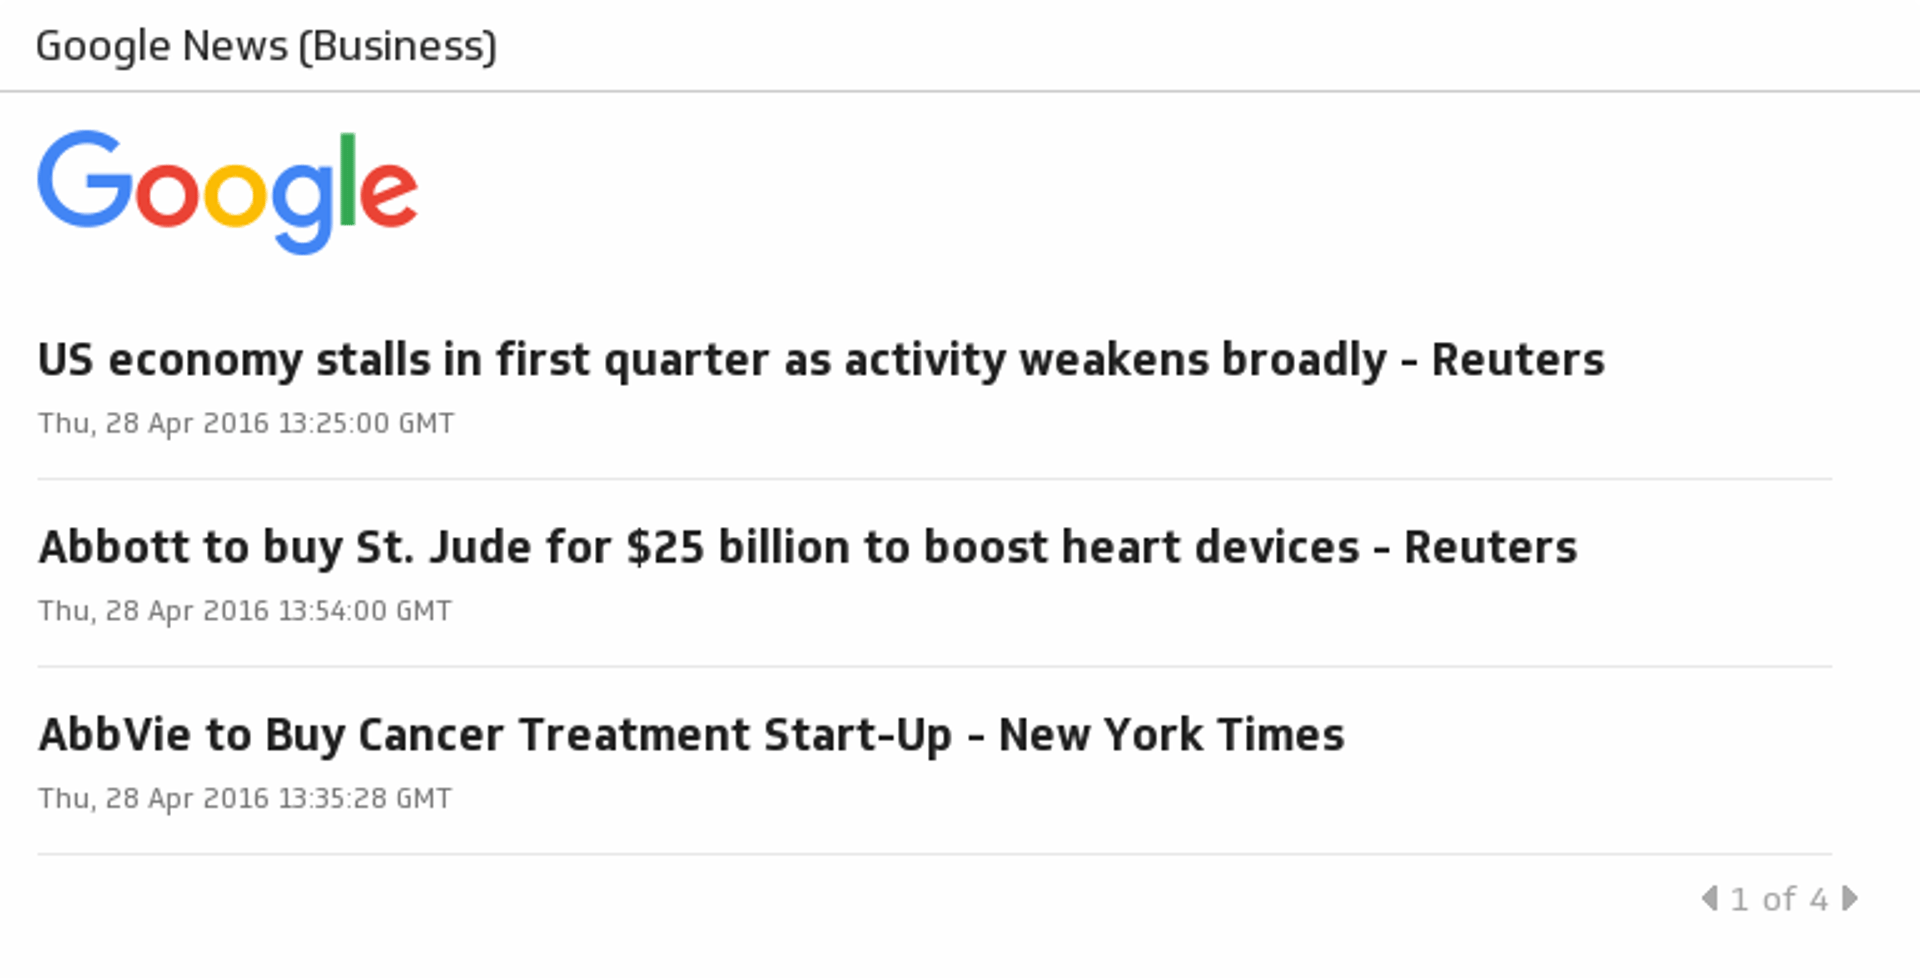
Google News (Business)
Get the latest on business stories, company news, world economy, stocks, finance, investments, market trends and more with the Business section of Google.
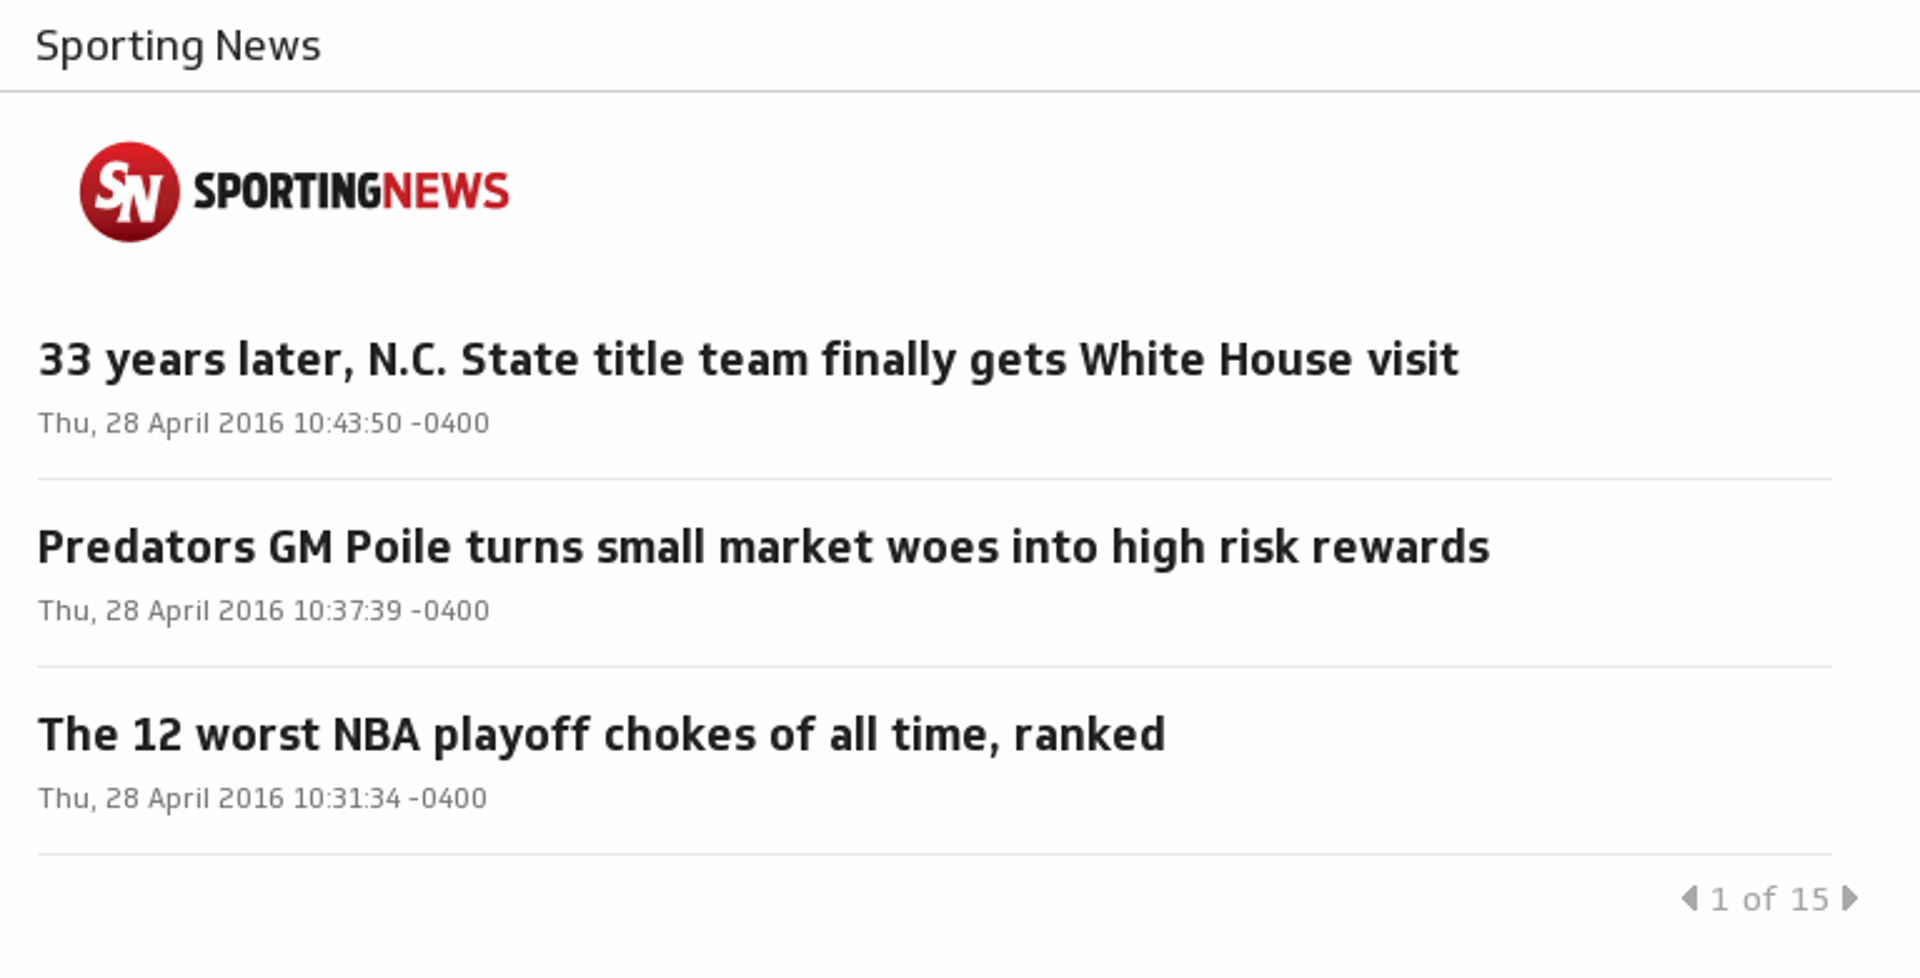
Sporting News
Get the latest sports news, video, analysis and better info. Covering the NFL, MLB, NBA, NHL, NASCAR, college football and basketball, soccer and more.

The Australian (Business)
Find the latest business news and stock market news from The Australian.
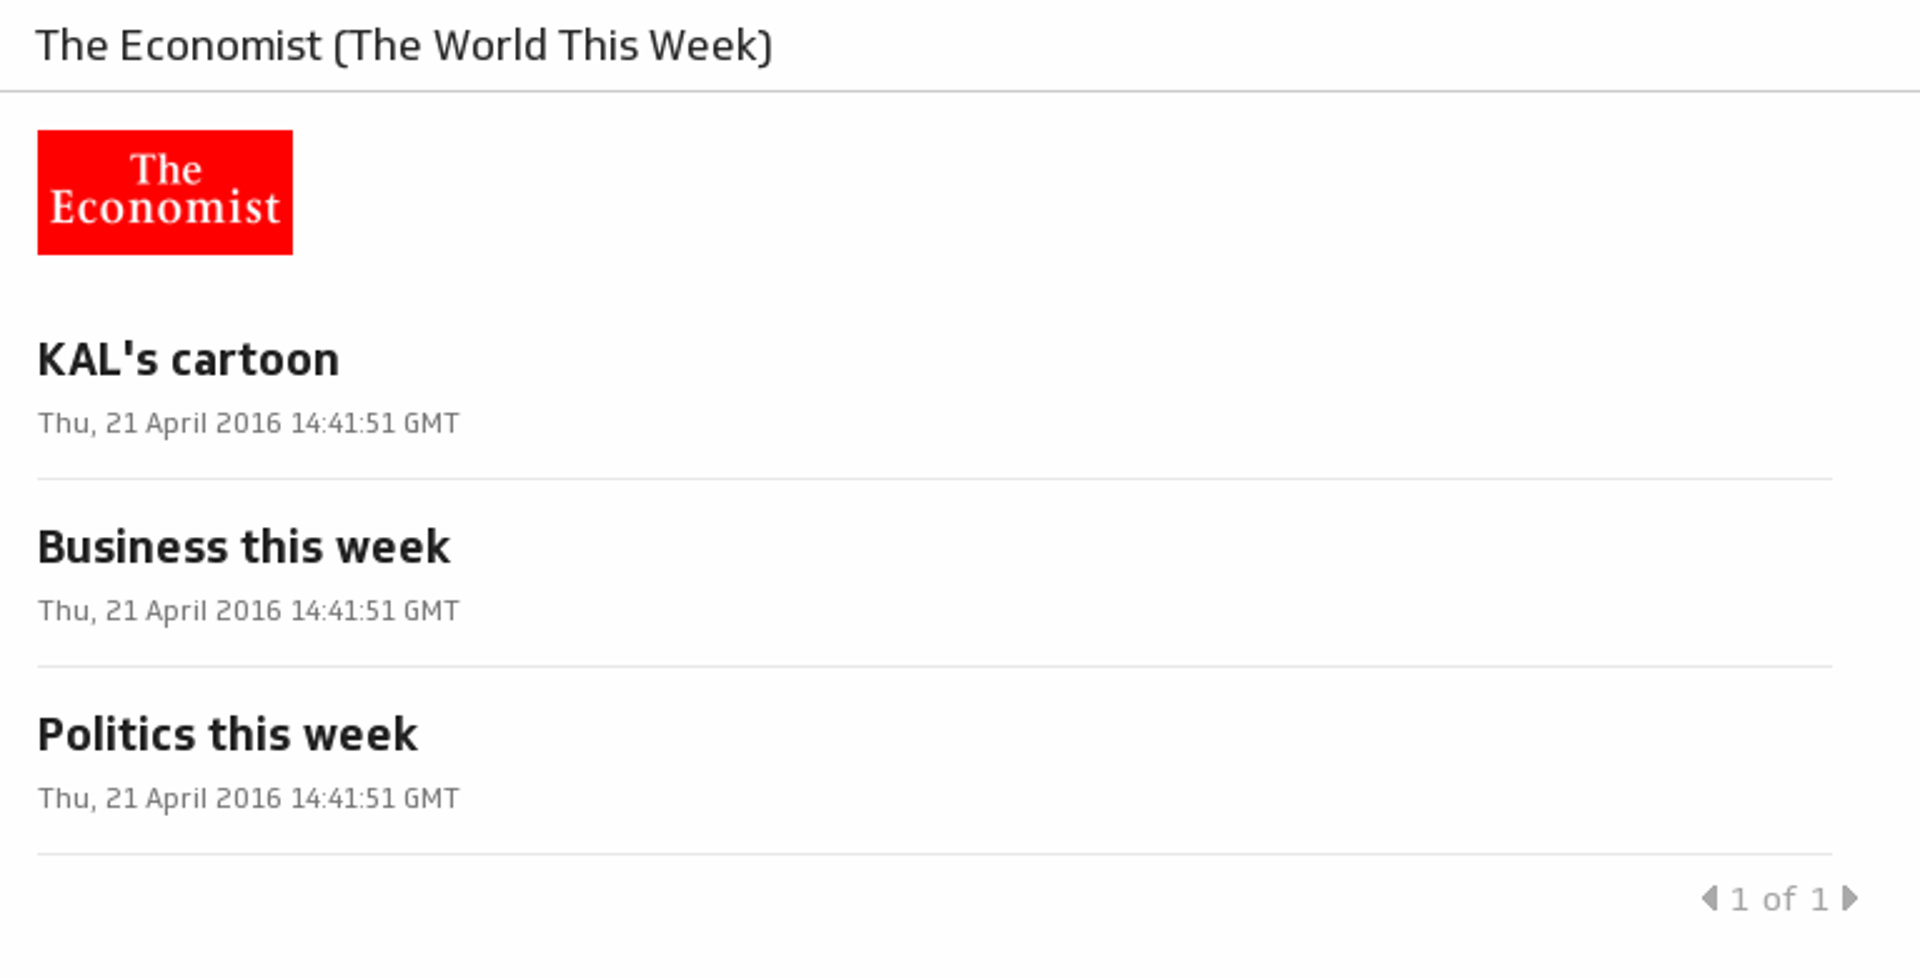
The Economist (The World This Week)
Getting real time updates on leading business news keeps you informed, without having to waste time navigating through news websites or searching through print media every morning.

Washington Post (World News)
The Washington Post World section provides information and analysis of breaking world news stories.
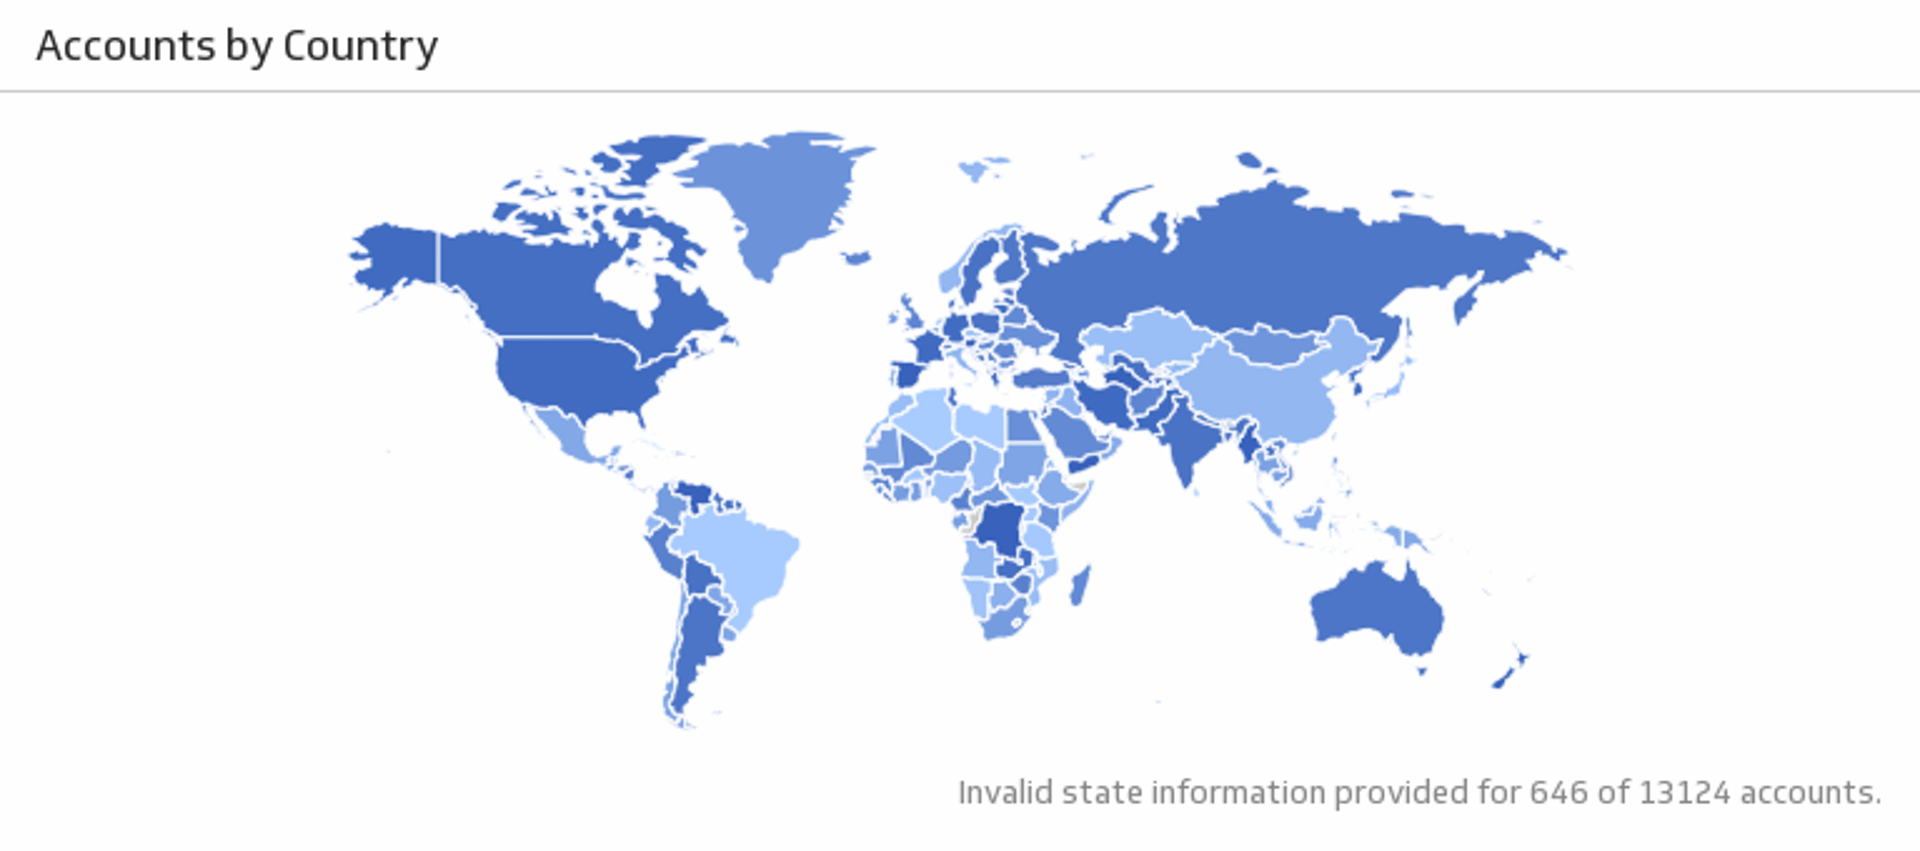
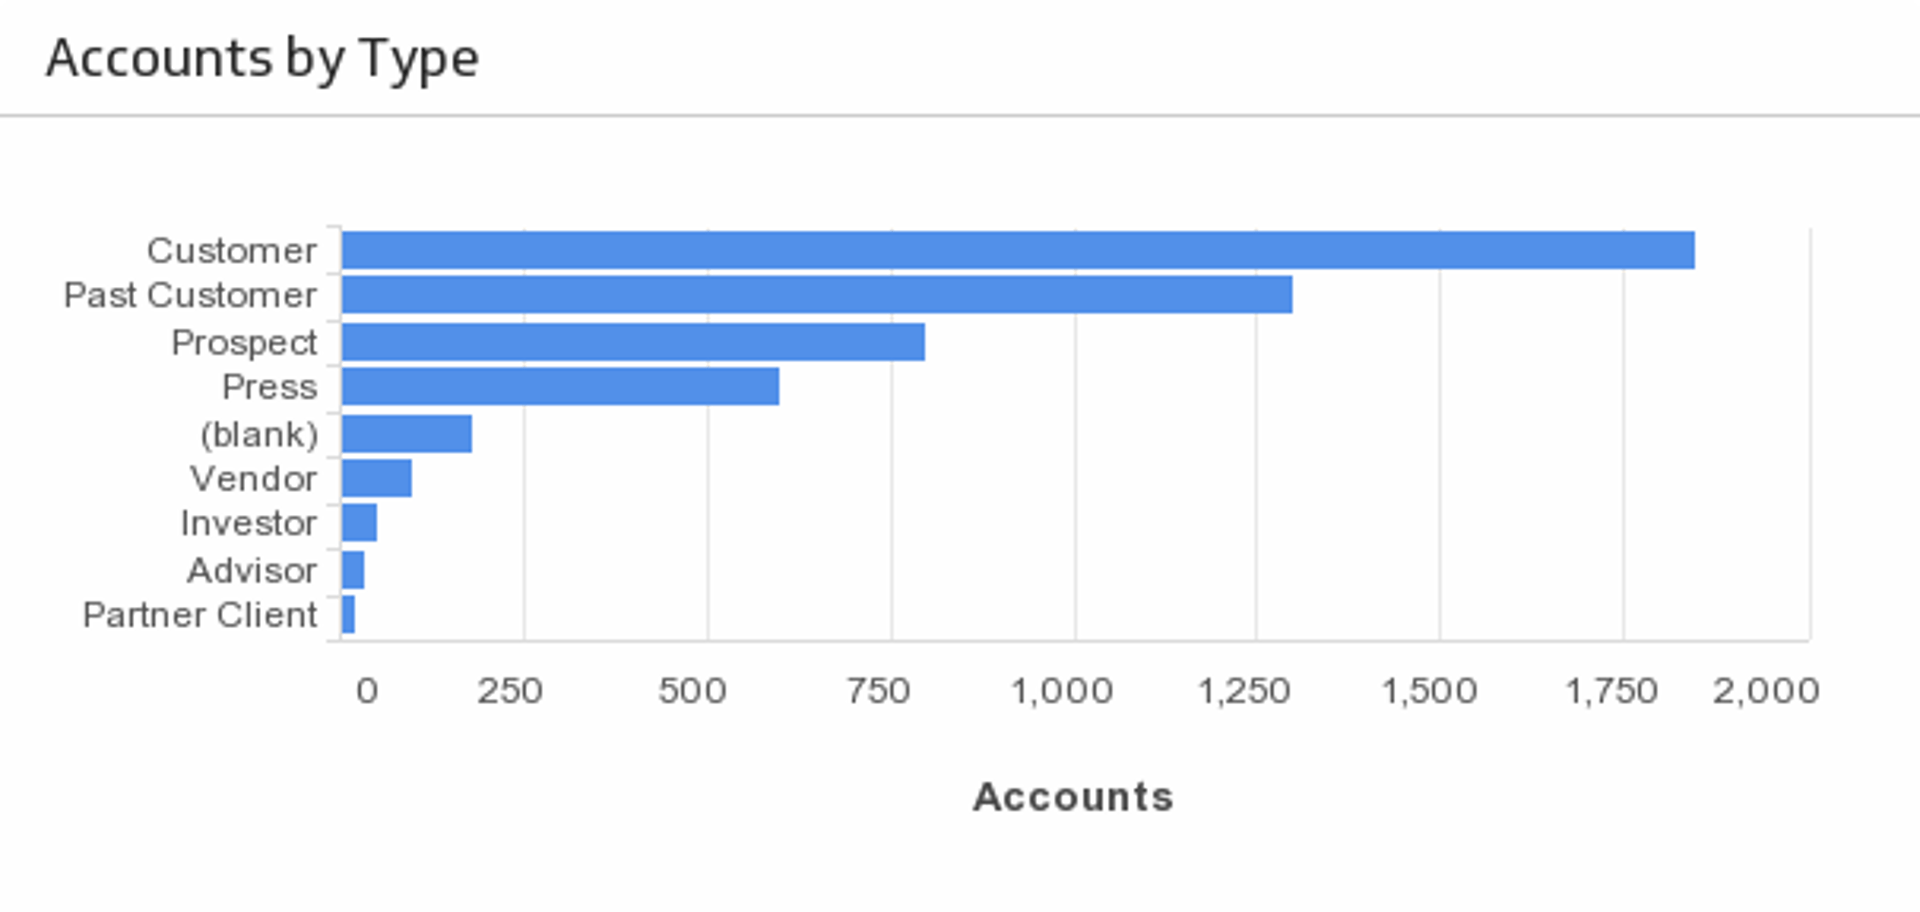
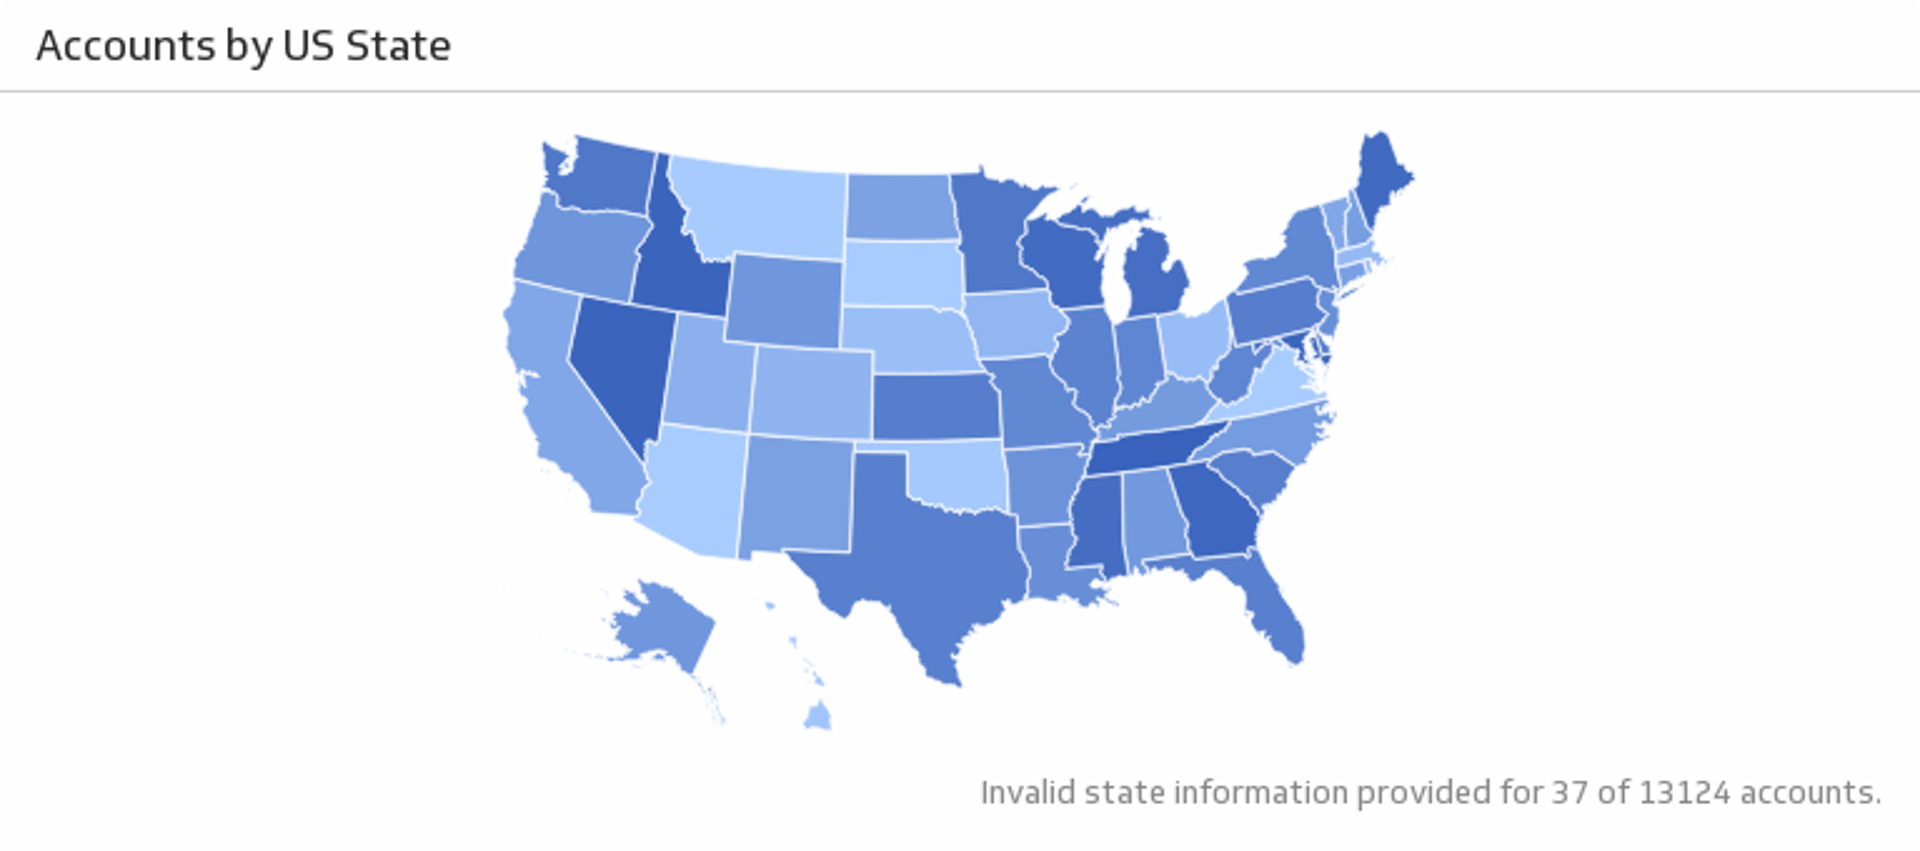
Accounts by U.S. State
See the location of your U.S. Salesforce accounts.
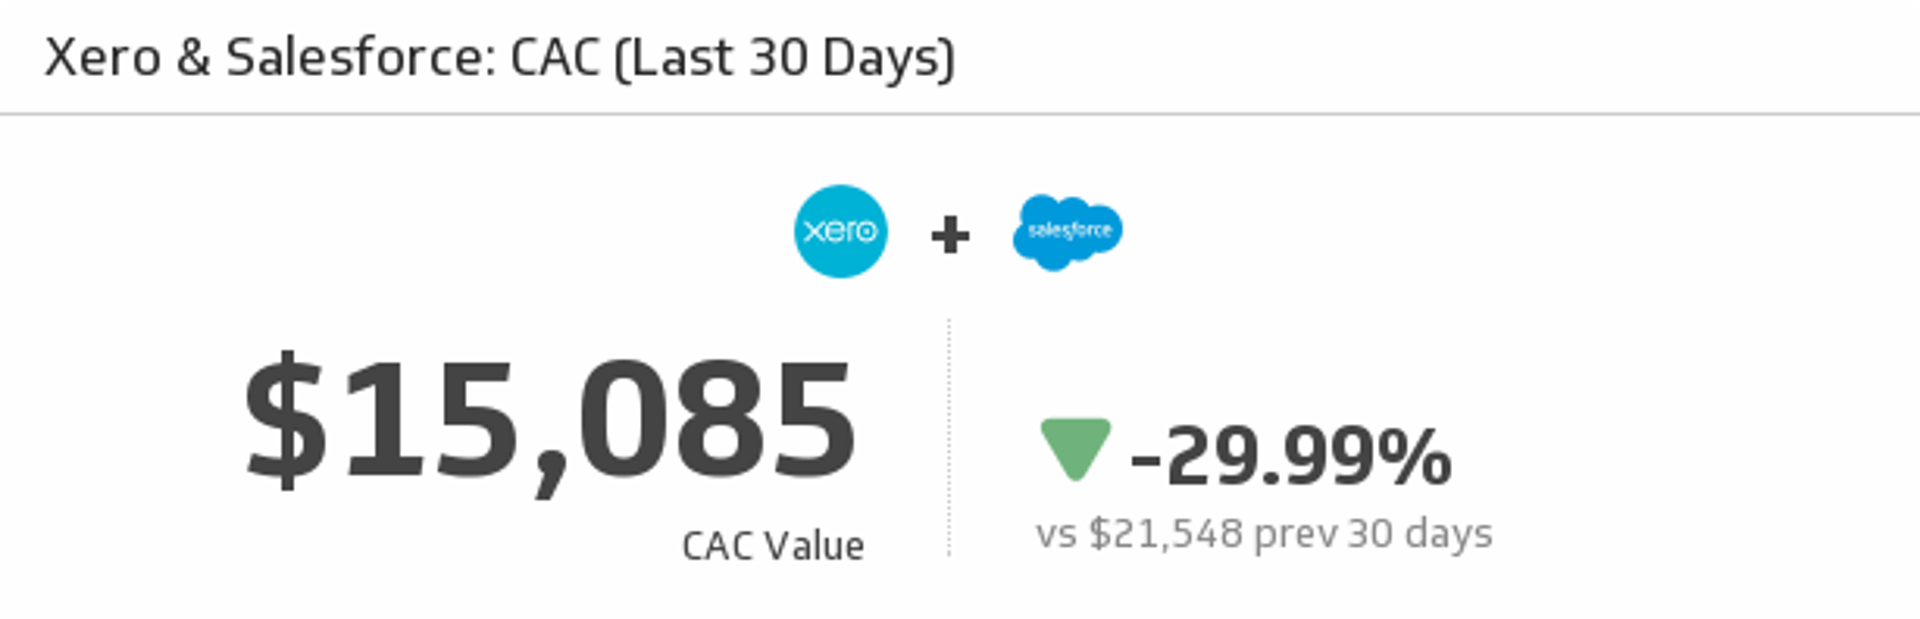
CAC (Last 30 Days)
Let this Klip address the most important question on your marketing team - what is our cost to acquire a customer (CAC)? This Klip uses your monthly Xero and Salesforce data to answer that very question.
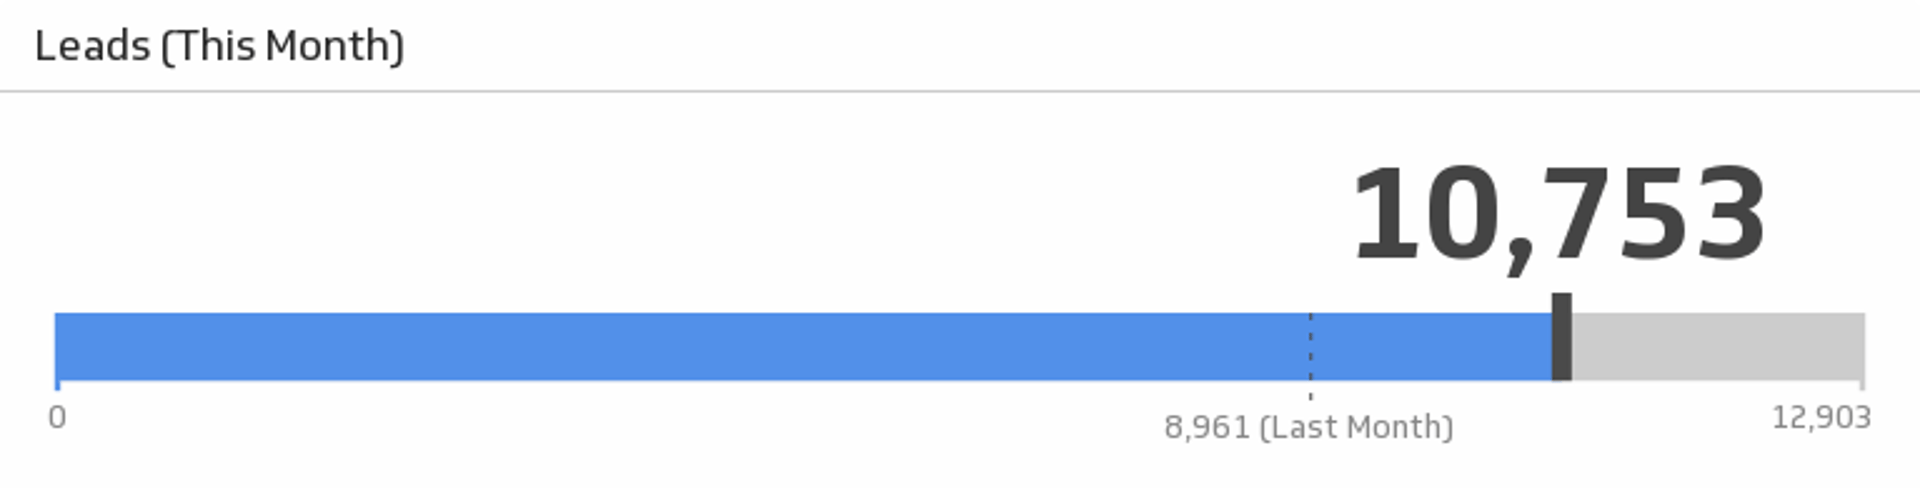
Leads This Month
Monitor your leads this month and see how the number compares to the previous month.
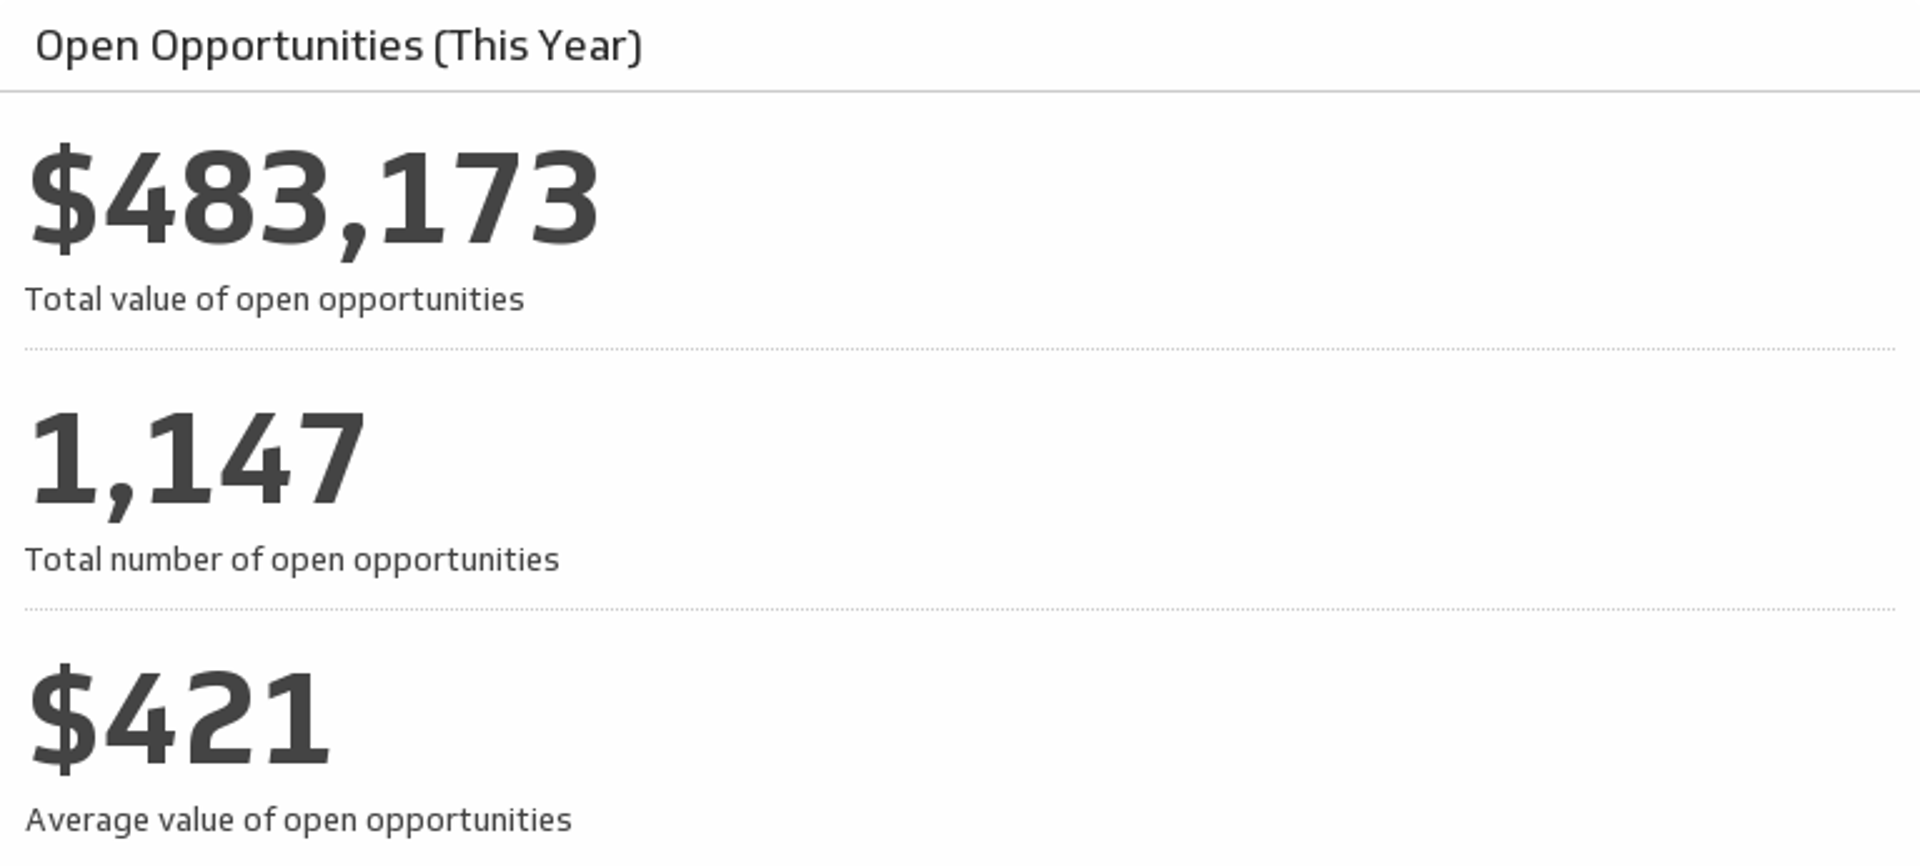
Open Opportunites (This Year)
Track your key metrics on open opportunities and always know what your sales potential is.
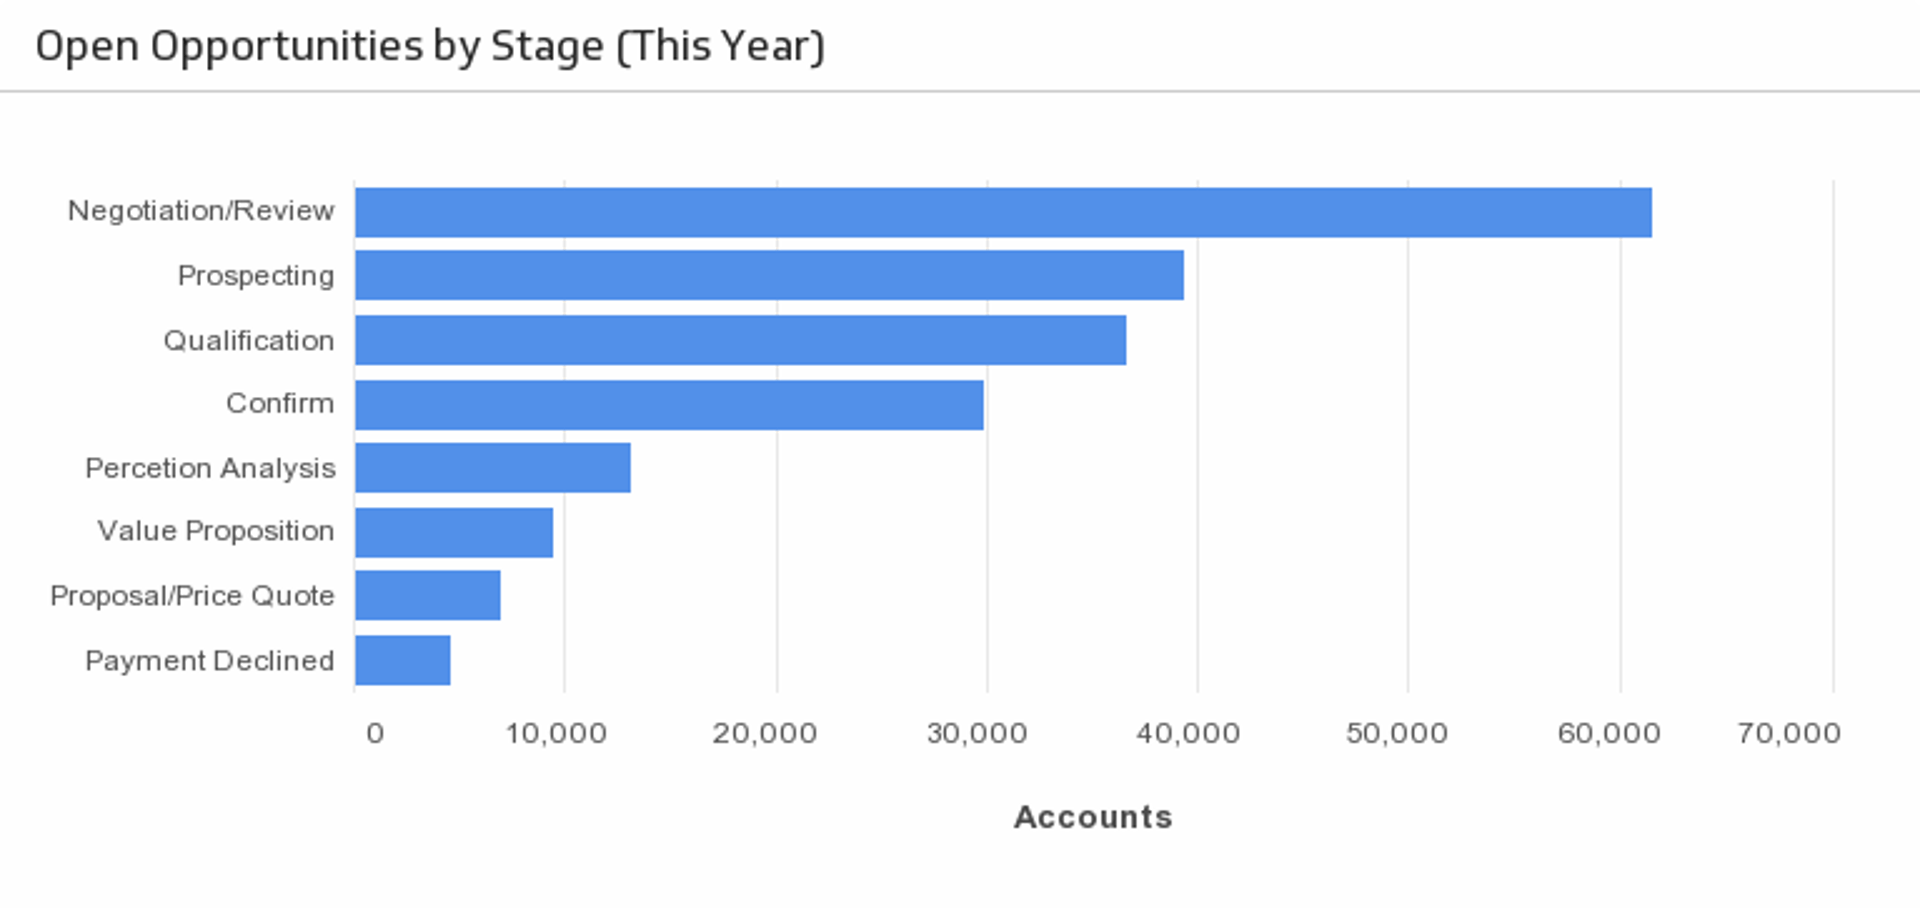
Open Opportunities by Stage
Understand the stage at which your opportunities are in the sales cycle.
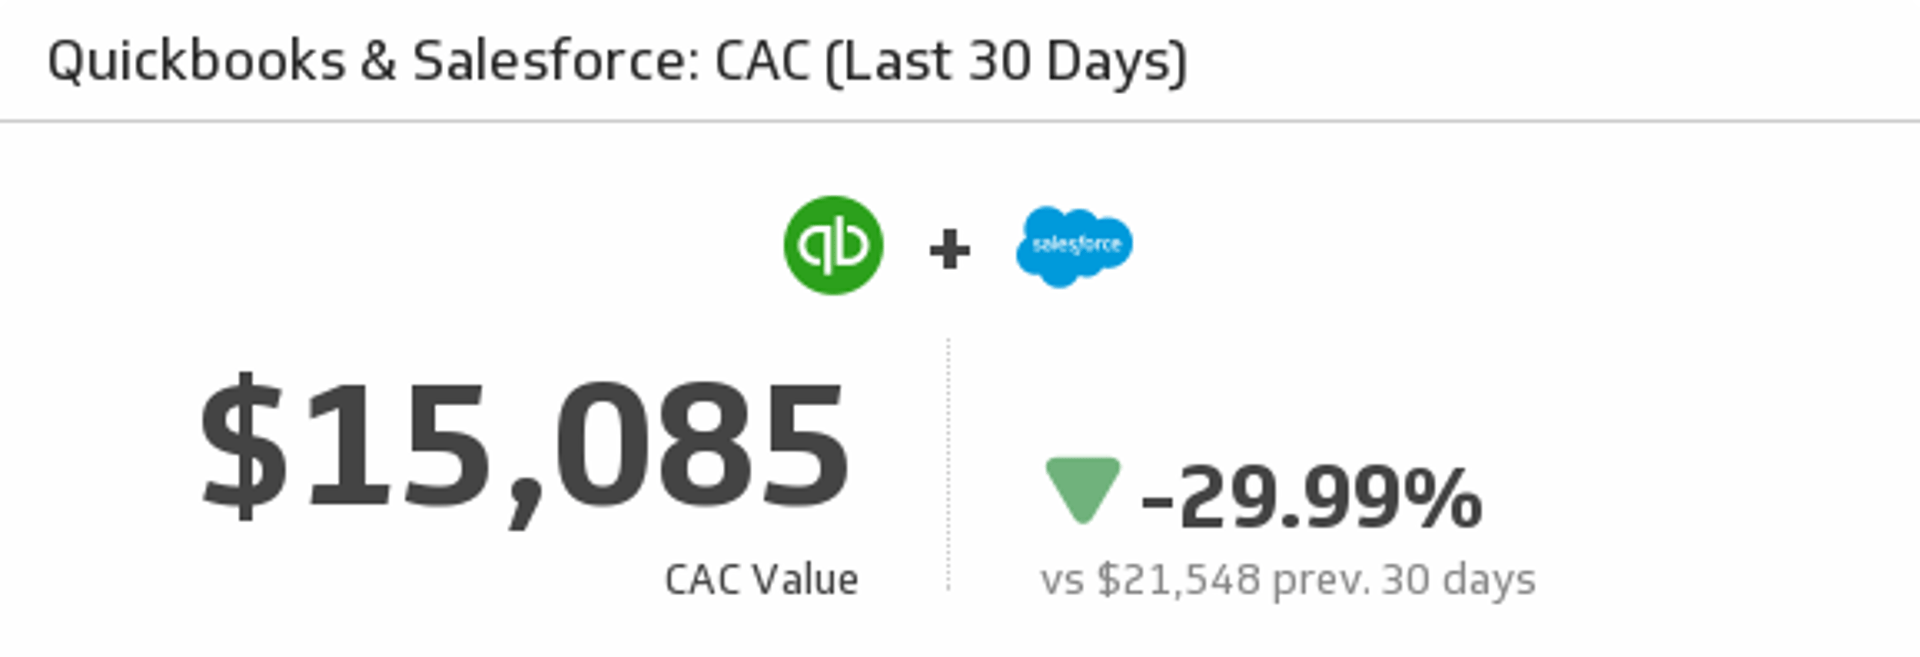
QuickBooks and Salesforce CAC (Last 30 Days)
Mash up your QuickBooks and Salesforce data to measure your Customer Acquisition Cost over the last 30 days.
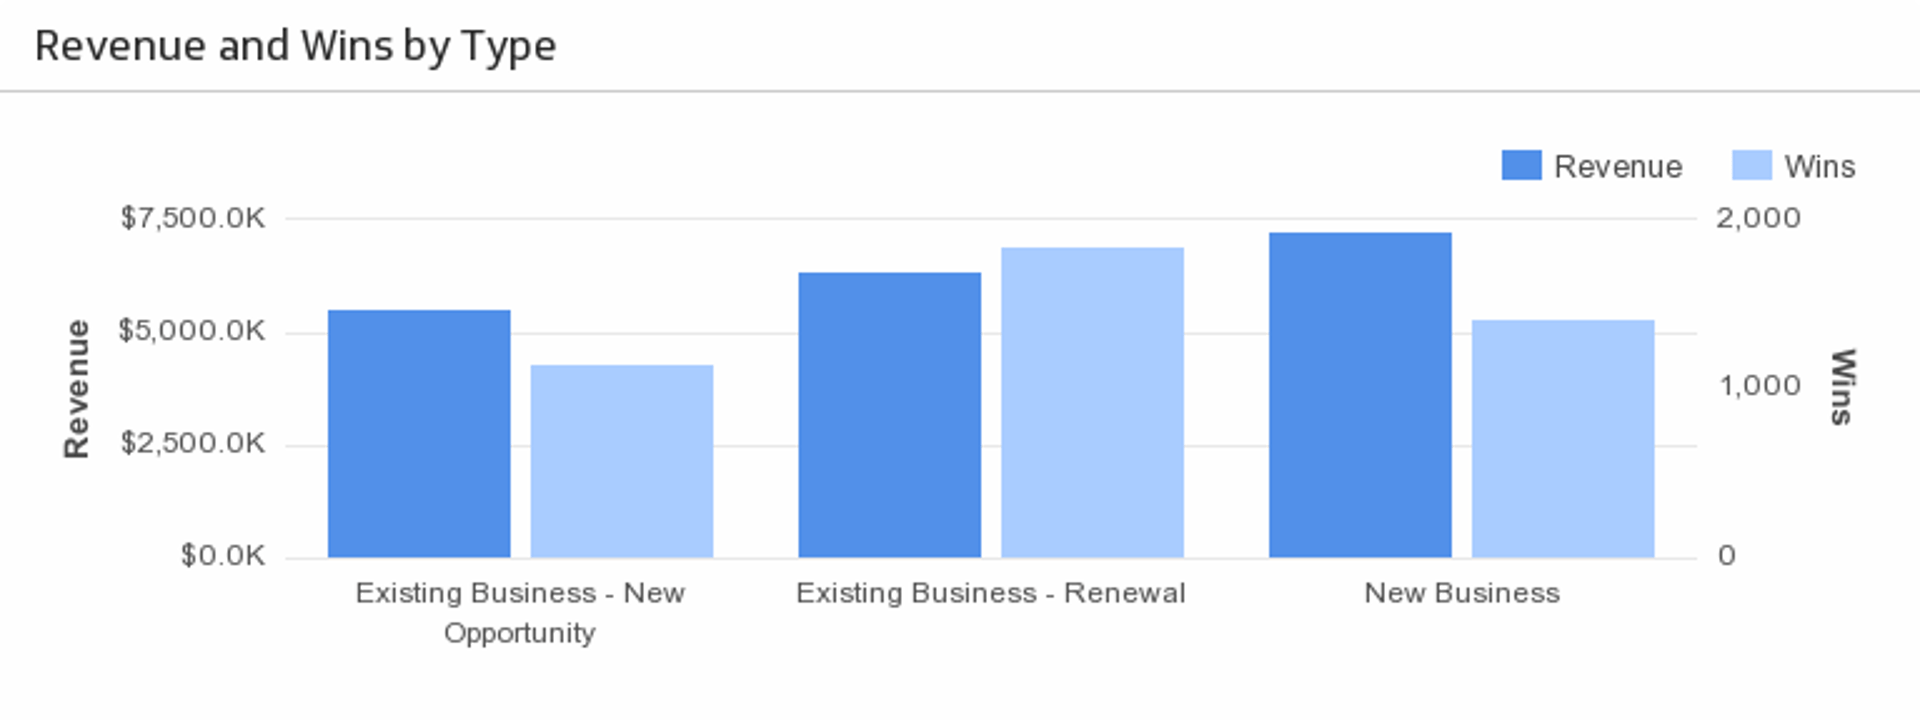
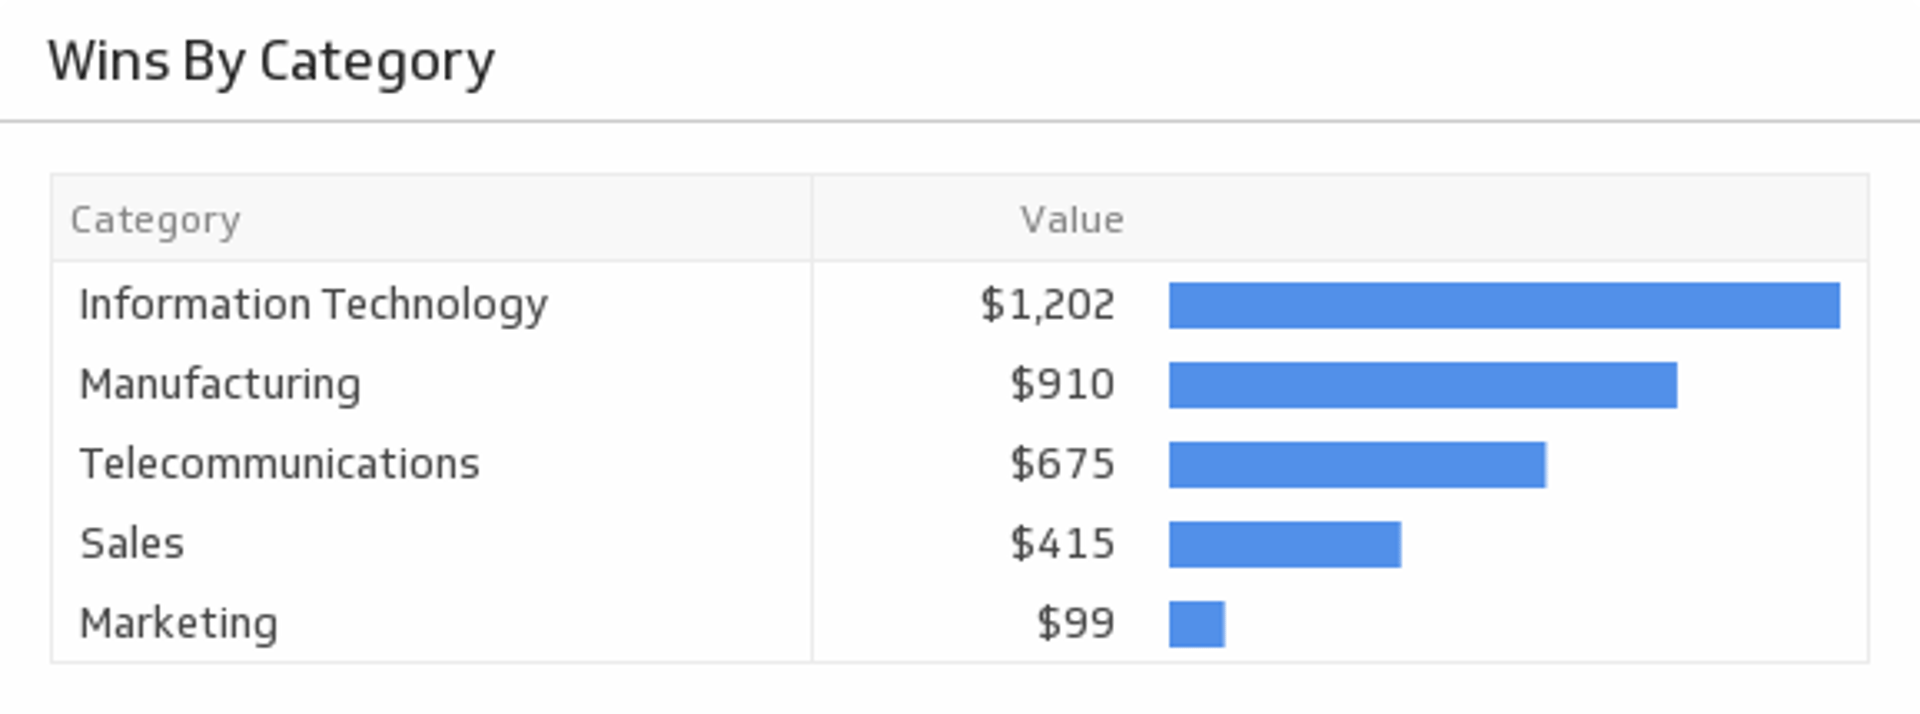
Revenue and Wins by Type
Understand what types of opportunities are bringing in the most revenue.
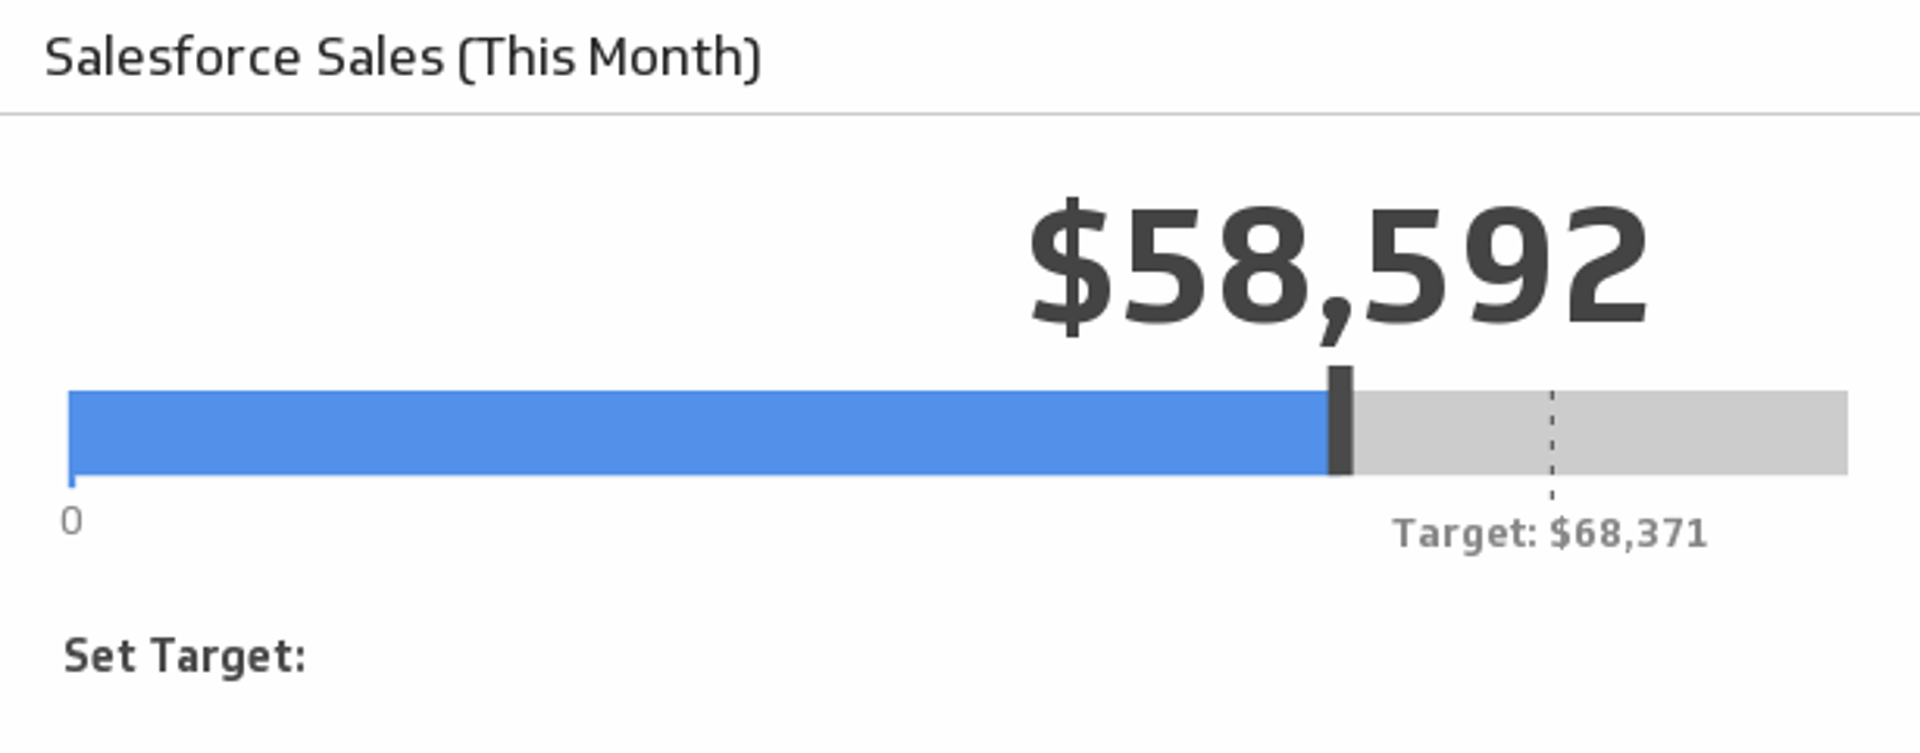
Sales This Month
Monitor your sales this month and compare to the average of the last three months.
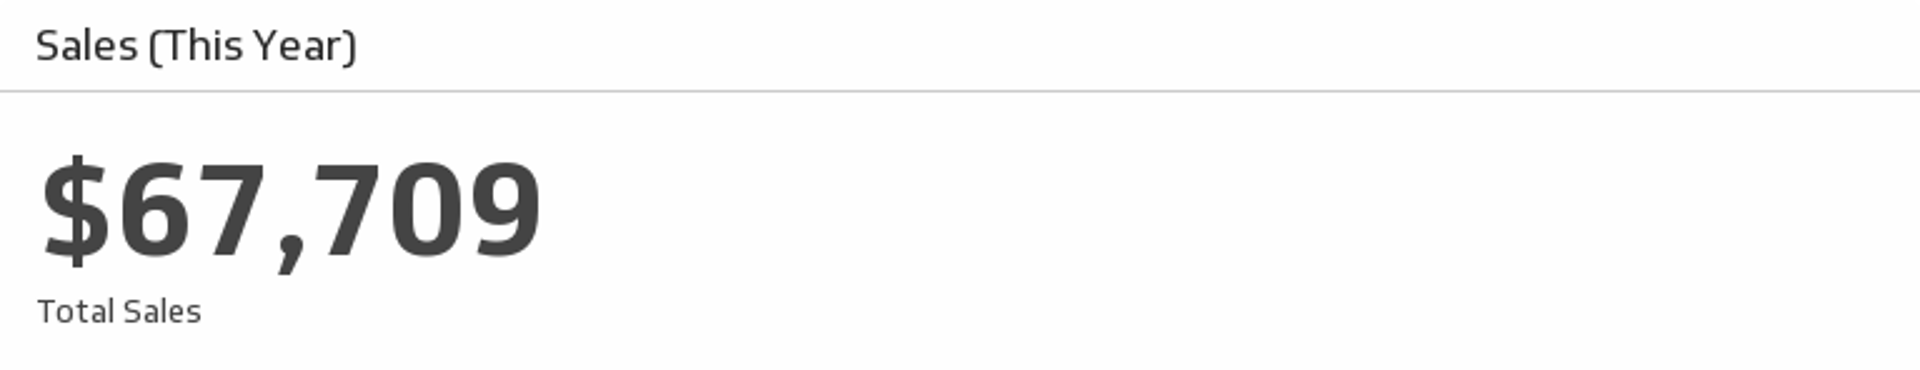
Sales This Year
Monitor the total value of your sales since January 1st.
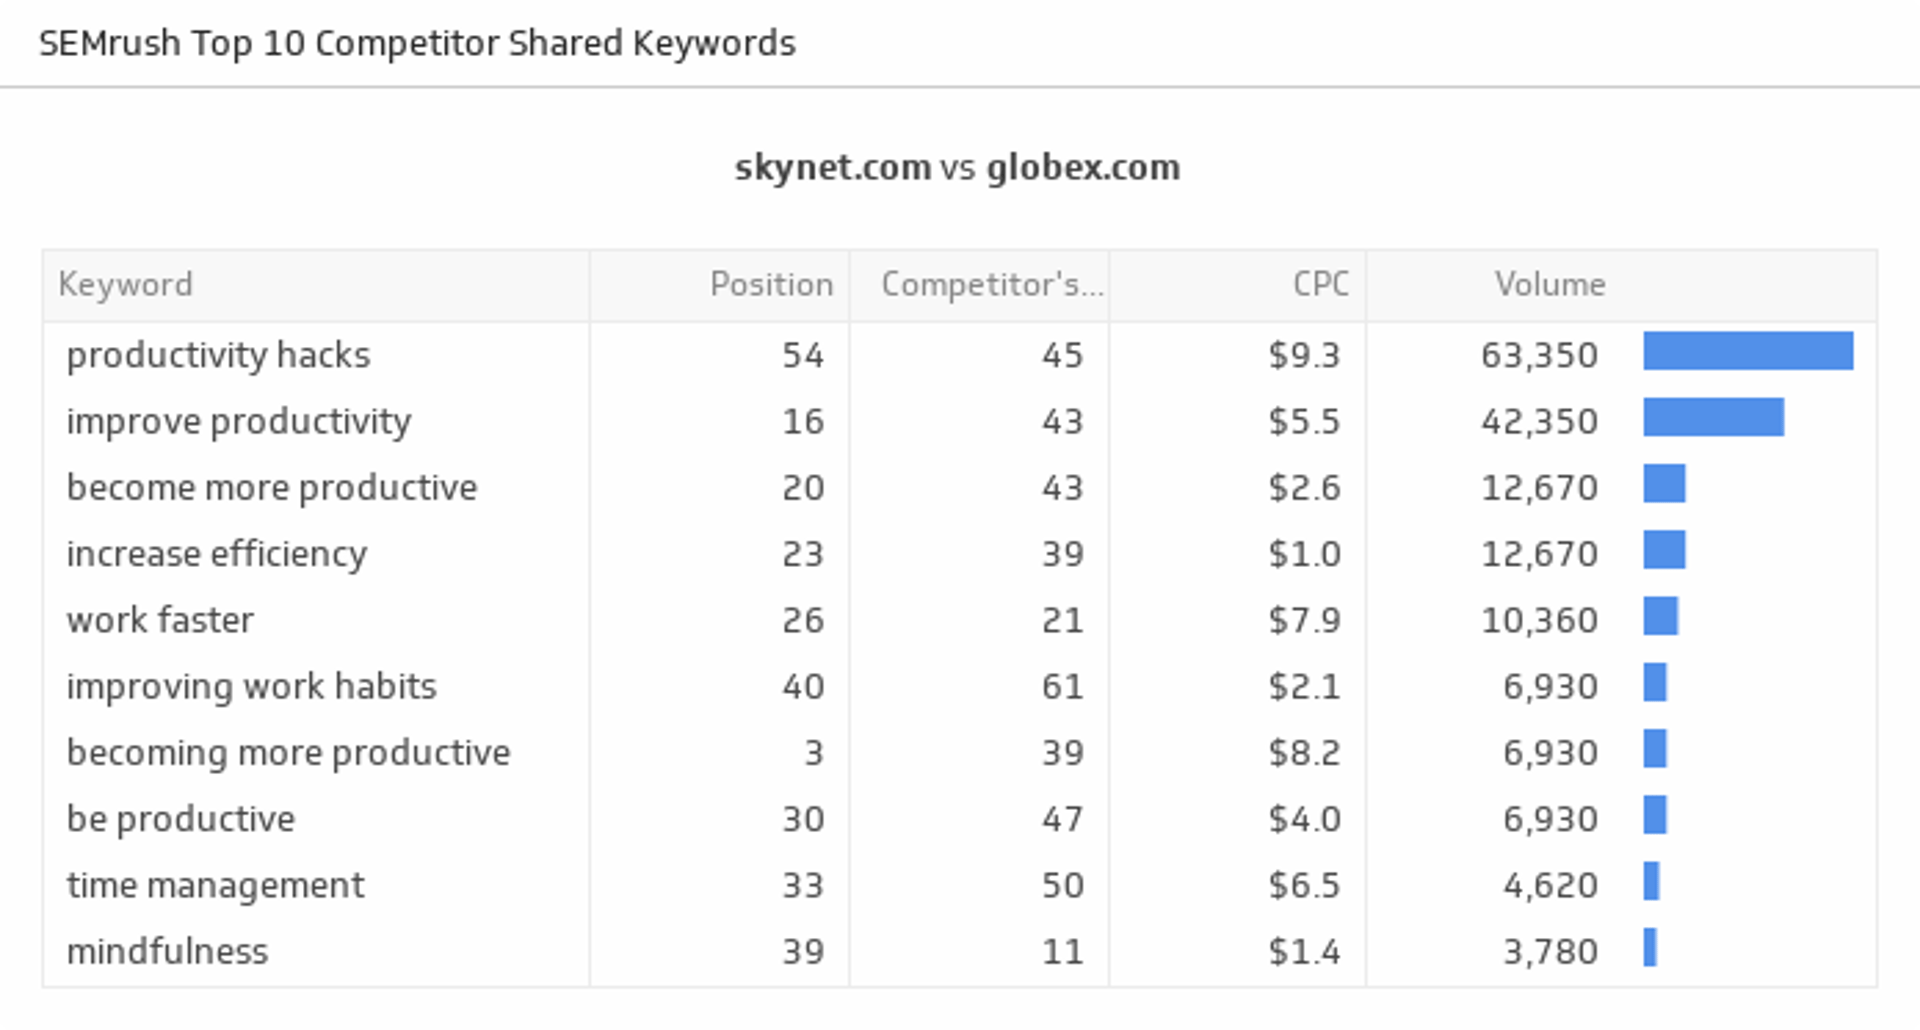
Top 10 Competitor Shared Keywords
Uncover the top ten keywords generating the most leads to your website, and see how you rank against your competitors.
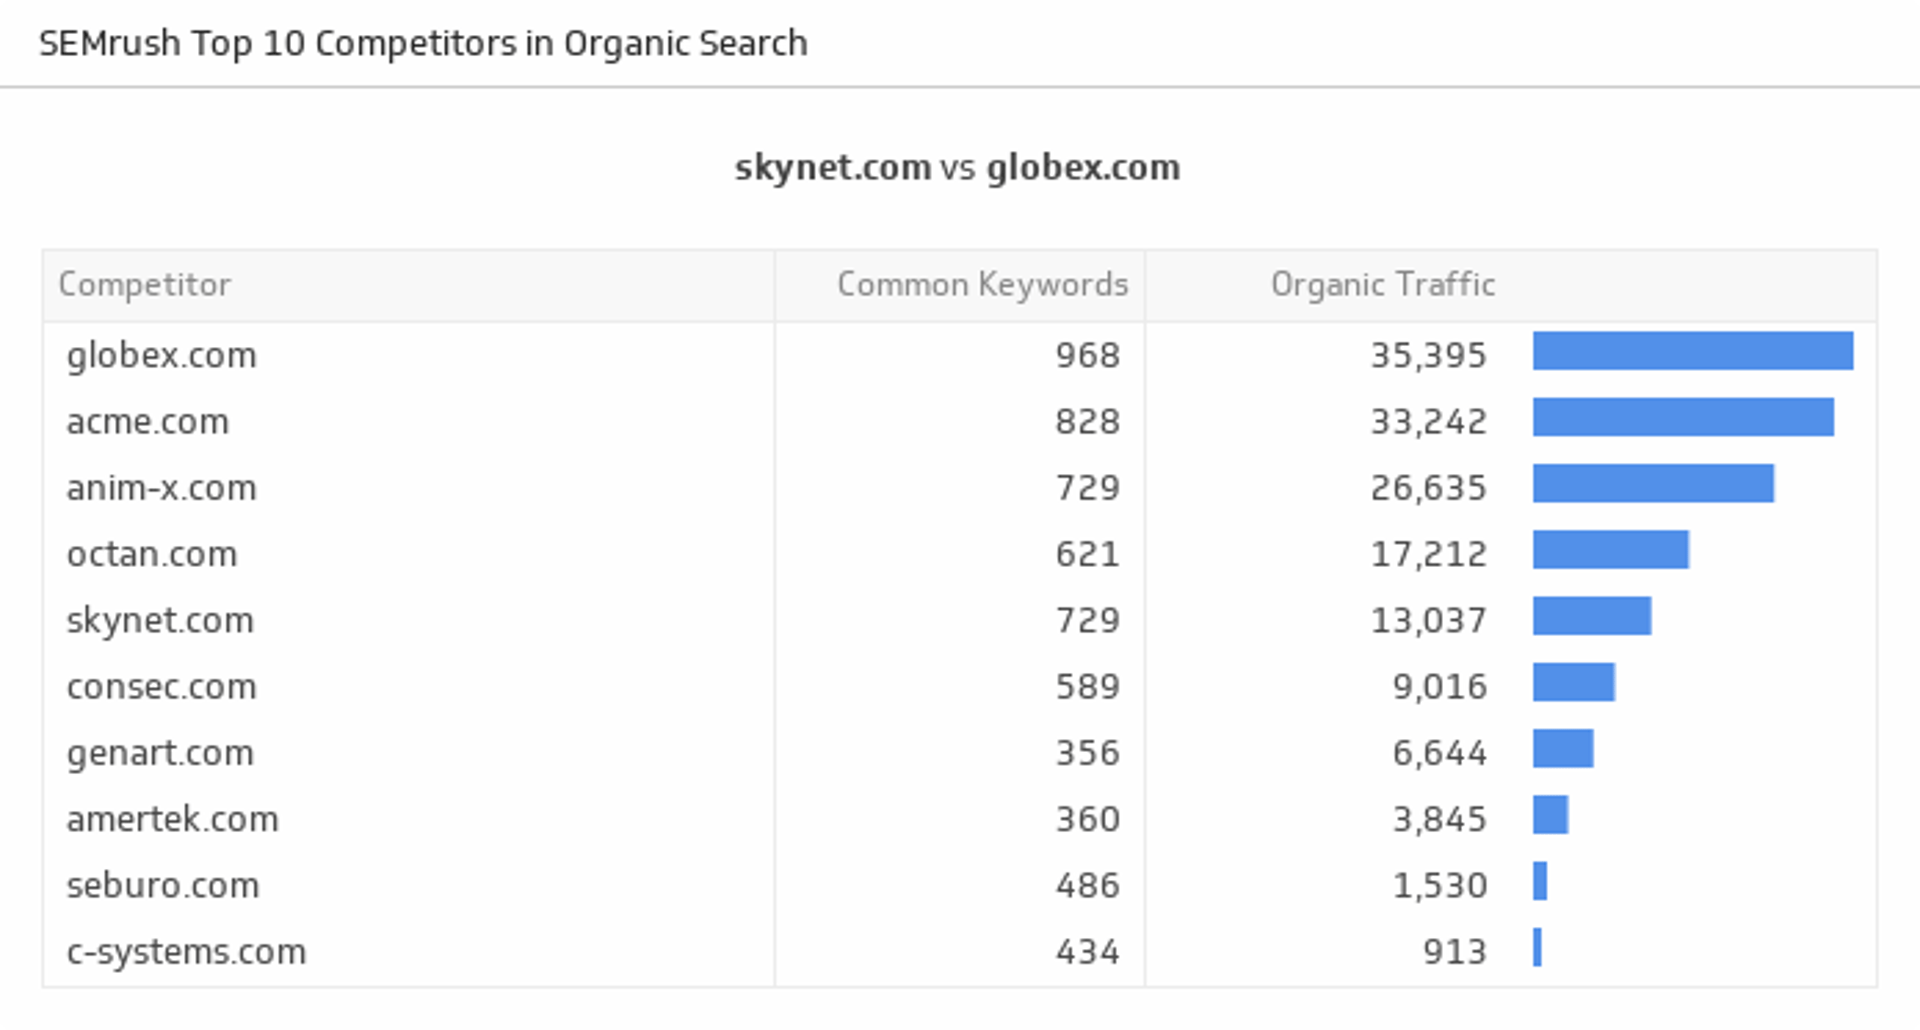
Top 10 Competitors in Organic Search
Stay on the top of the game by tracking your top ten competitors in organic search based on domains with common keywords. Domains with a high number of common keywords are considered competitors.
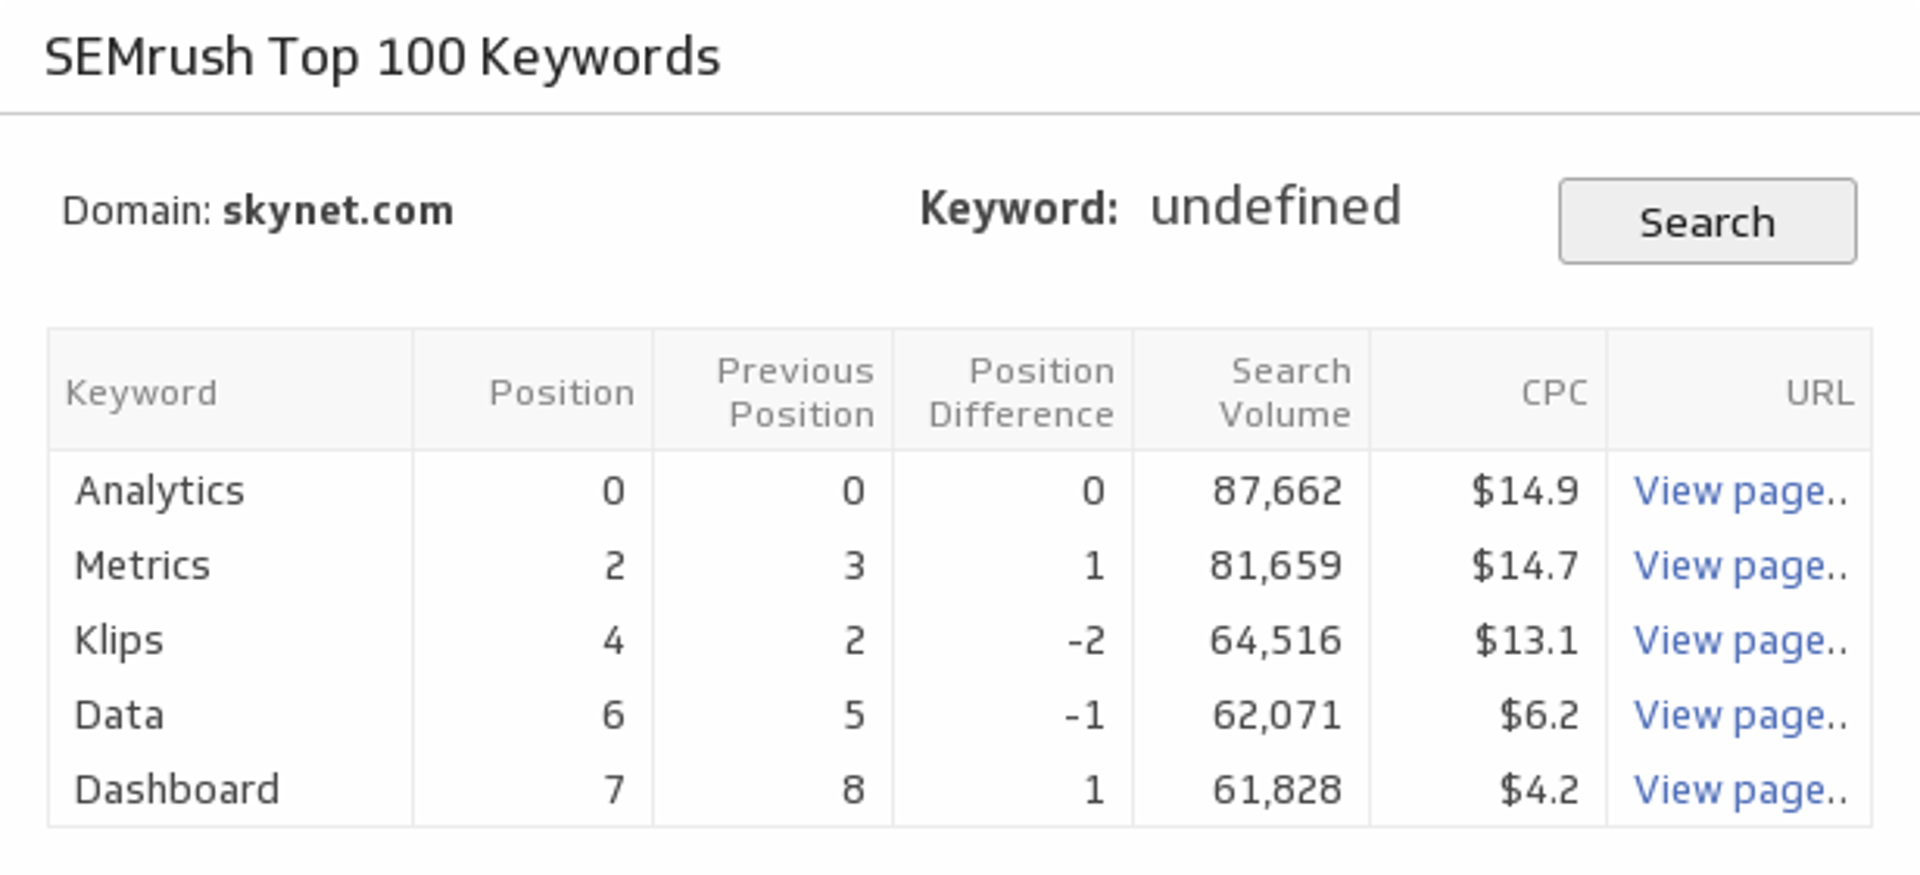
Top 100 Keywords
Examine your top 100 keywords and see how they are performing for the website URL of your choice.
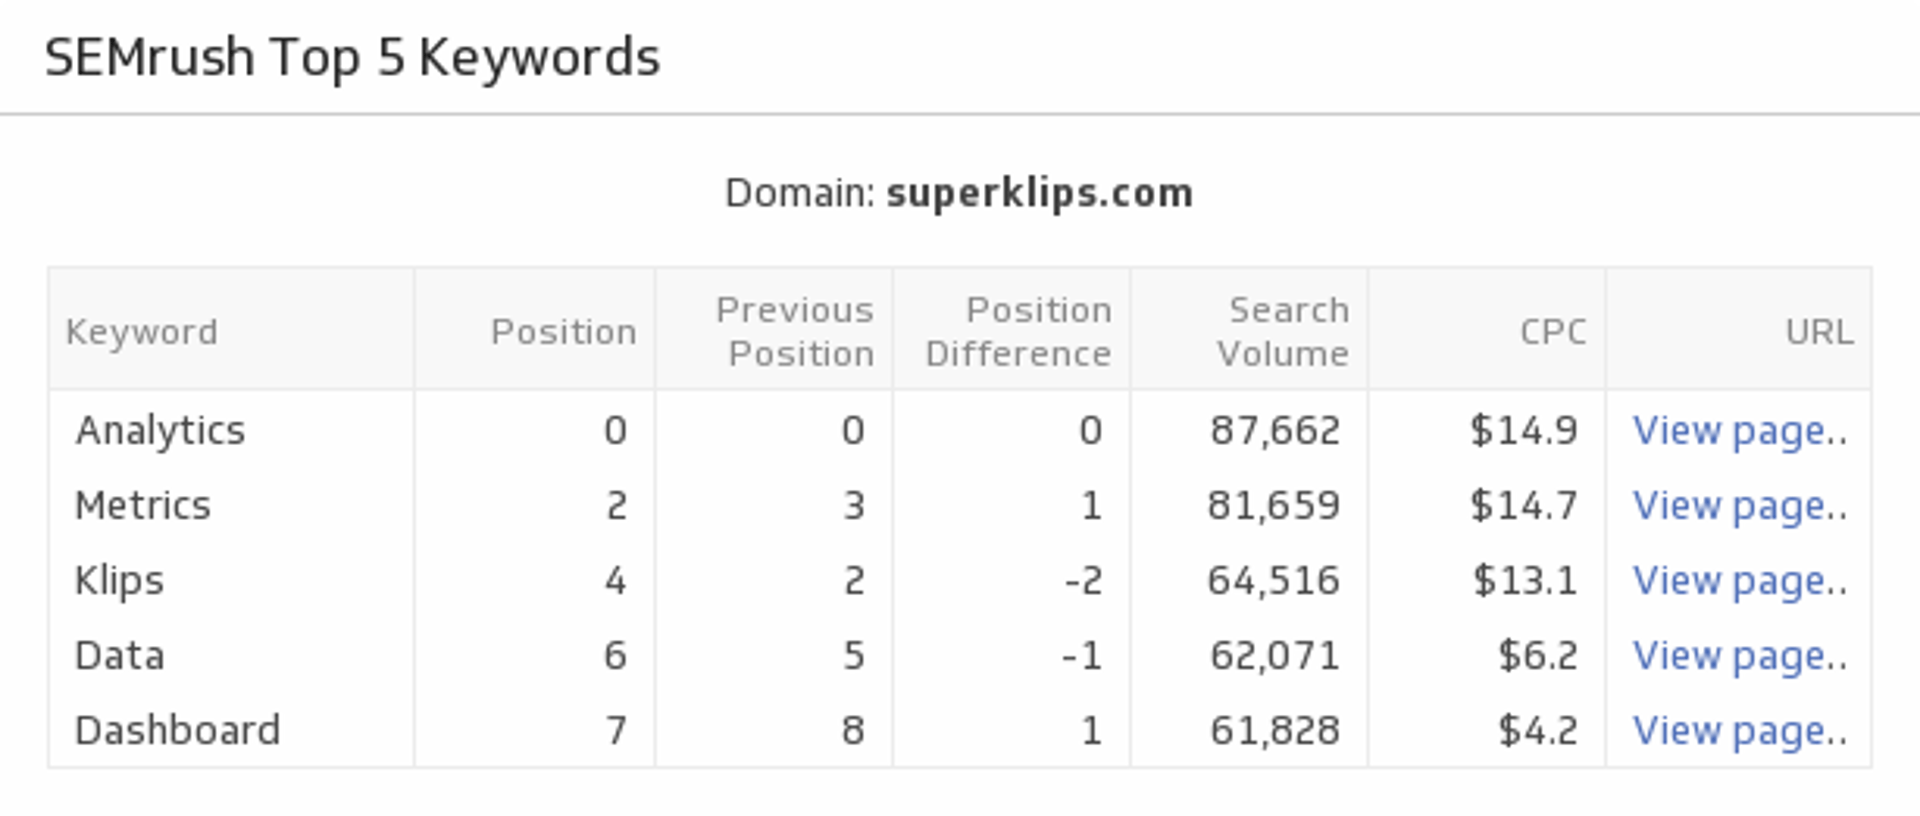
Top 5 Keywords
Discover the top five keywords that drive traffic to the website URL of your choice.
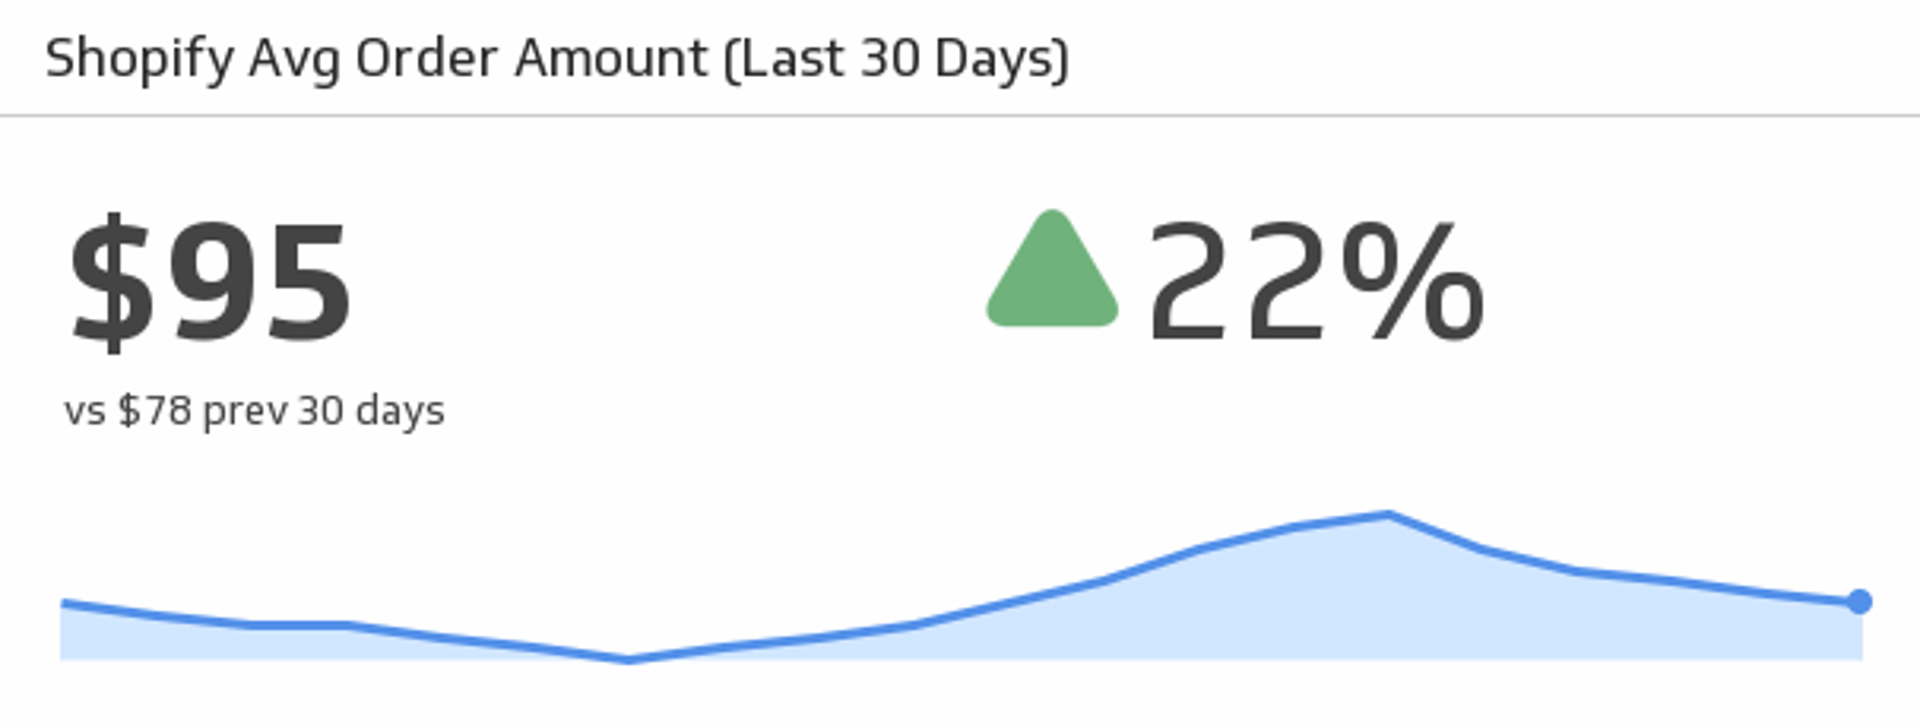
Average Order Amount (Last 30 days)
See the trend, track, and compare your average orders over the past 30 days.
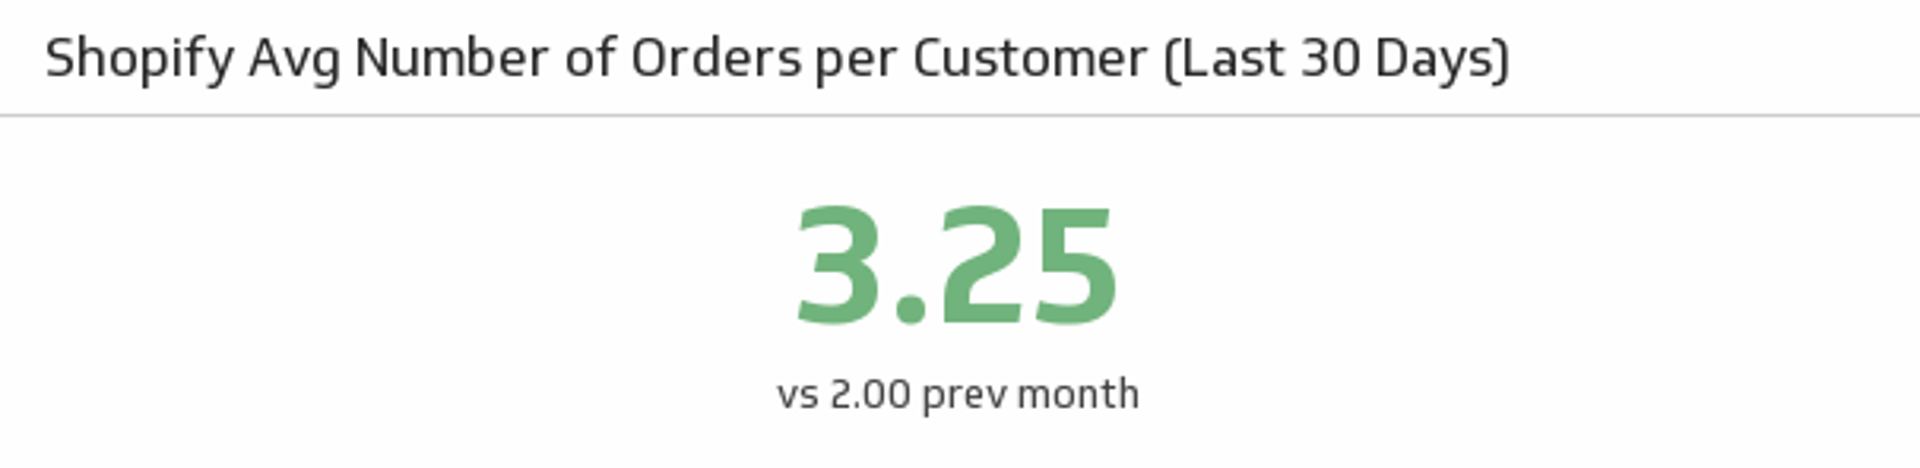
Avg Number of Orders per Customer
See the average number of orders your customers have made over the past 30 days and compare it to the previous month.
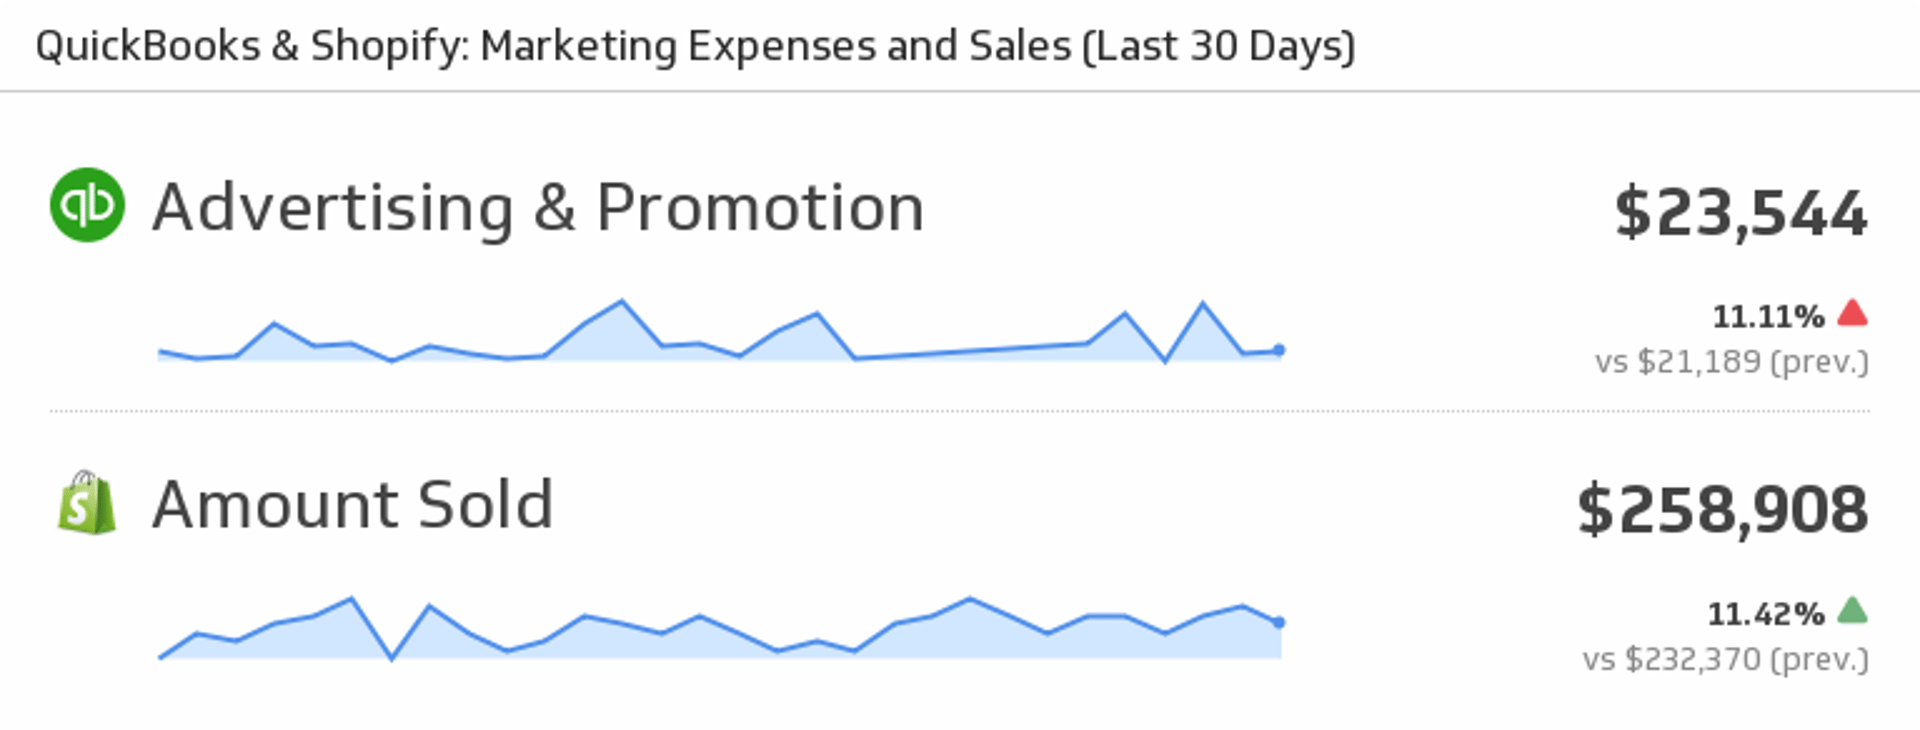
Shopify and QuickBooks Marketing Expenses and Sales
Mash up your QuickBooks and Shopify data to see your Marketing Expenses and Sales for the last 30 days.
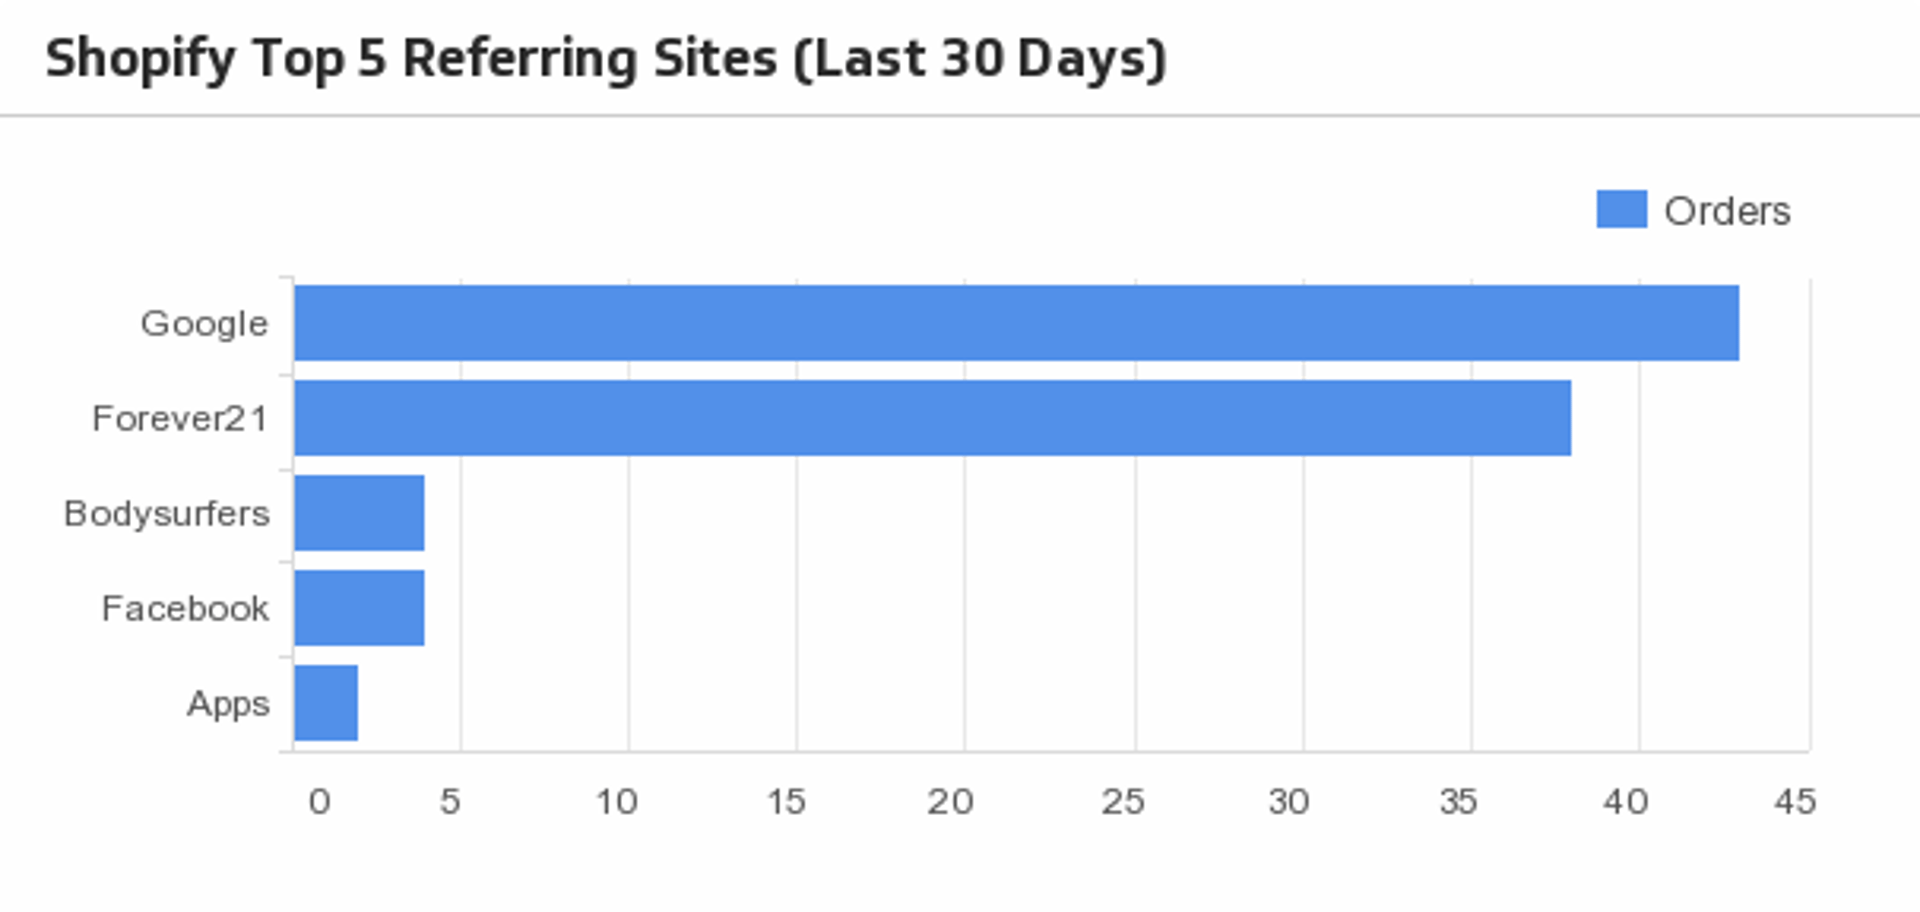
Top 5 Referring Sites (Last 30 days)
Monitor what sites are sending customers to your online shop, and their order count once on your site!
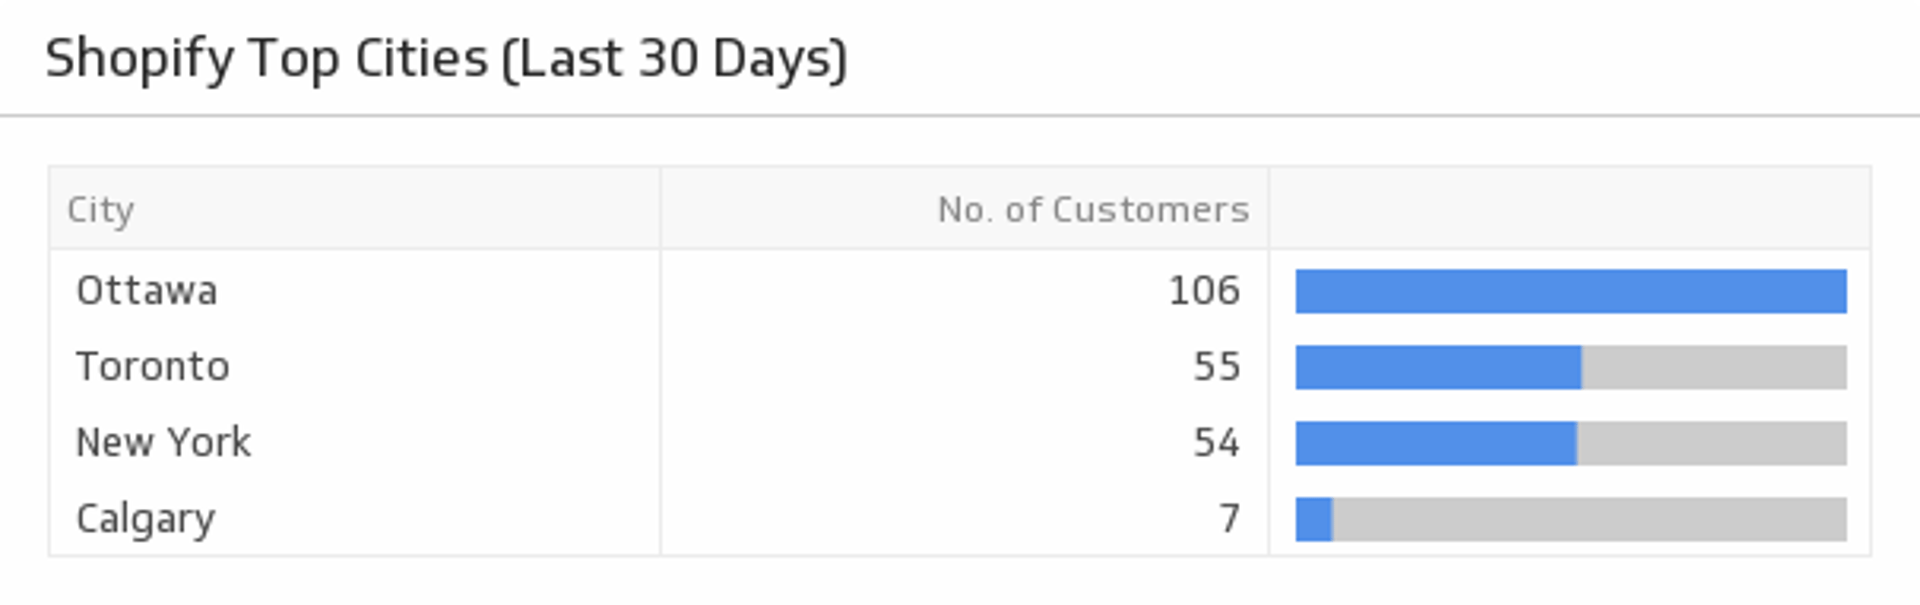
Top Cities (Last 30 days)
See which cities the majority of your customers live in.
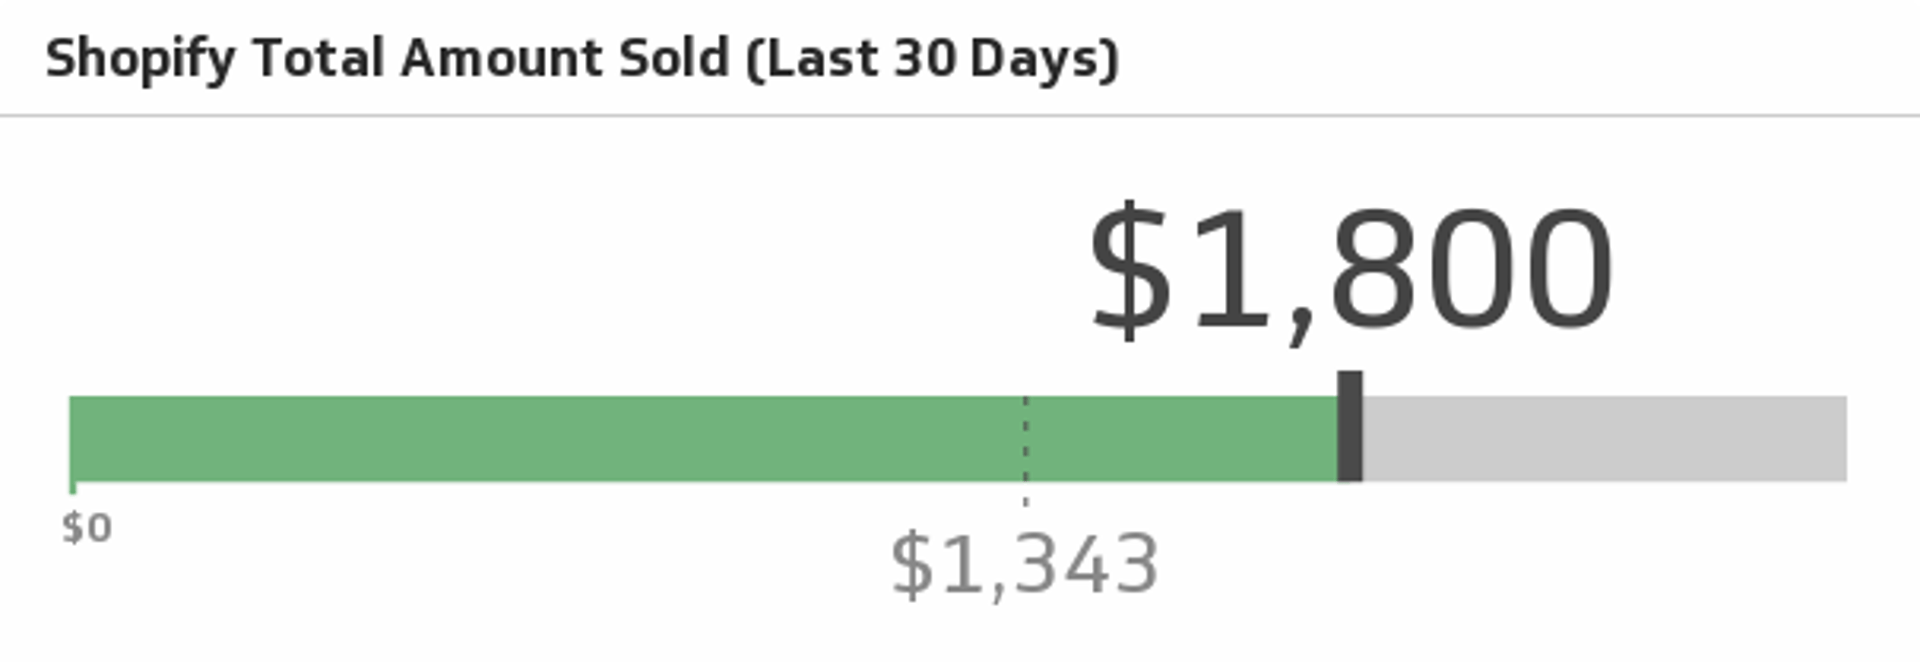
Total Amount Sold (Last 30 days)
Track how much you're selling this month and see if you can surpass the previous month.
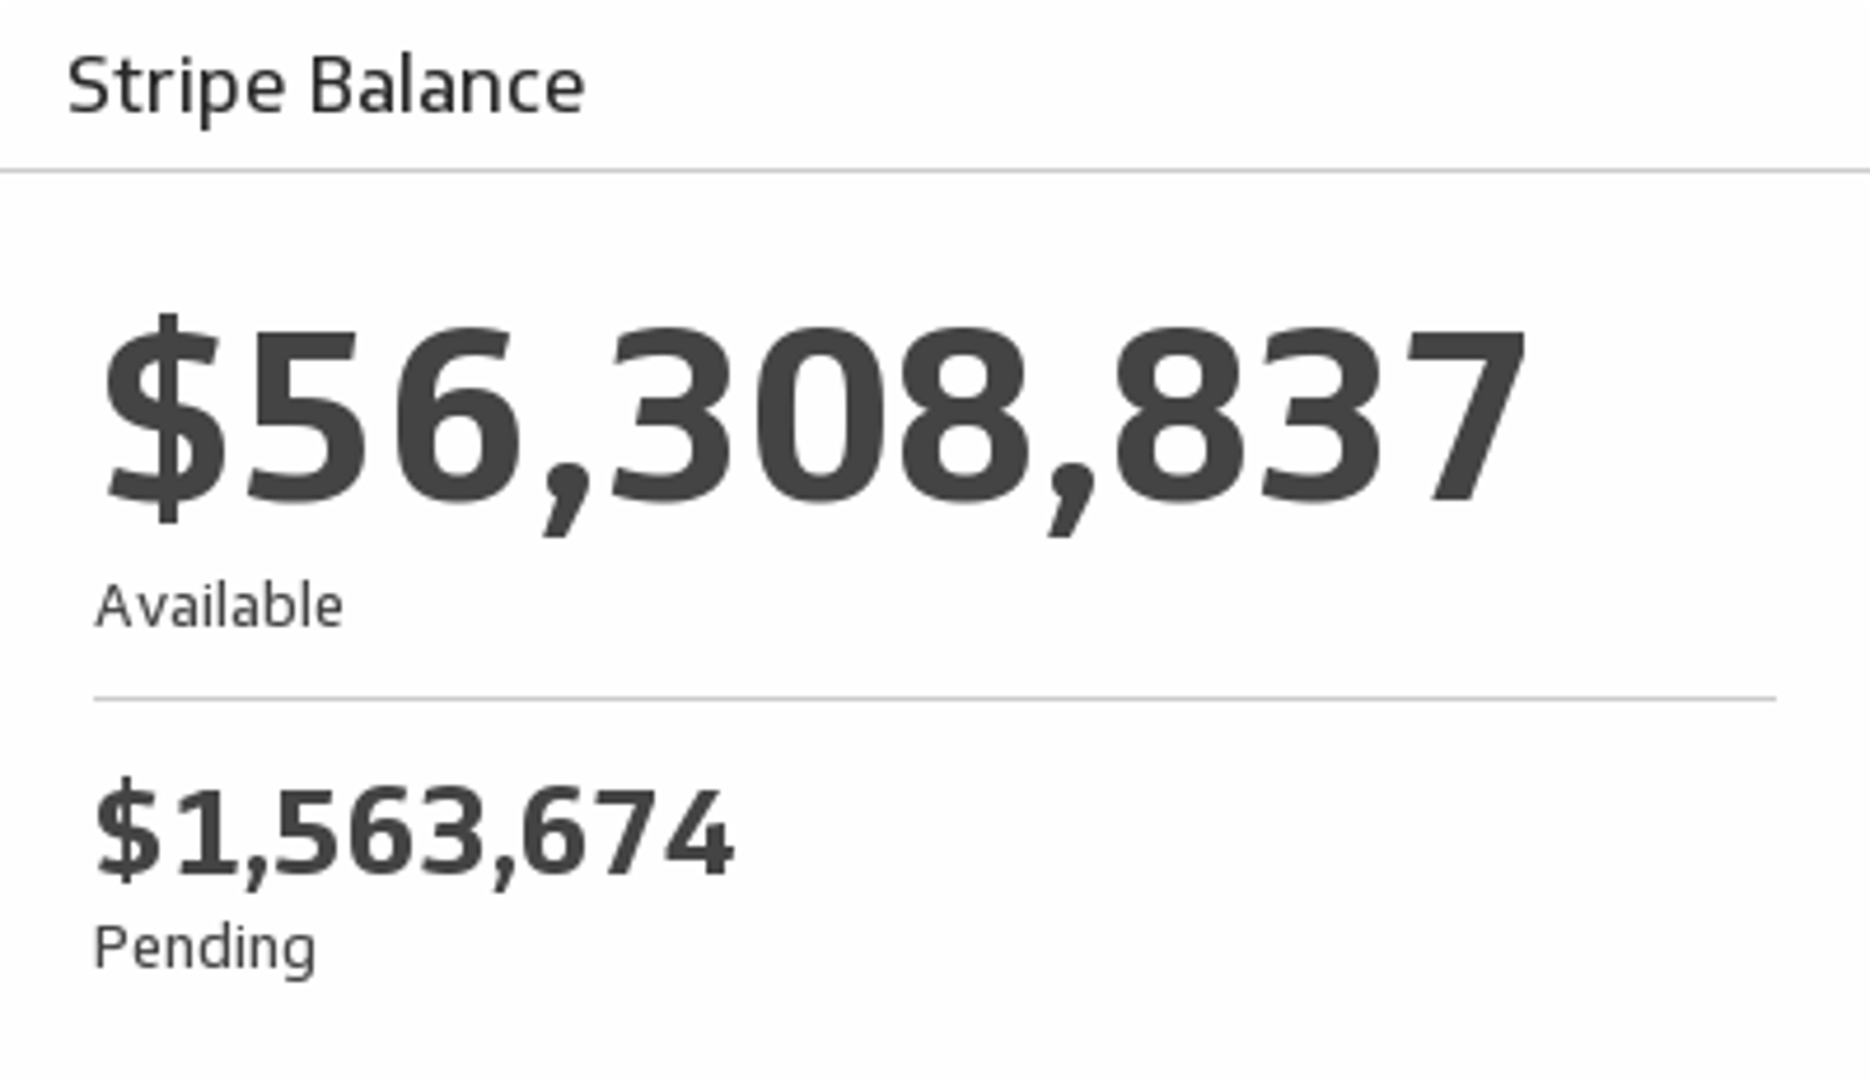
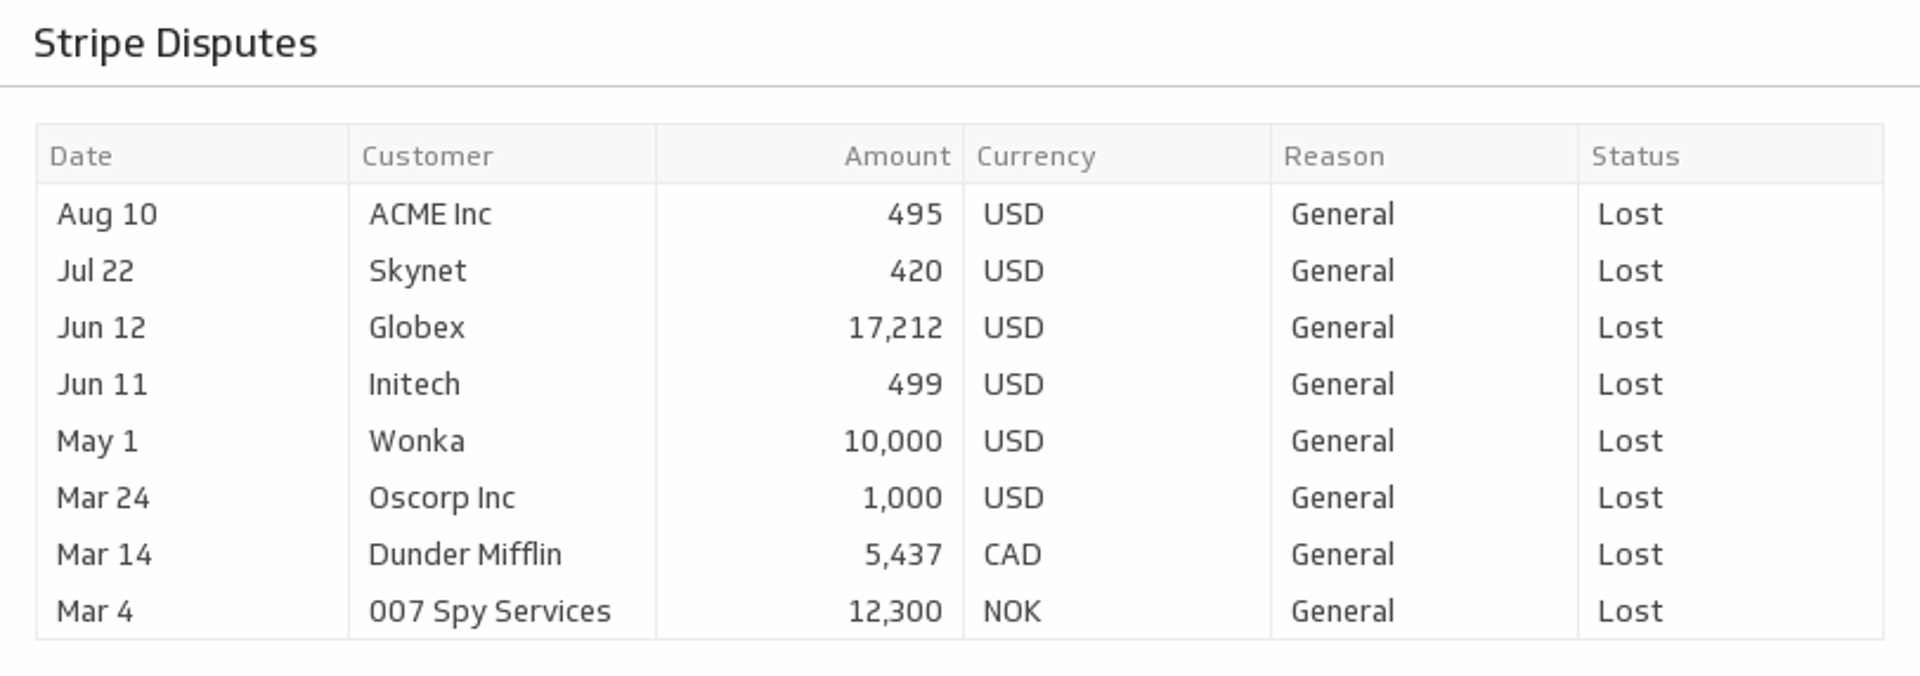
Balance
Monitor your Stripe account balance and see how much is available and pending.
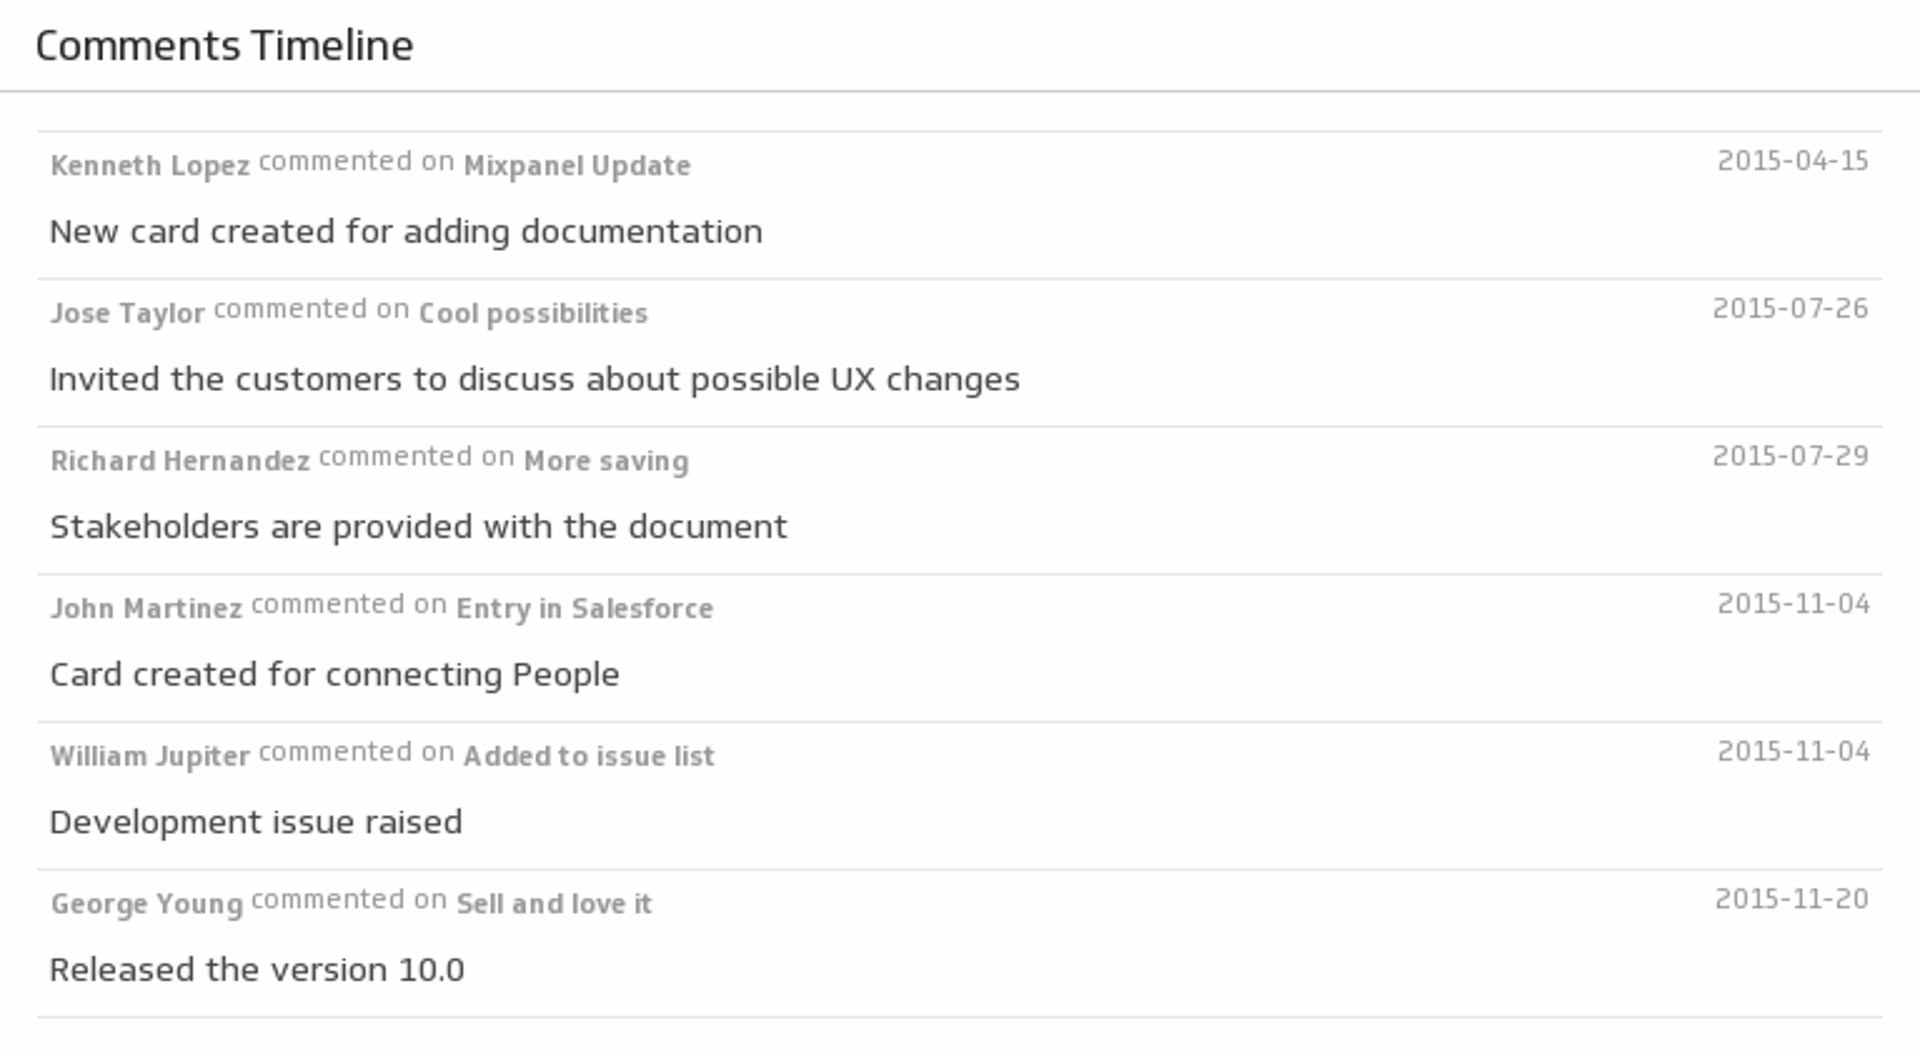
Comments Timeline
Listen to your team with a timeline of Trello comments.
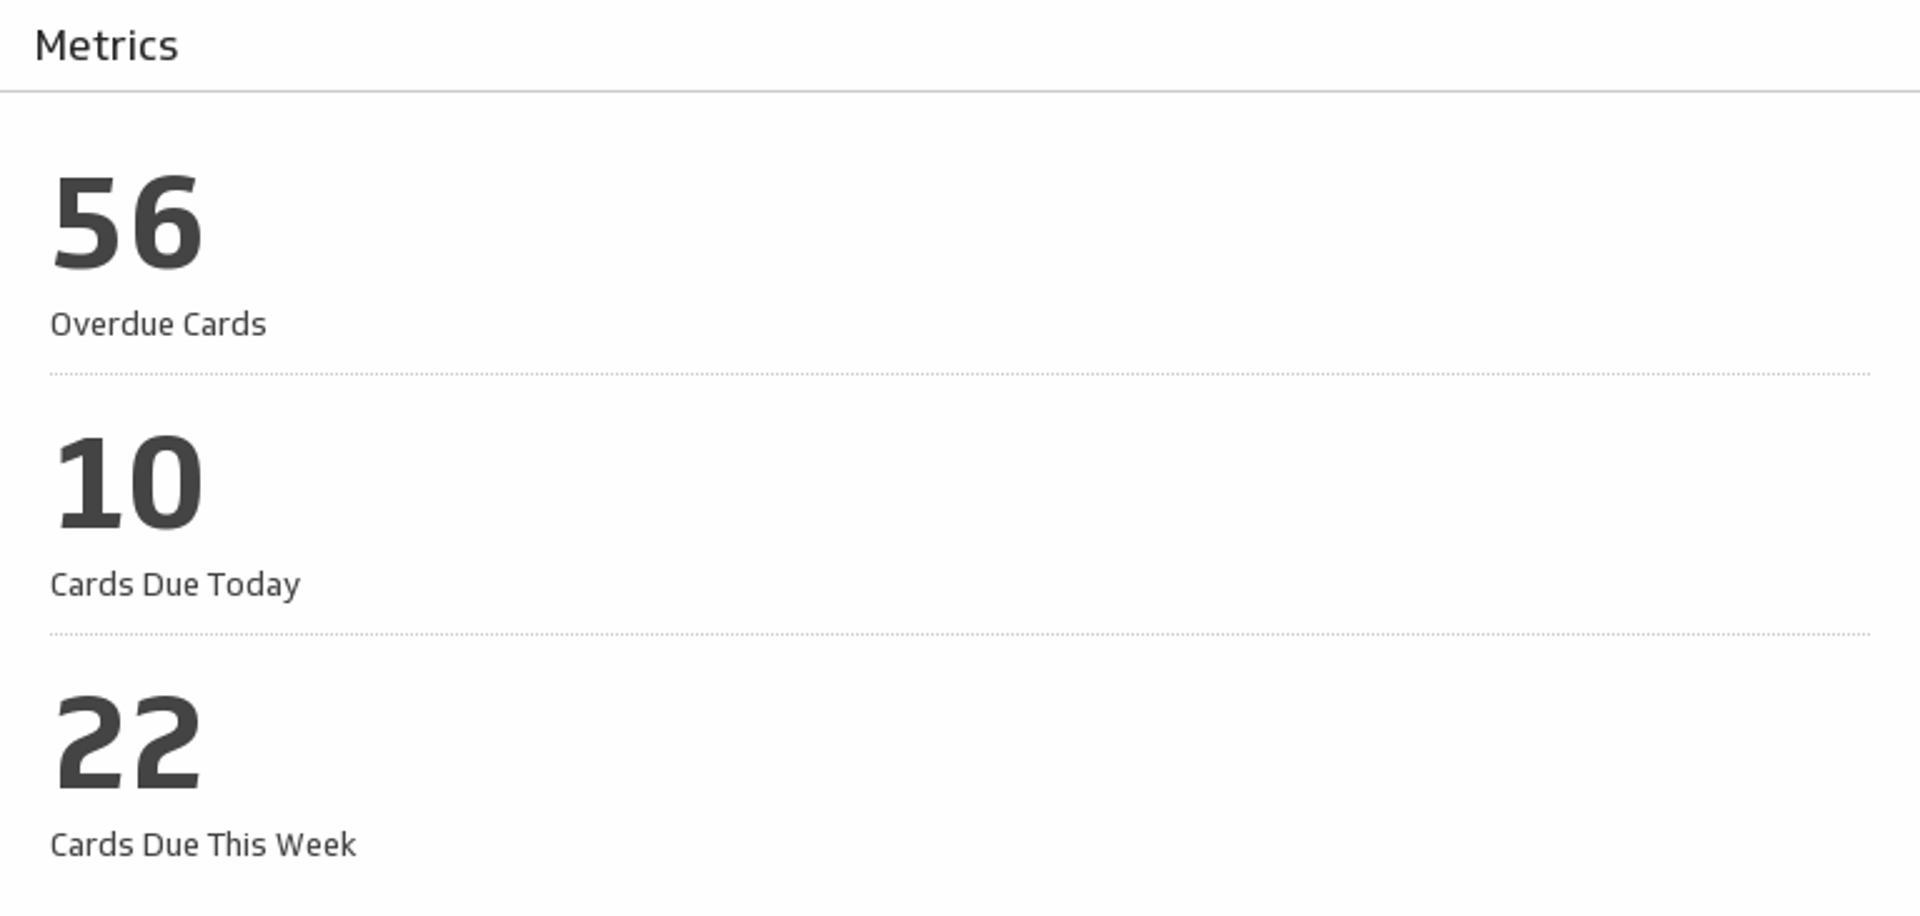
Metrics
Track the key metrics for the cards on your chosen Trello board.
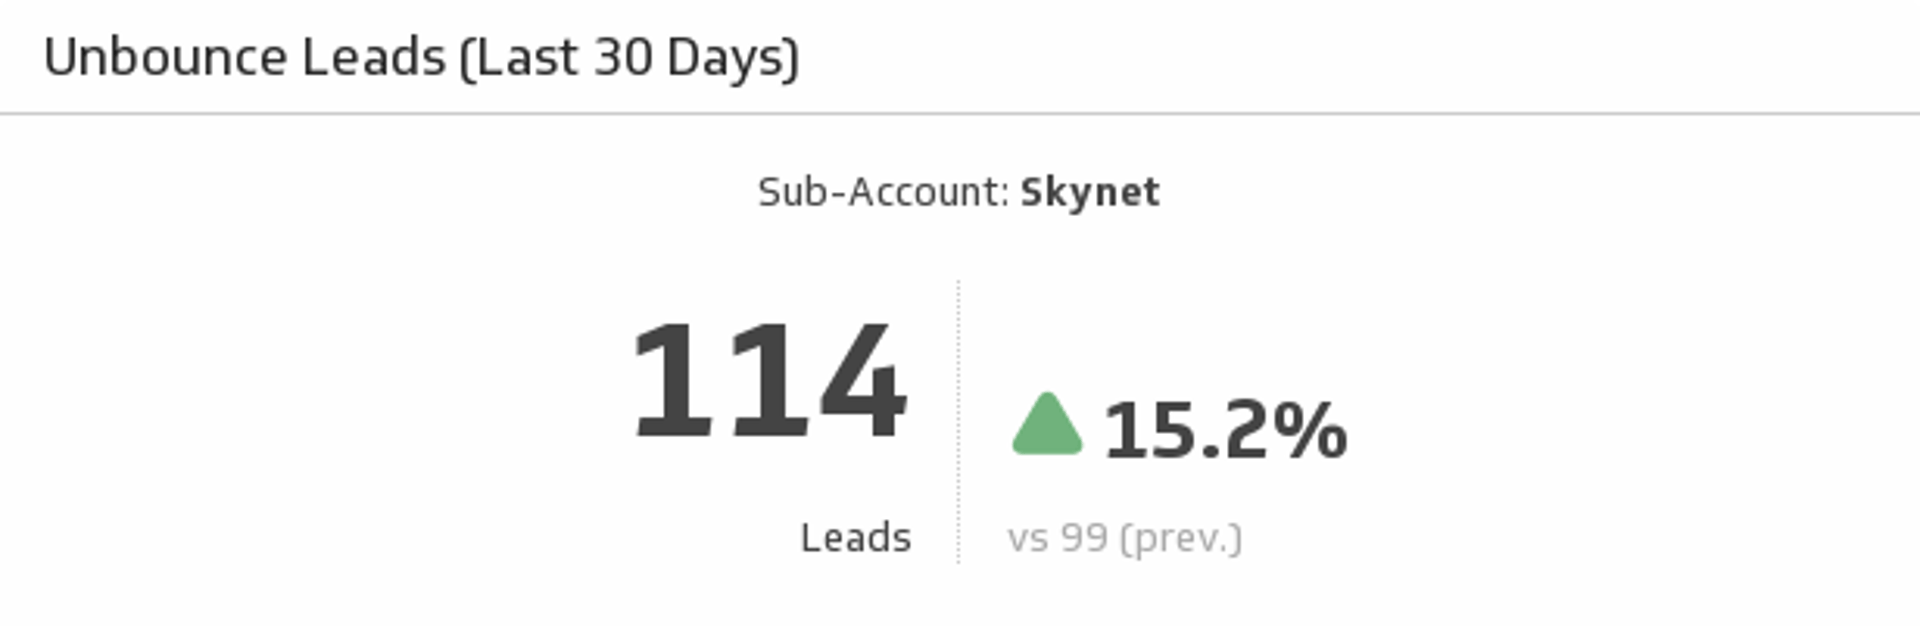
Leads
Track the number leads you have gained over the past 30 days and compare to the previous 30 days.
Page Stats
Use your key landing page metrics to discover the success of your lead generation efforts.
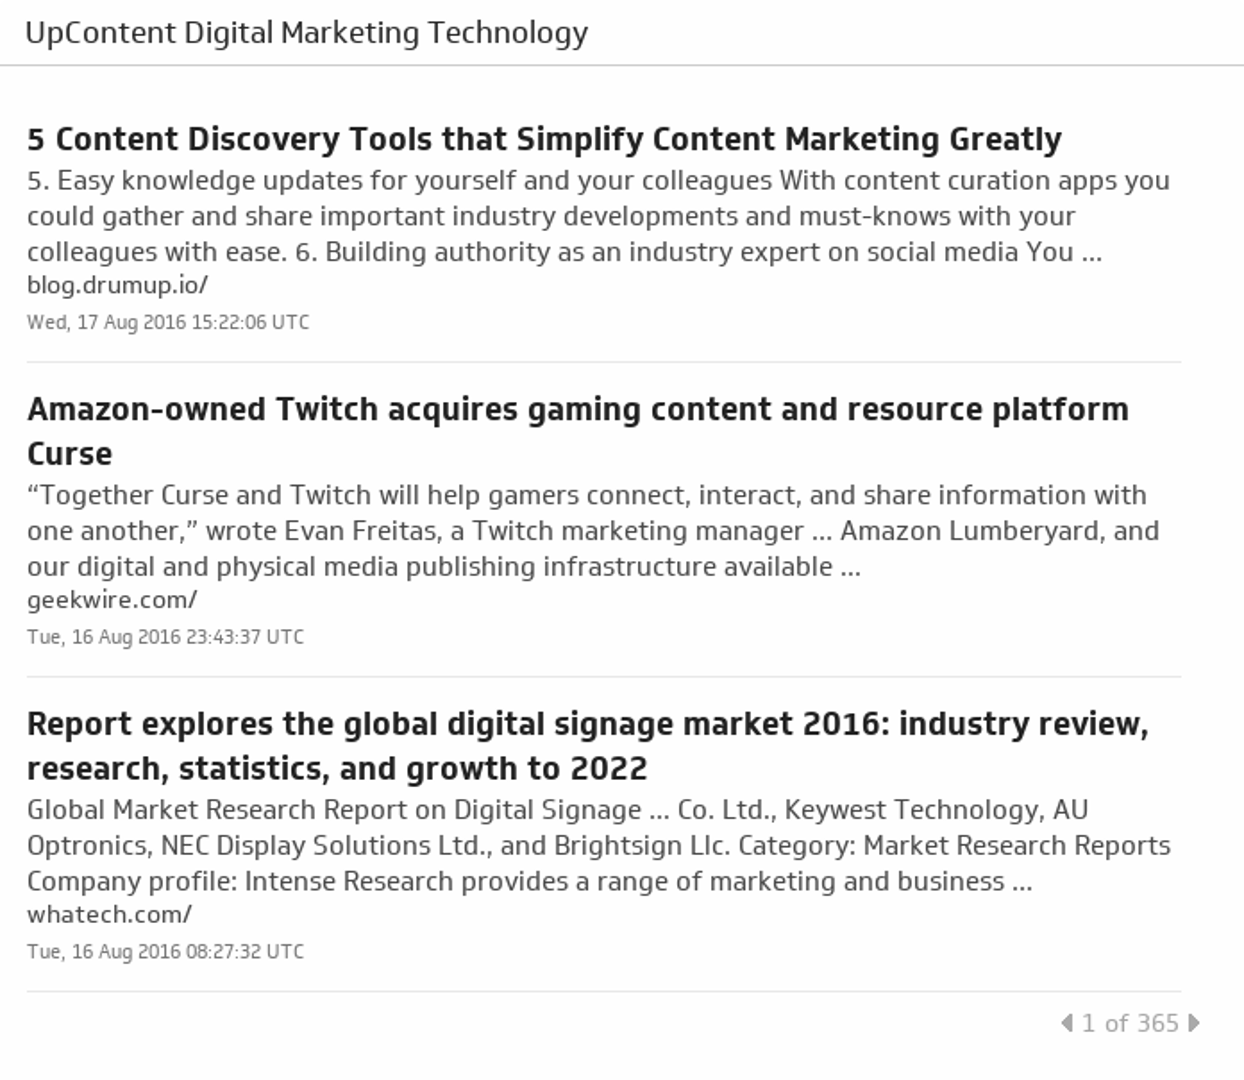
Digital Marketing Technology
Gain a competitive edge by keeping up with the latest and greatest articles in digital marketing technology.
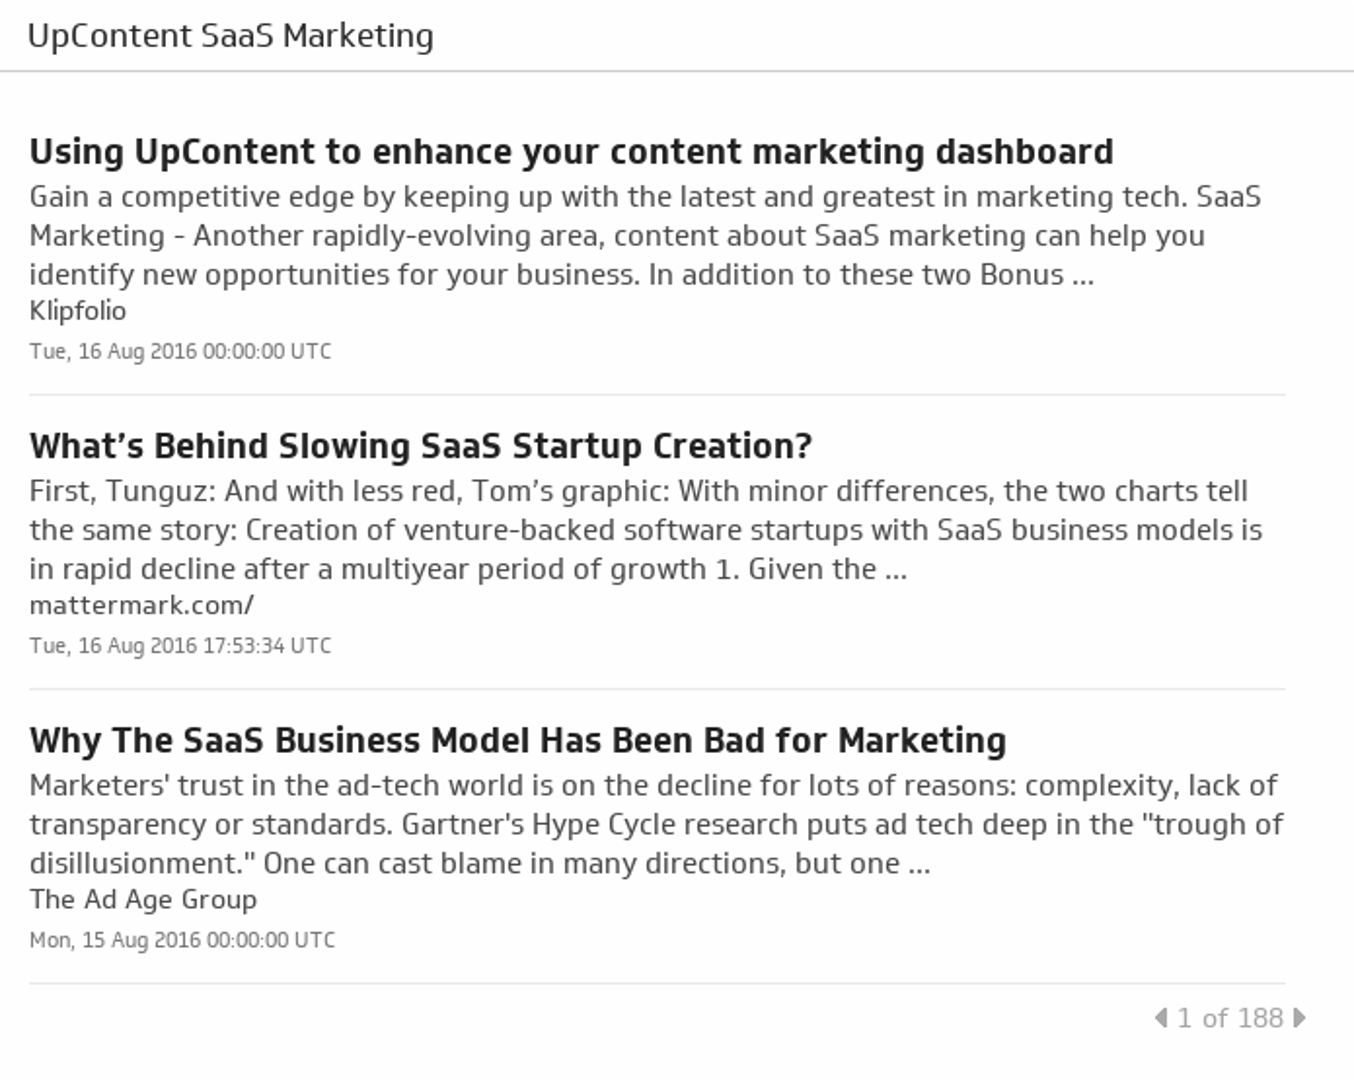
SaaS Marketing
Your go-to curated list of SaaS Marketing articles based on relevance, recency, shareability and influence.
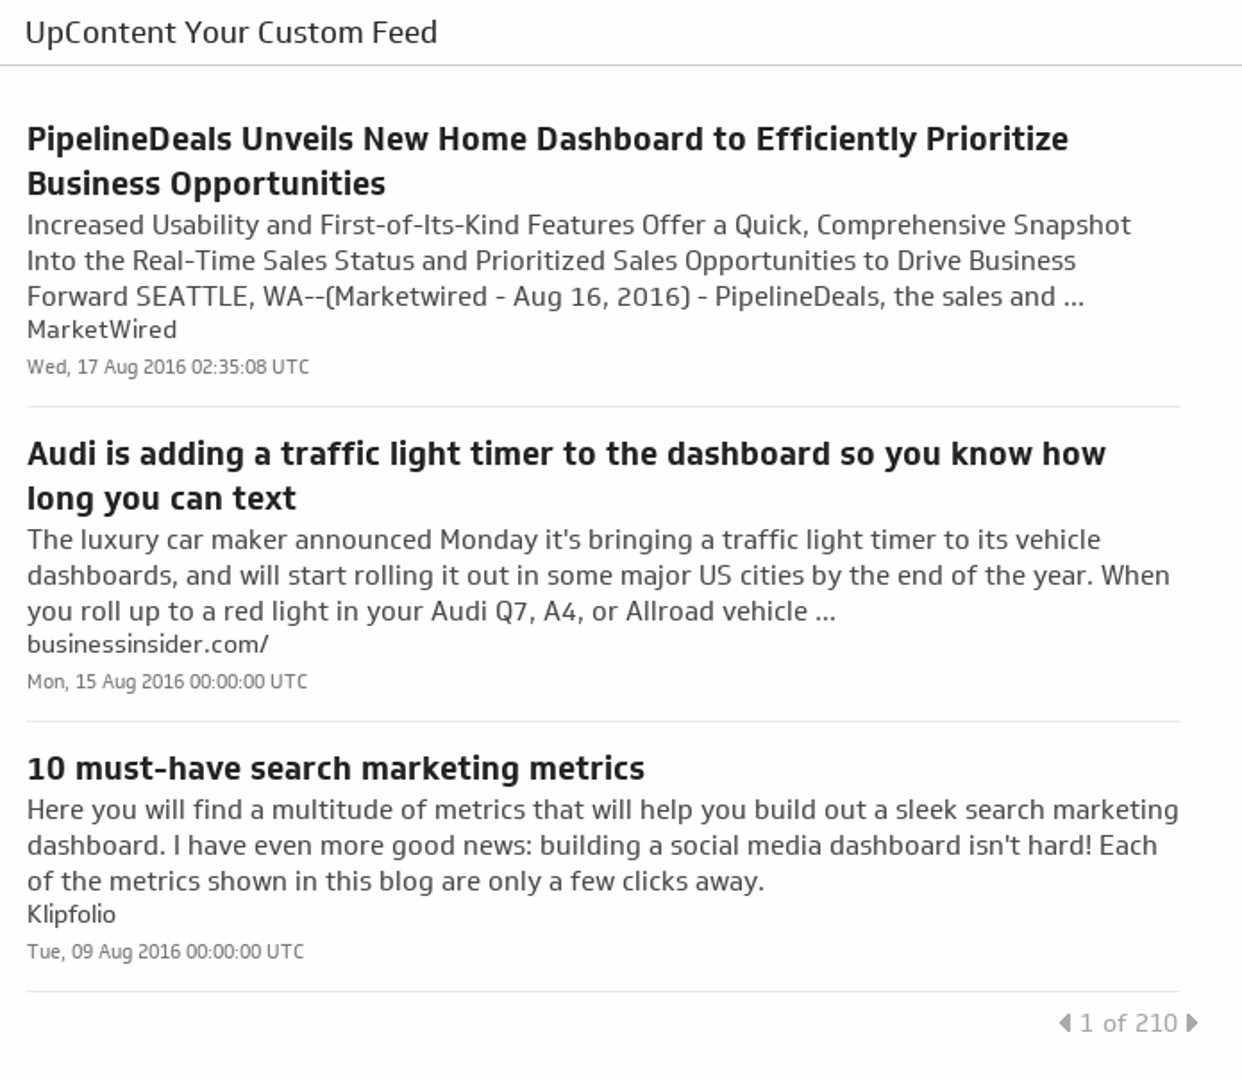
UpContent Your Custom Feed
Get a custom RSS Feed on the topic of your choice from your free UpContent account.
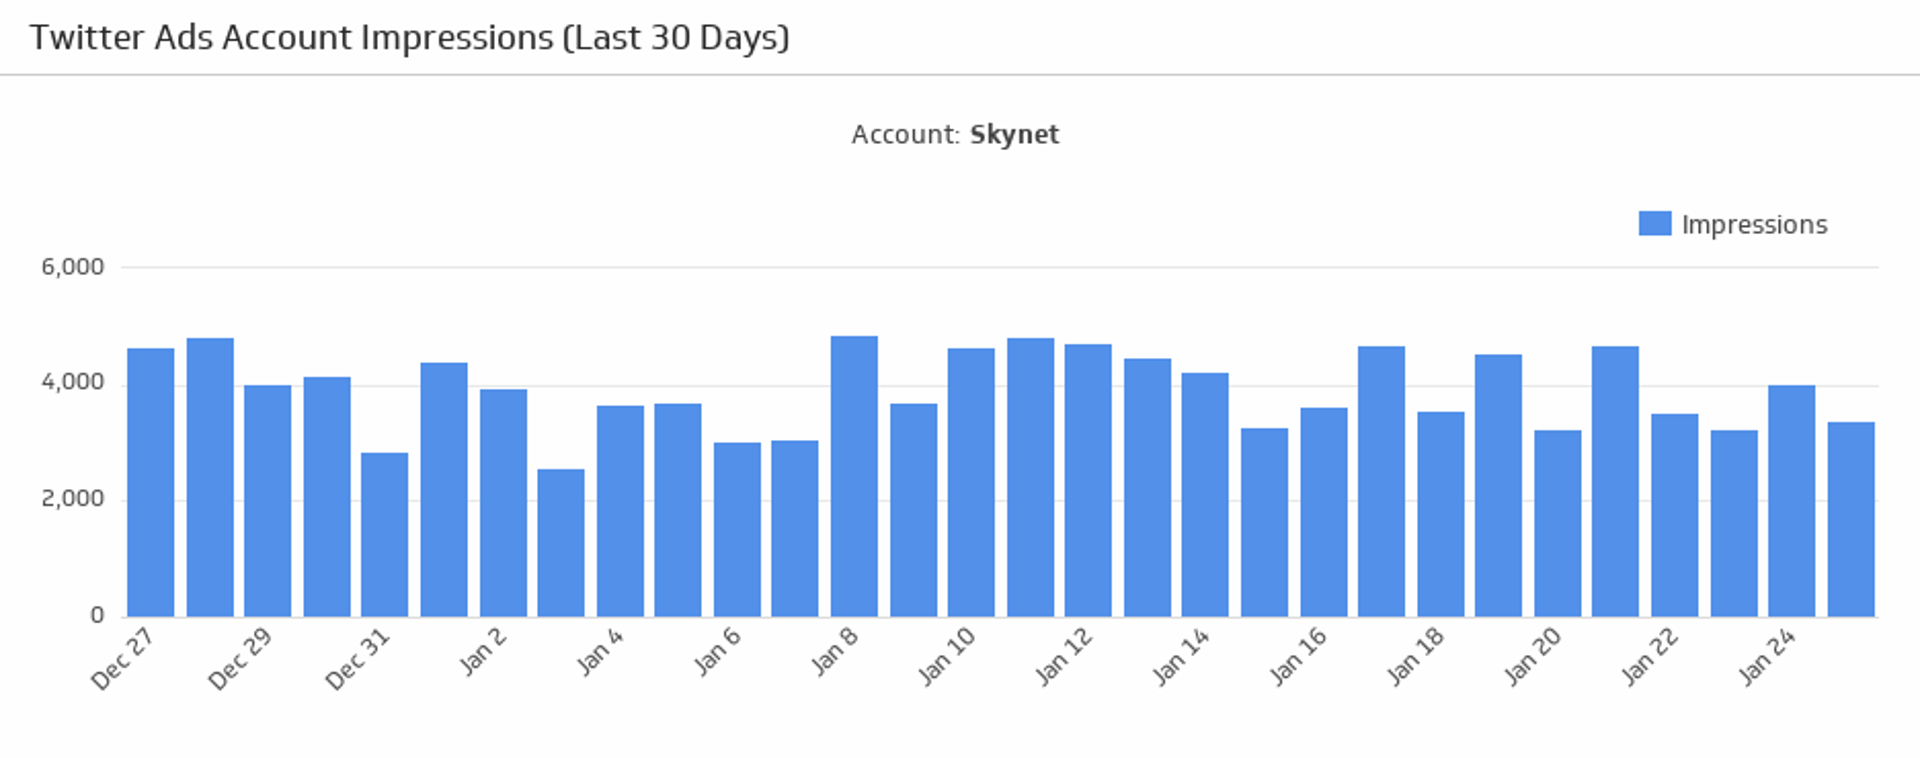
Account Impressions
Make sure your Twitter Ads account is making an impression! Monitor the number of impressions generated from your Twitter Ads account over the last 30 days.
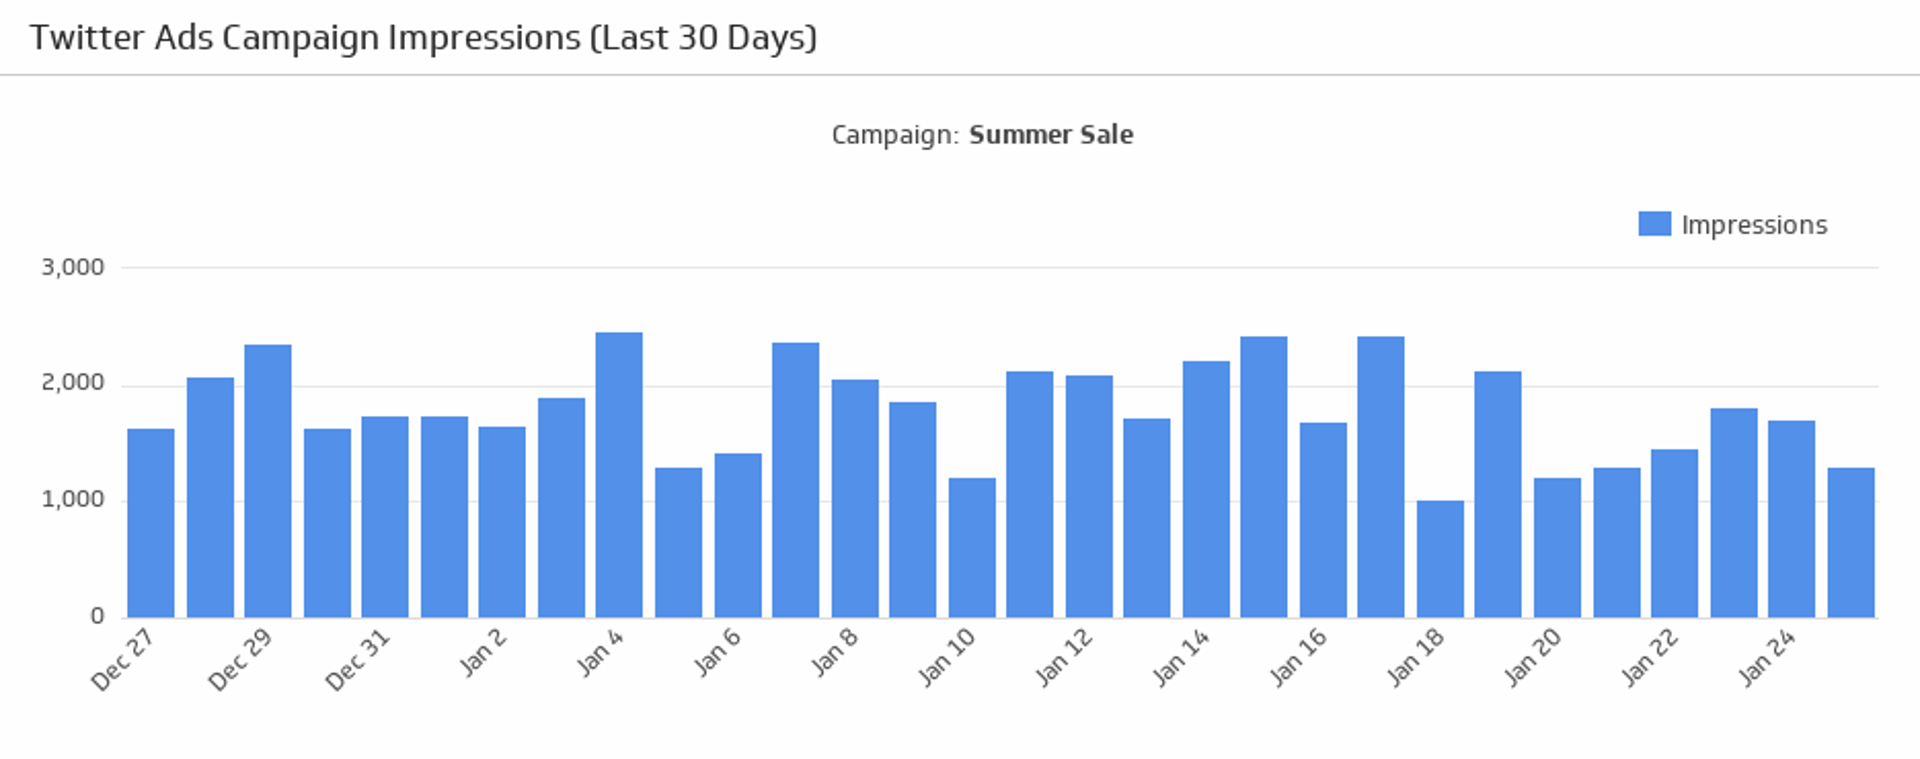
Campaign Impressions
Make sure your campaigns are attracting attention! See the number of impressions generated from your Twitter Ads campaign over the last 30 days.
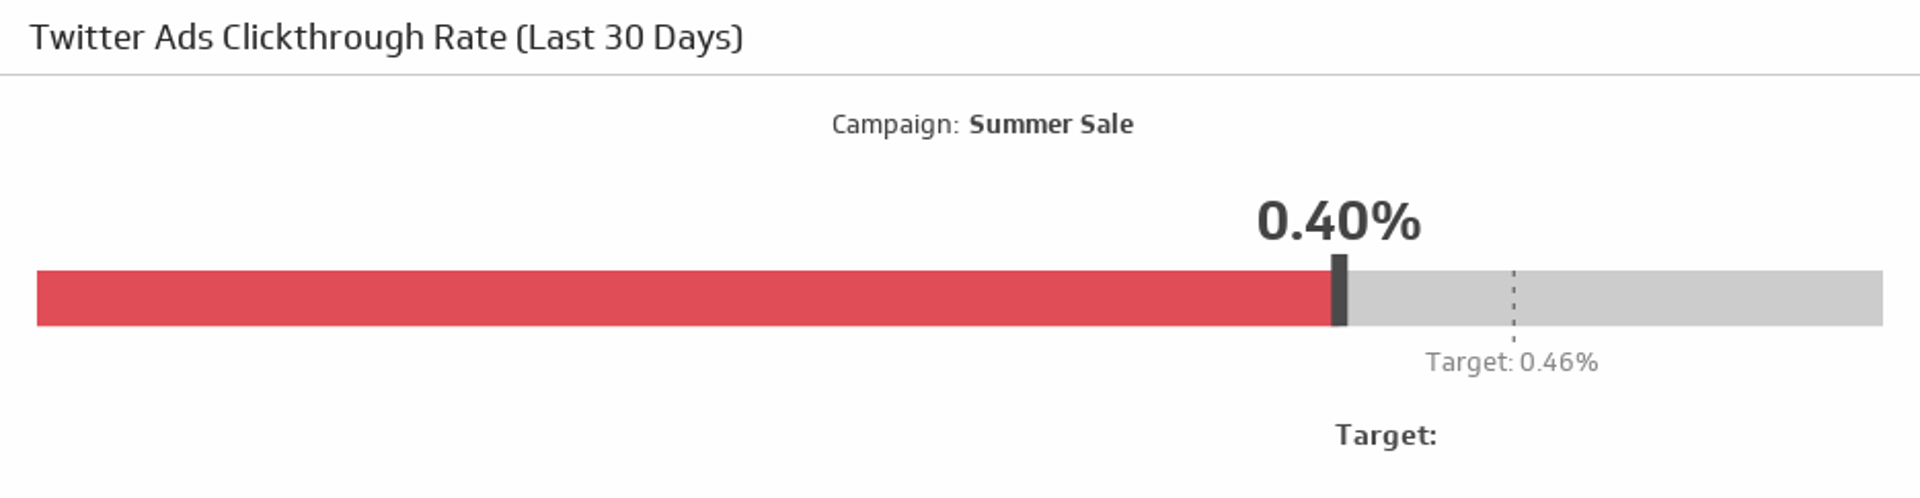
Clickthrough Rate
Compare your clickthrough rate over the last 30 days to your target.
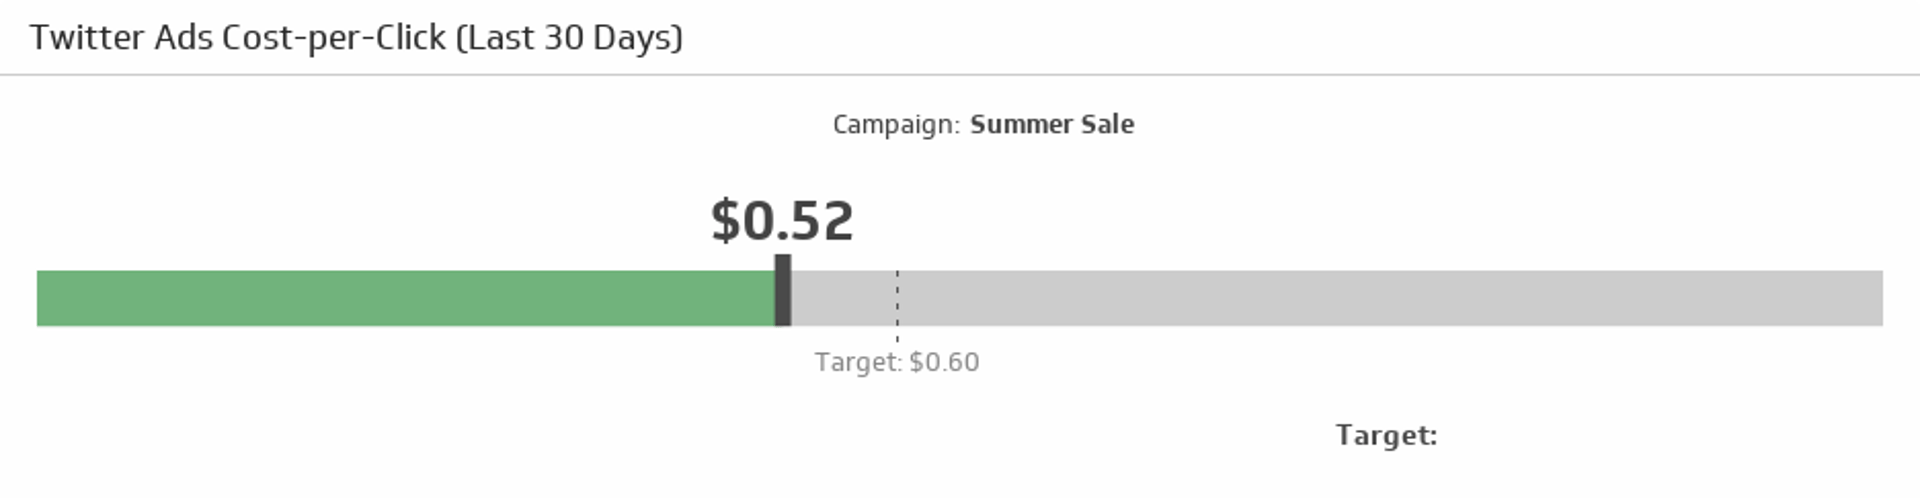
X Ads Cost-per-Click
Compare your cost-per-click rate over the last 30 days to your target.
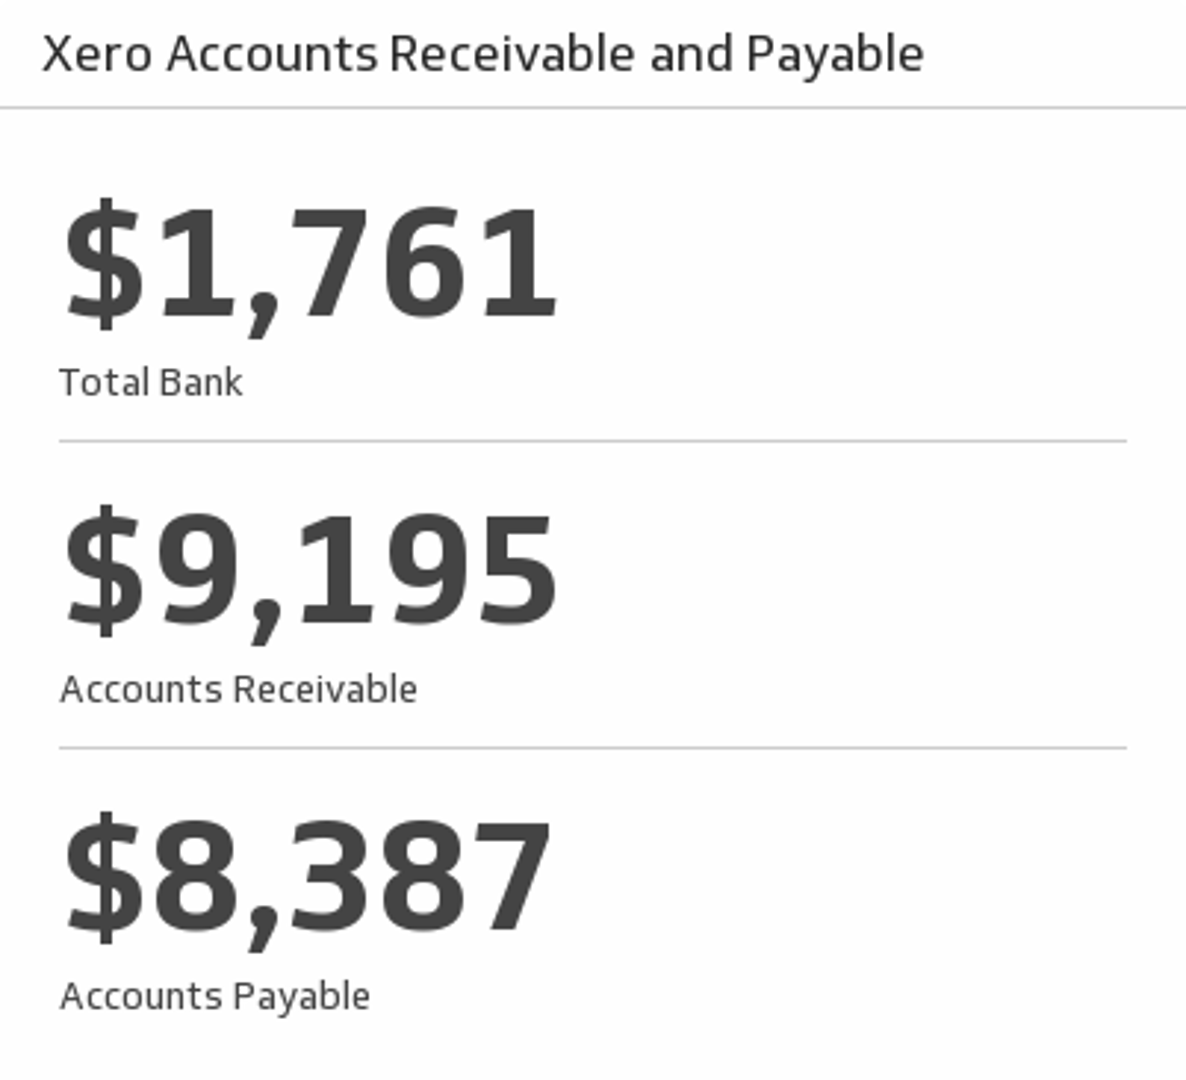
Accounts Receivable and Payable
Track your total bank balance, accounts receivable and payable for this month.
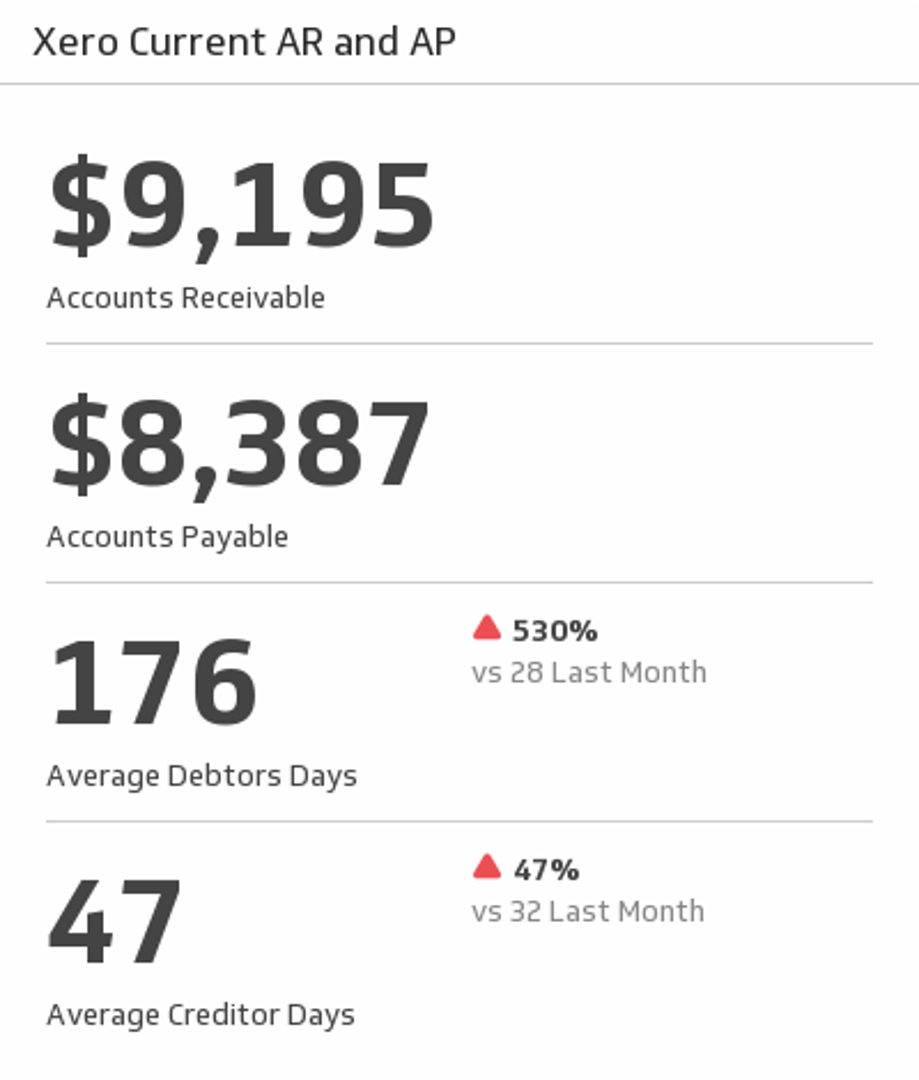
Current AR and AP
Track your Accounts Receivable and Payable for this month. Also, compare average debtors and creditors for this month and last month.
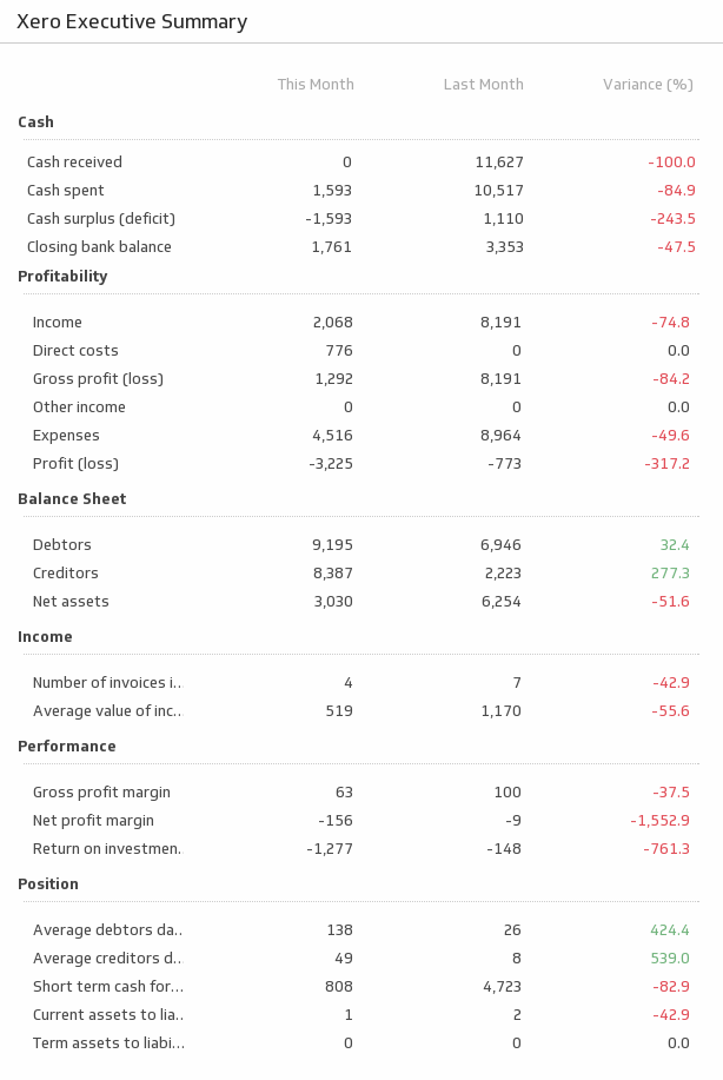
Executive Summary
This indispensable Klip provides an executive summary of your business metrics for this month and the last.
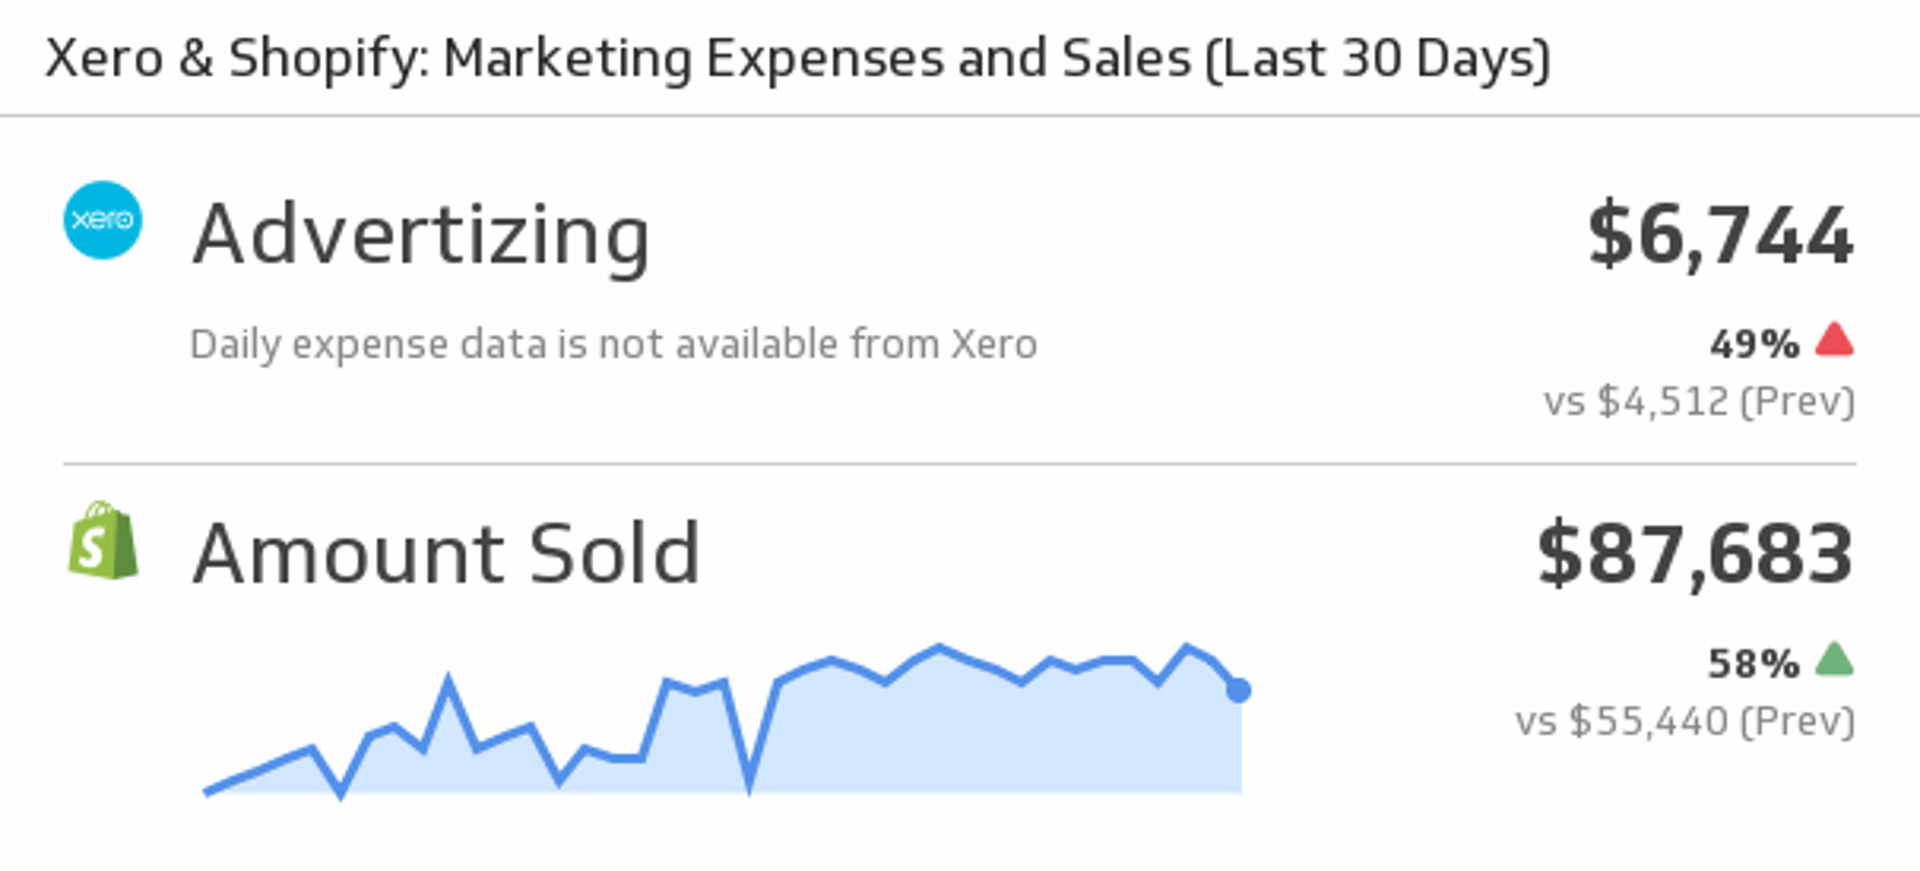
Marketing Expenses and Sales
Mash up your Xero and Shopify data by displaying Xero marketing expenses and Shopify Sales.
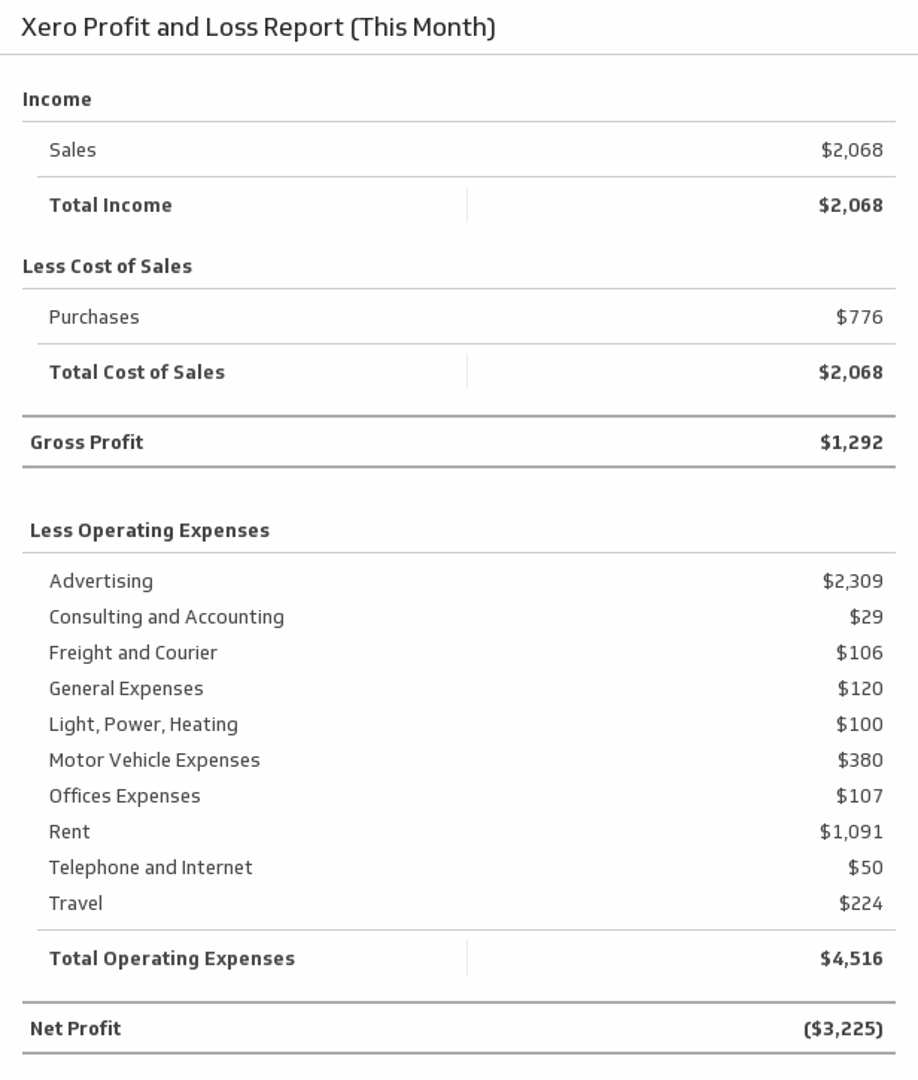
Profit and Loss Report
Display a full profit and loss report for this month.
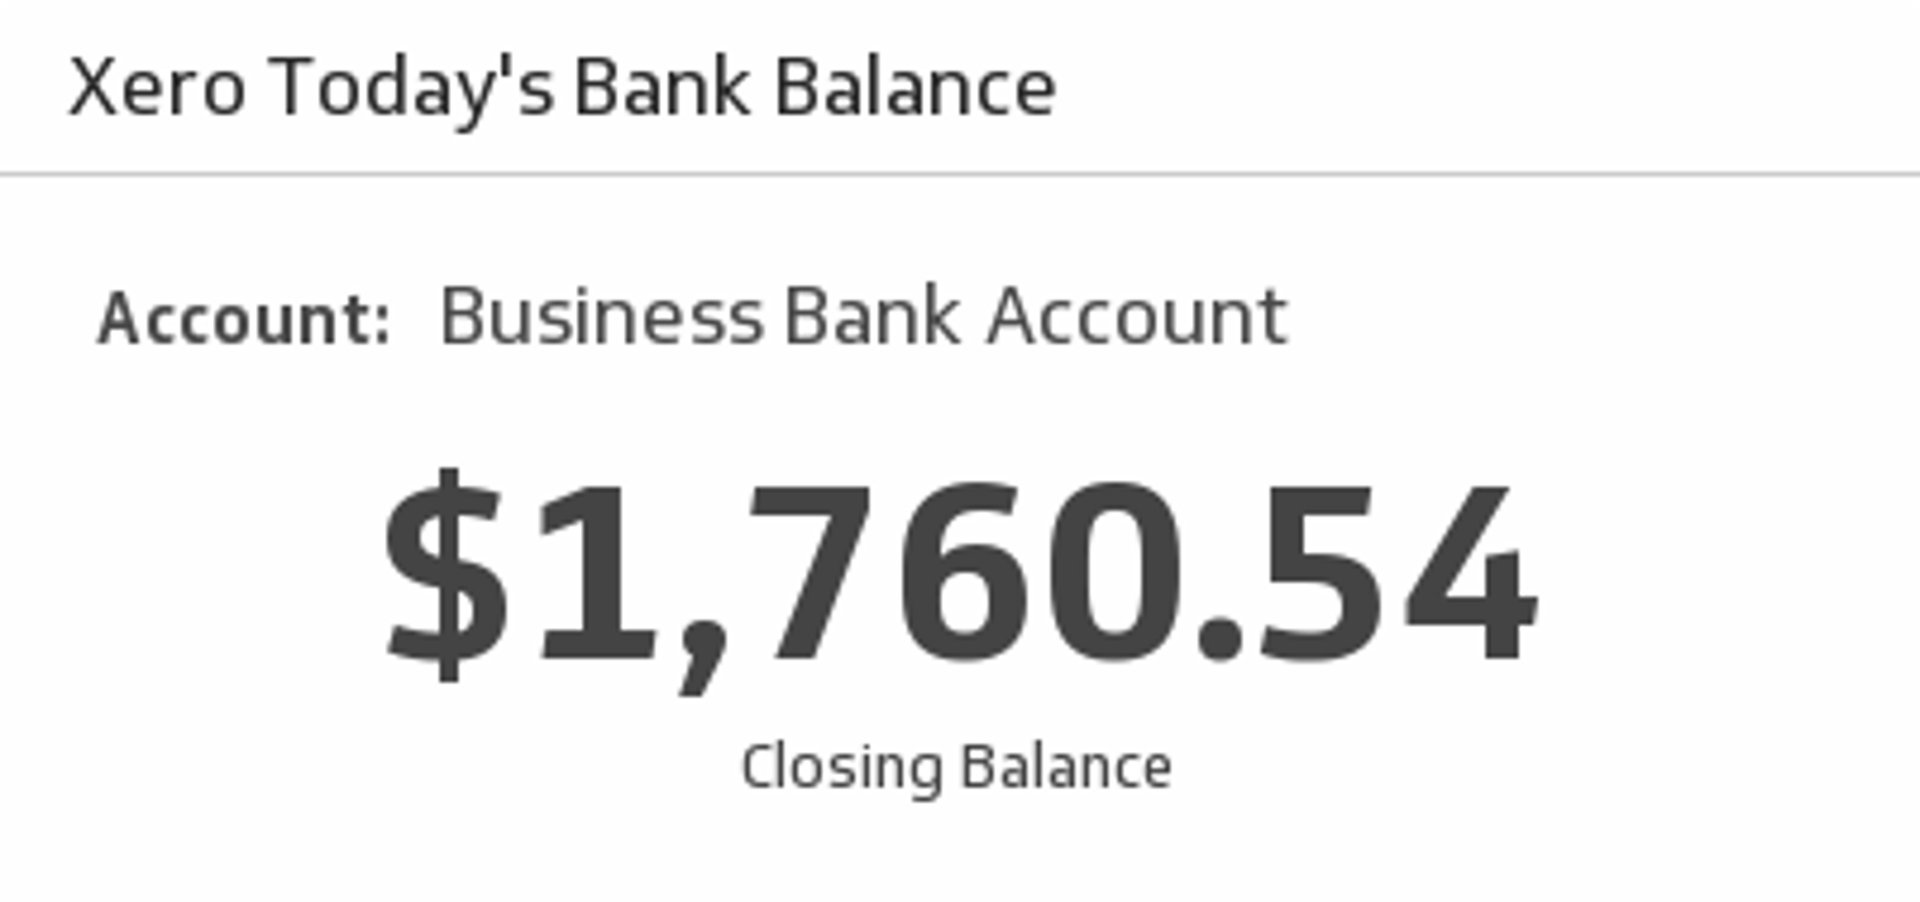
Today's Bank Balance
Select a bank account from the drop down menu and see your total closing balance.
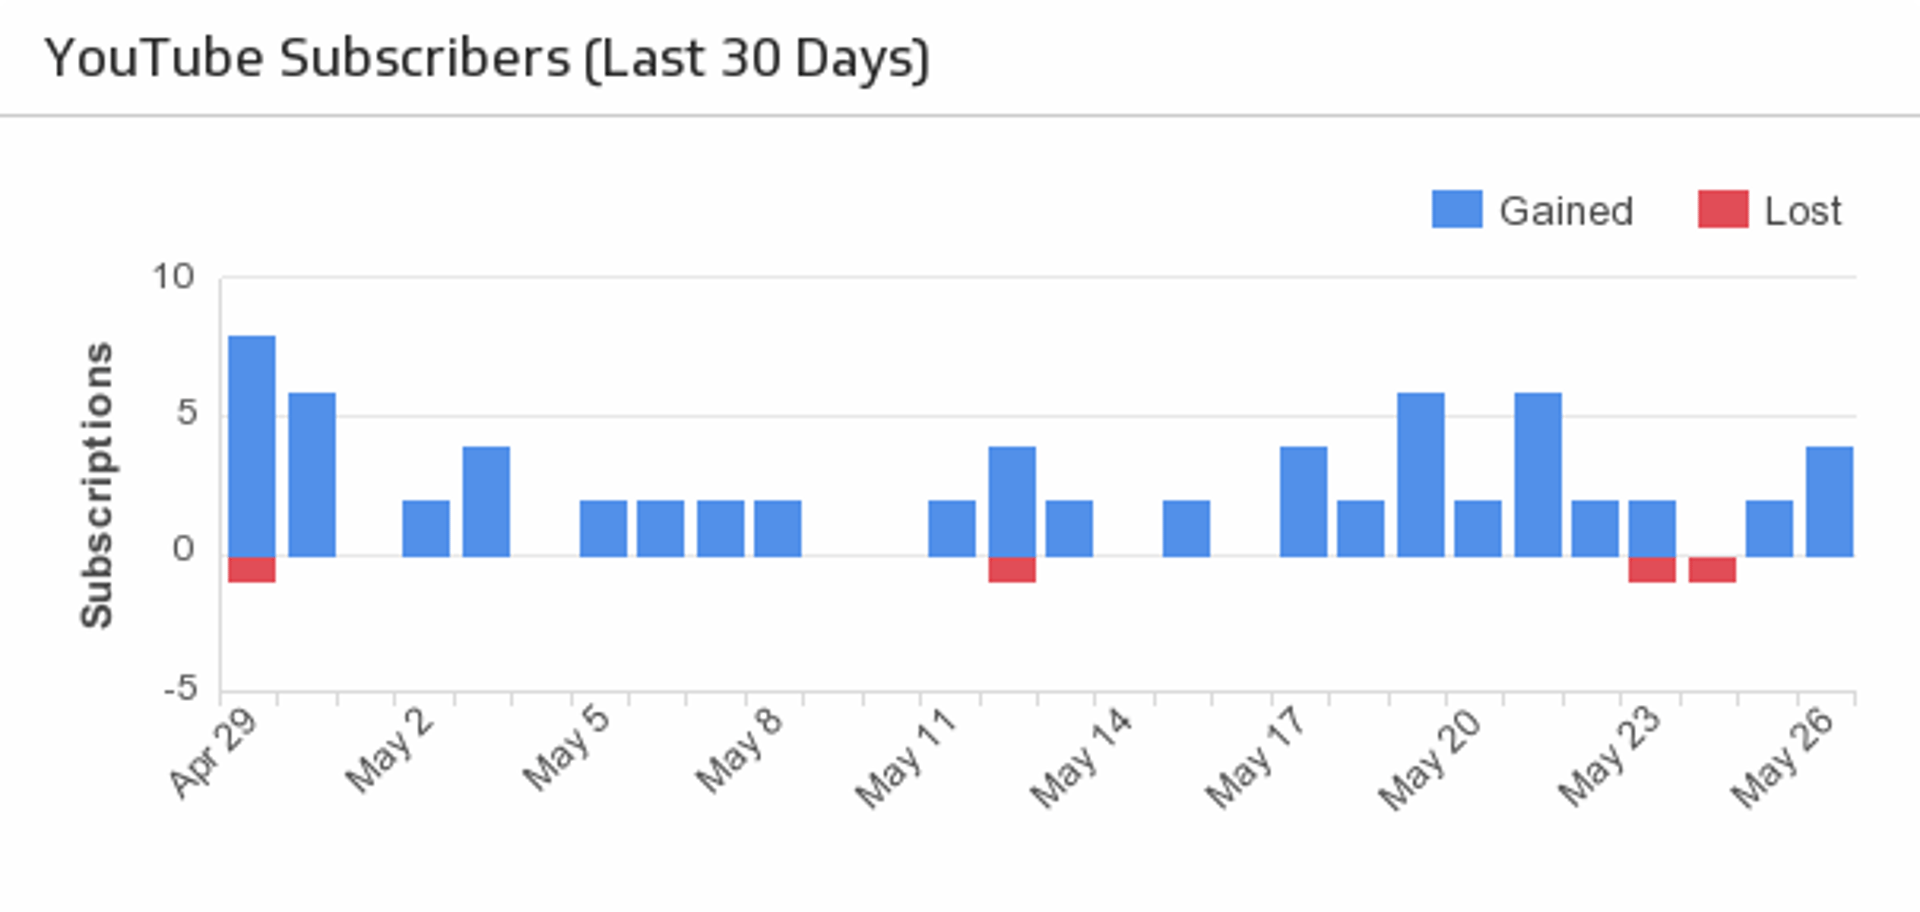
Channel Subscribers
Compare your lost and new subscribers over the last 30 days.
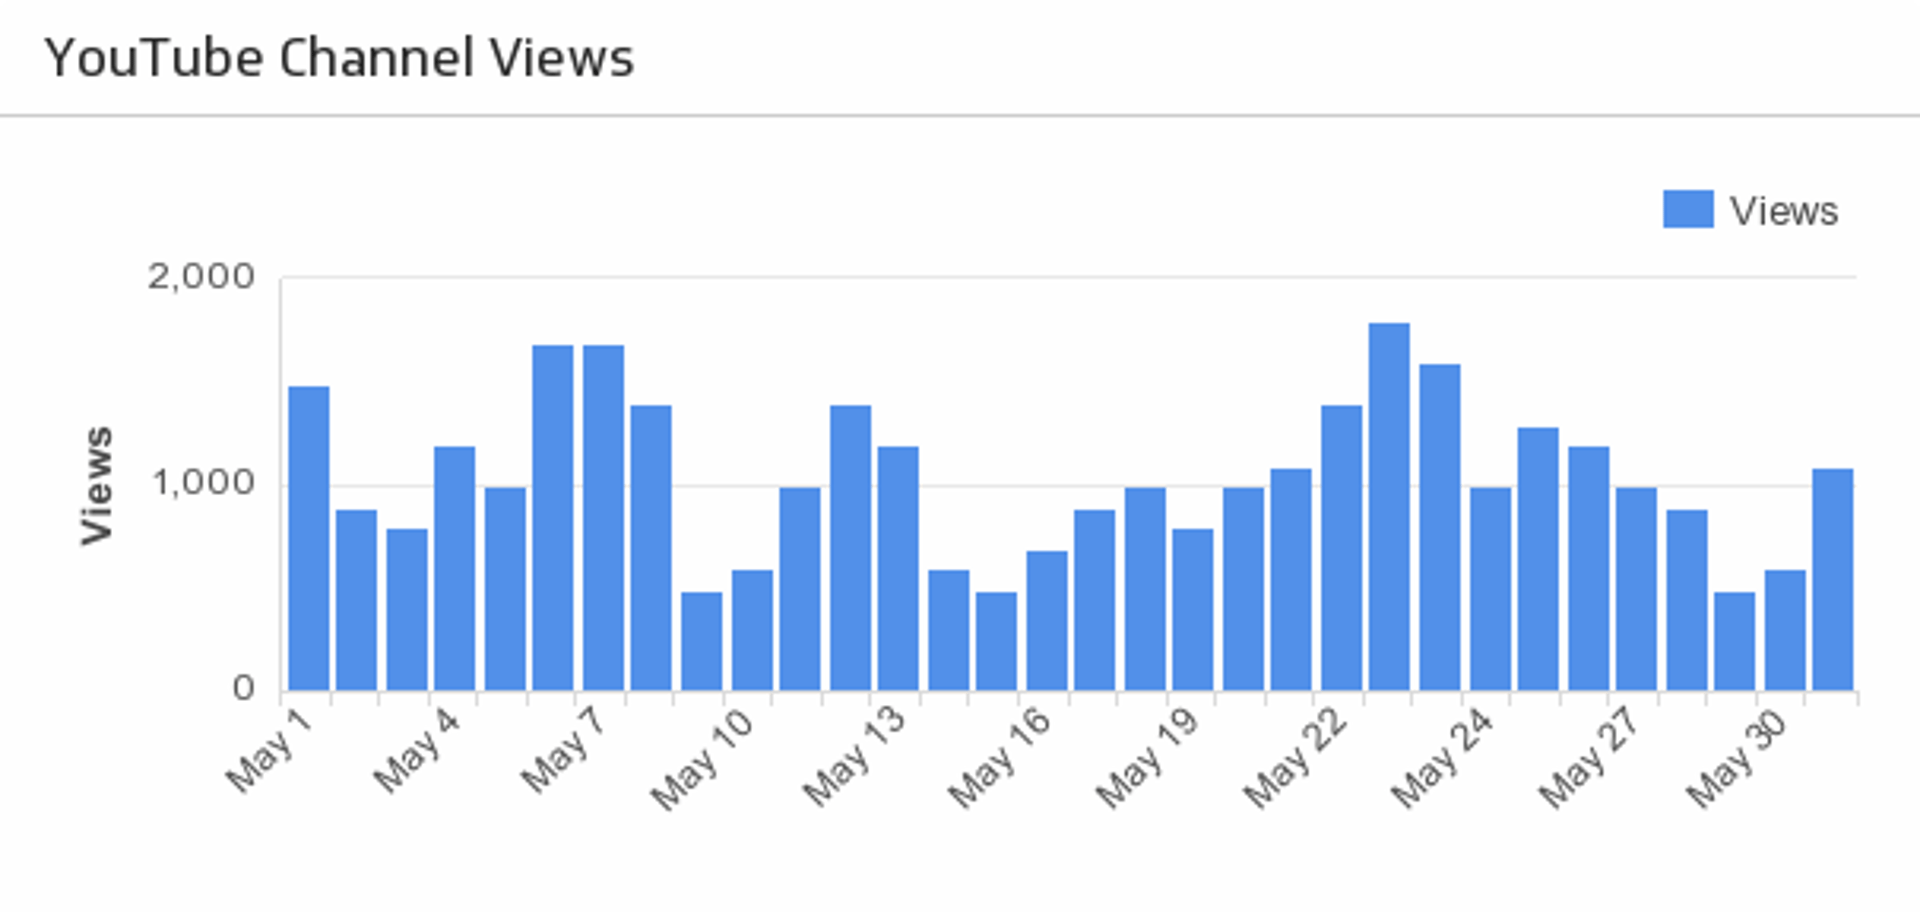
Channel Views
For high-level insight, track your total channel views over the last 30 days.
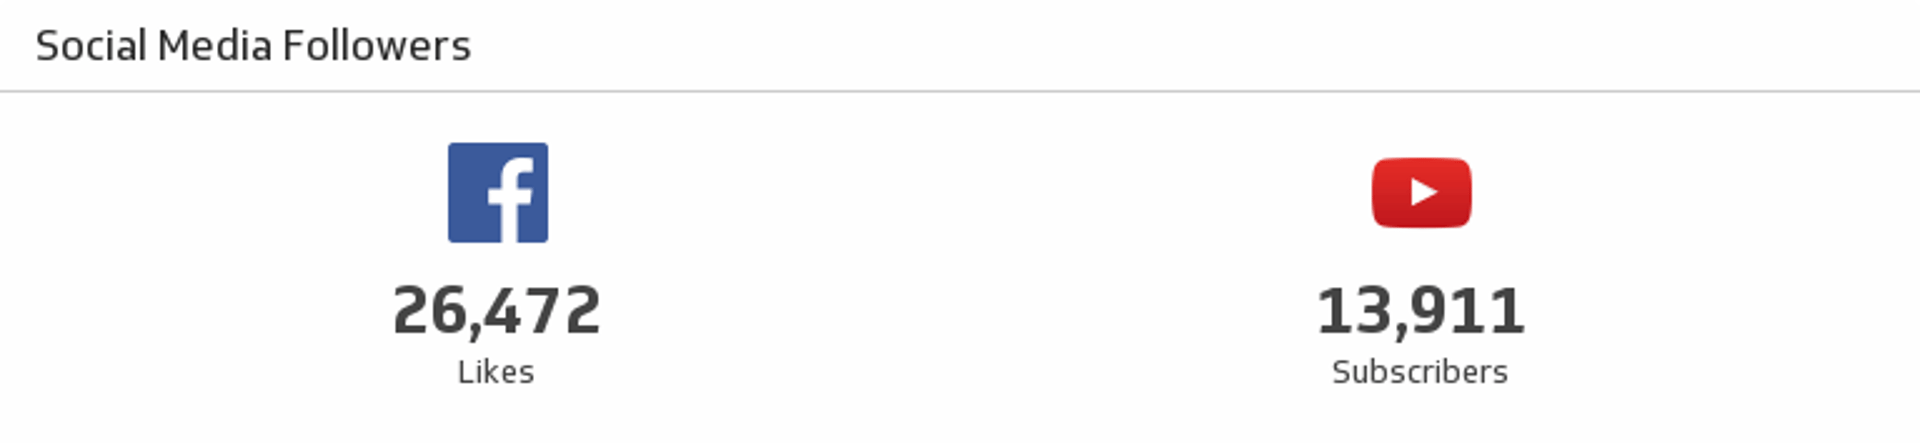
Facebook and YouTube Social Media Followers
See where you stand on Facebook and YouTube in a single Klip.
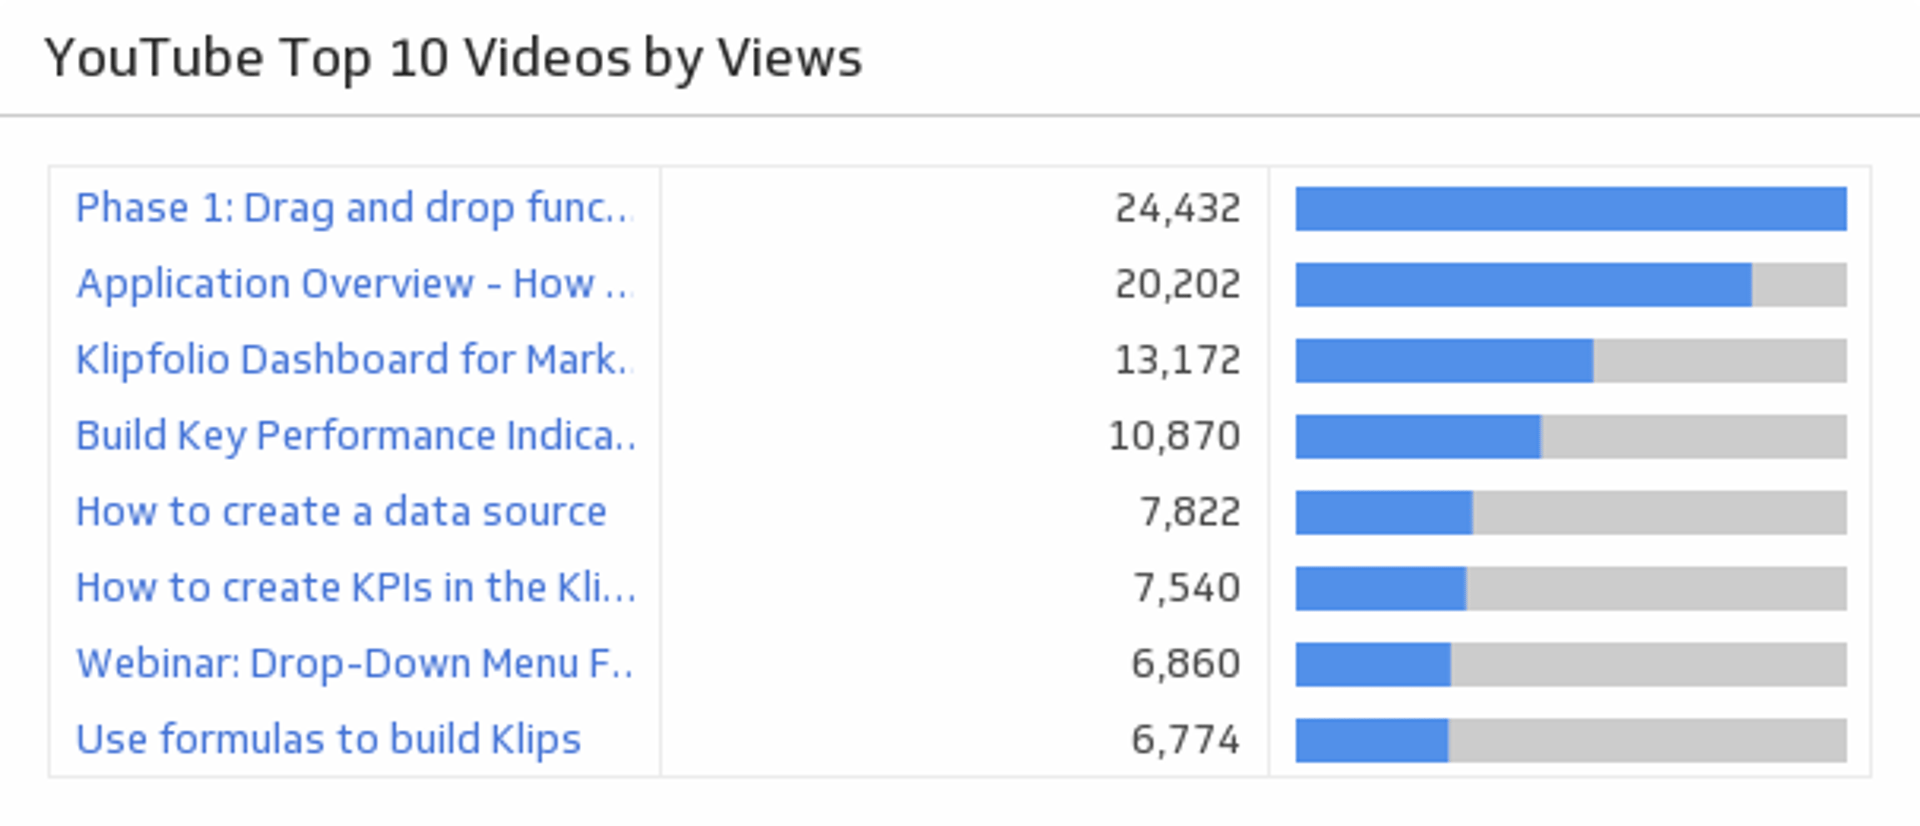
Top 10 Videos by Views
Rank your top 10 videos and see how successfully you are attracting your audience.
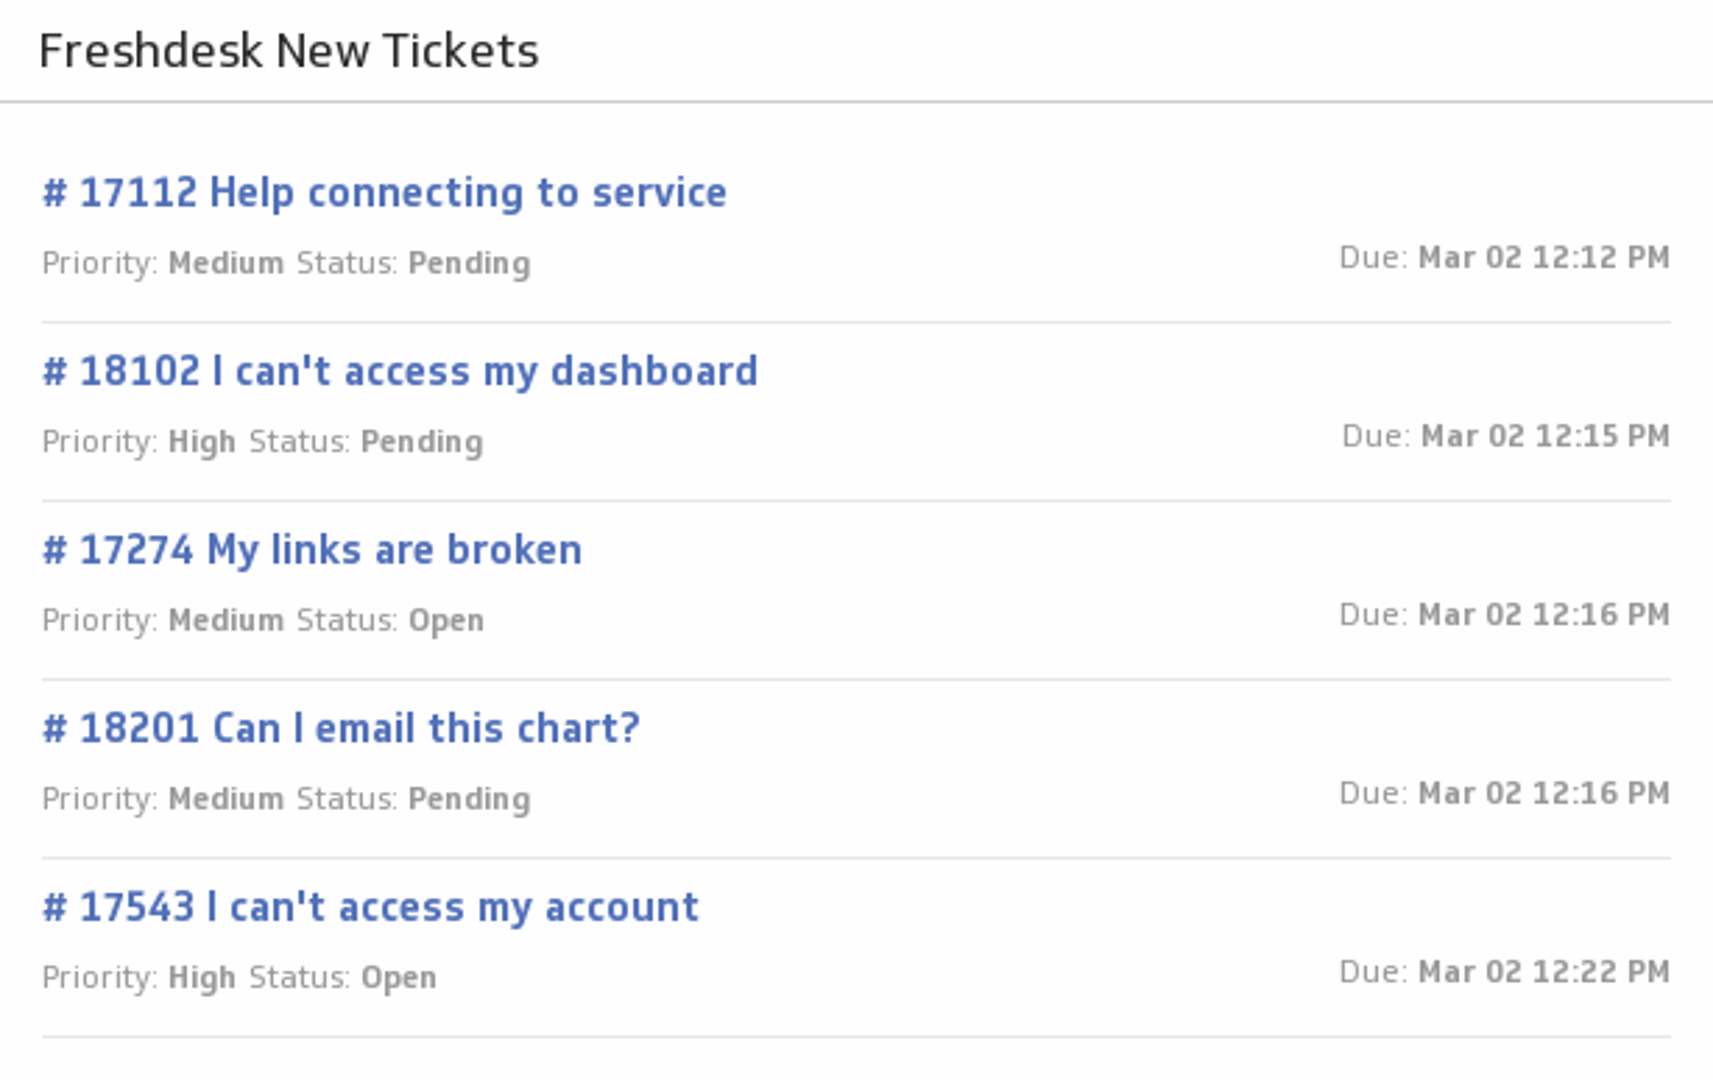
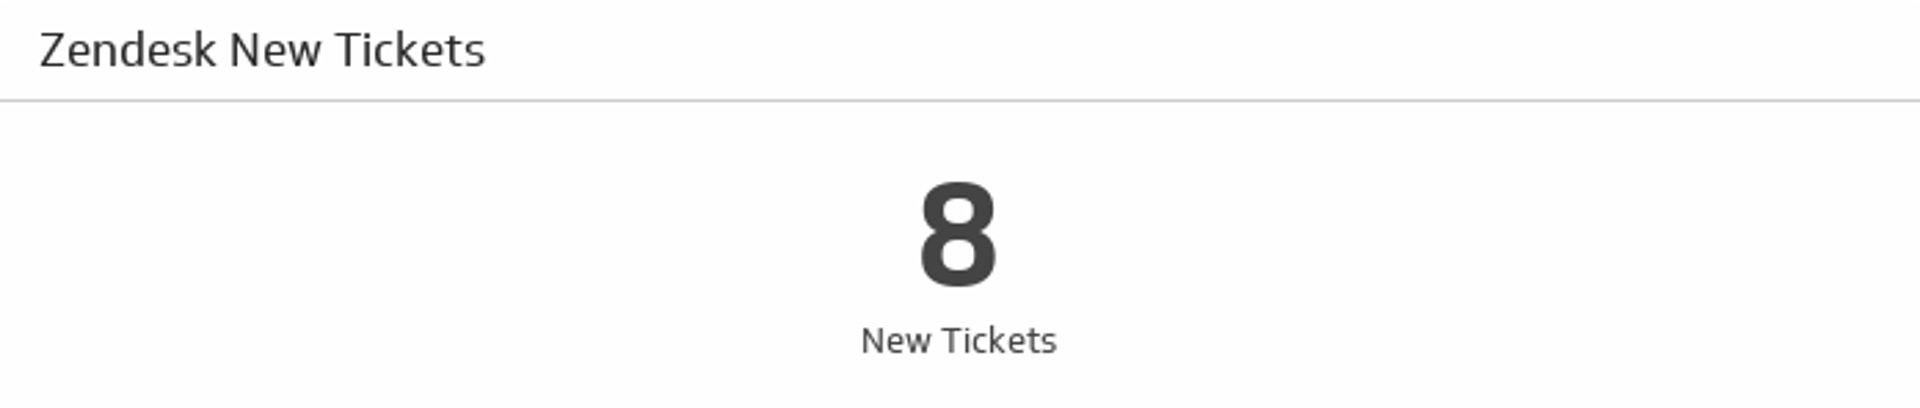
Freshdesk New Tickets
Be the best customer support team you can be! Add a list of your latest Freshdesk tickets to your dashboard, and track their status and priority levels.
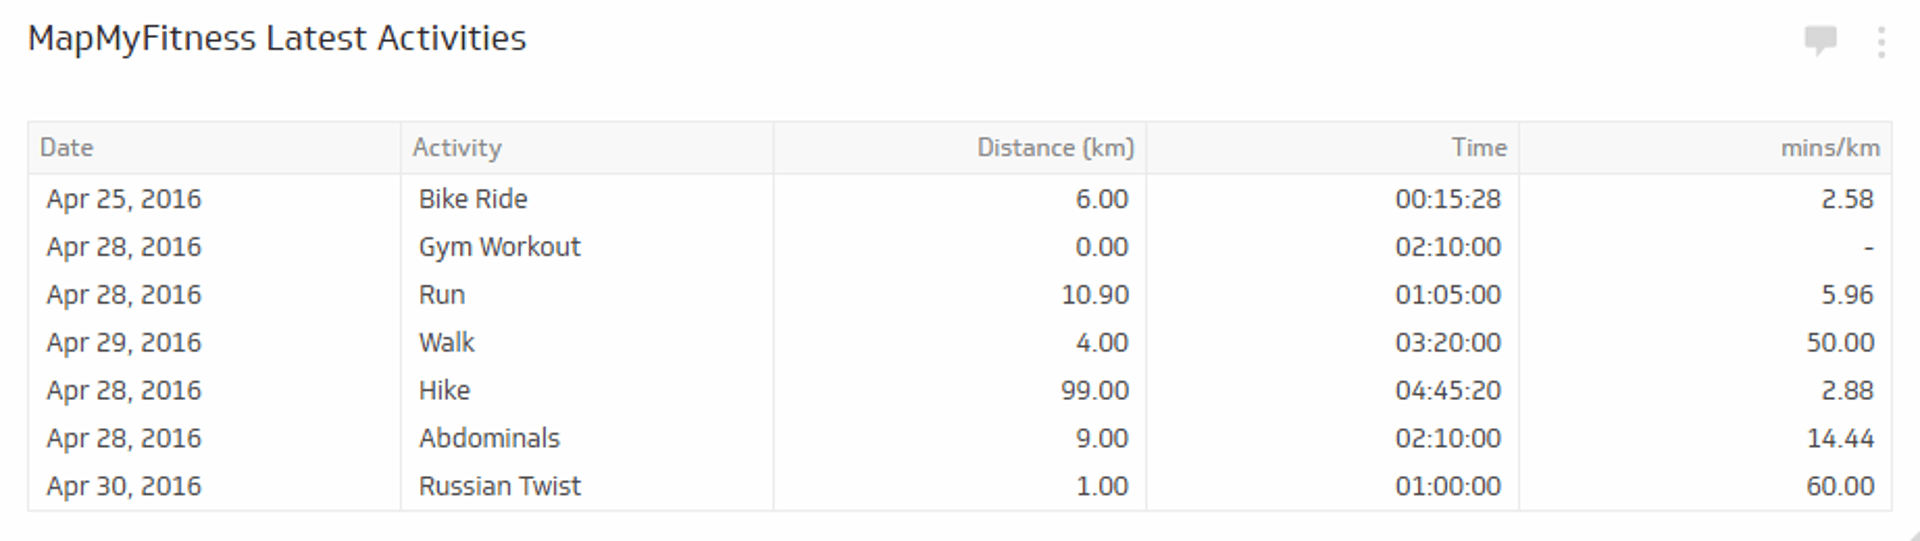
MapMyFitness Latest Activities
Keep track of all your workouts in one integrated Klip with this MapMyFitness-Klipfolio Zap.
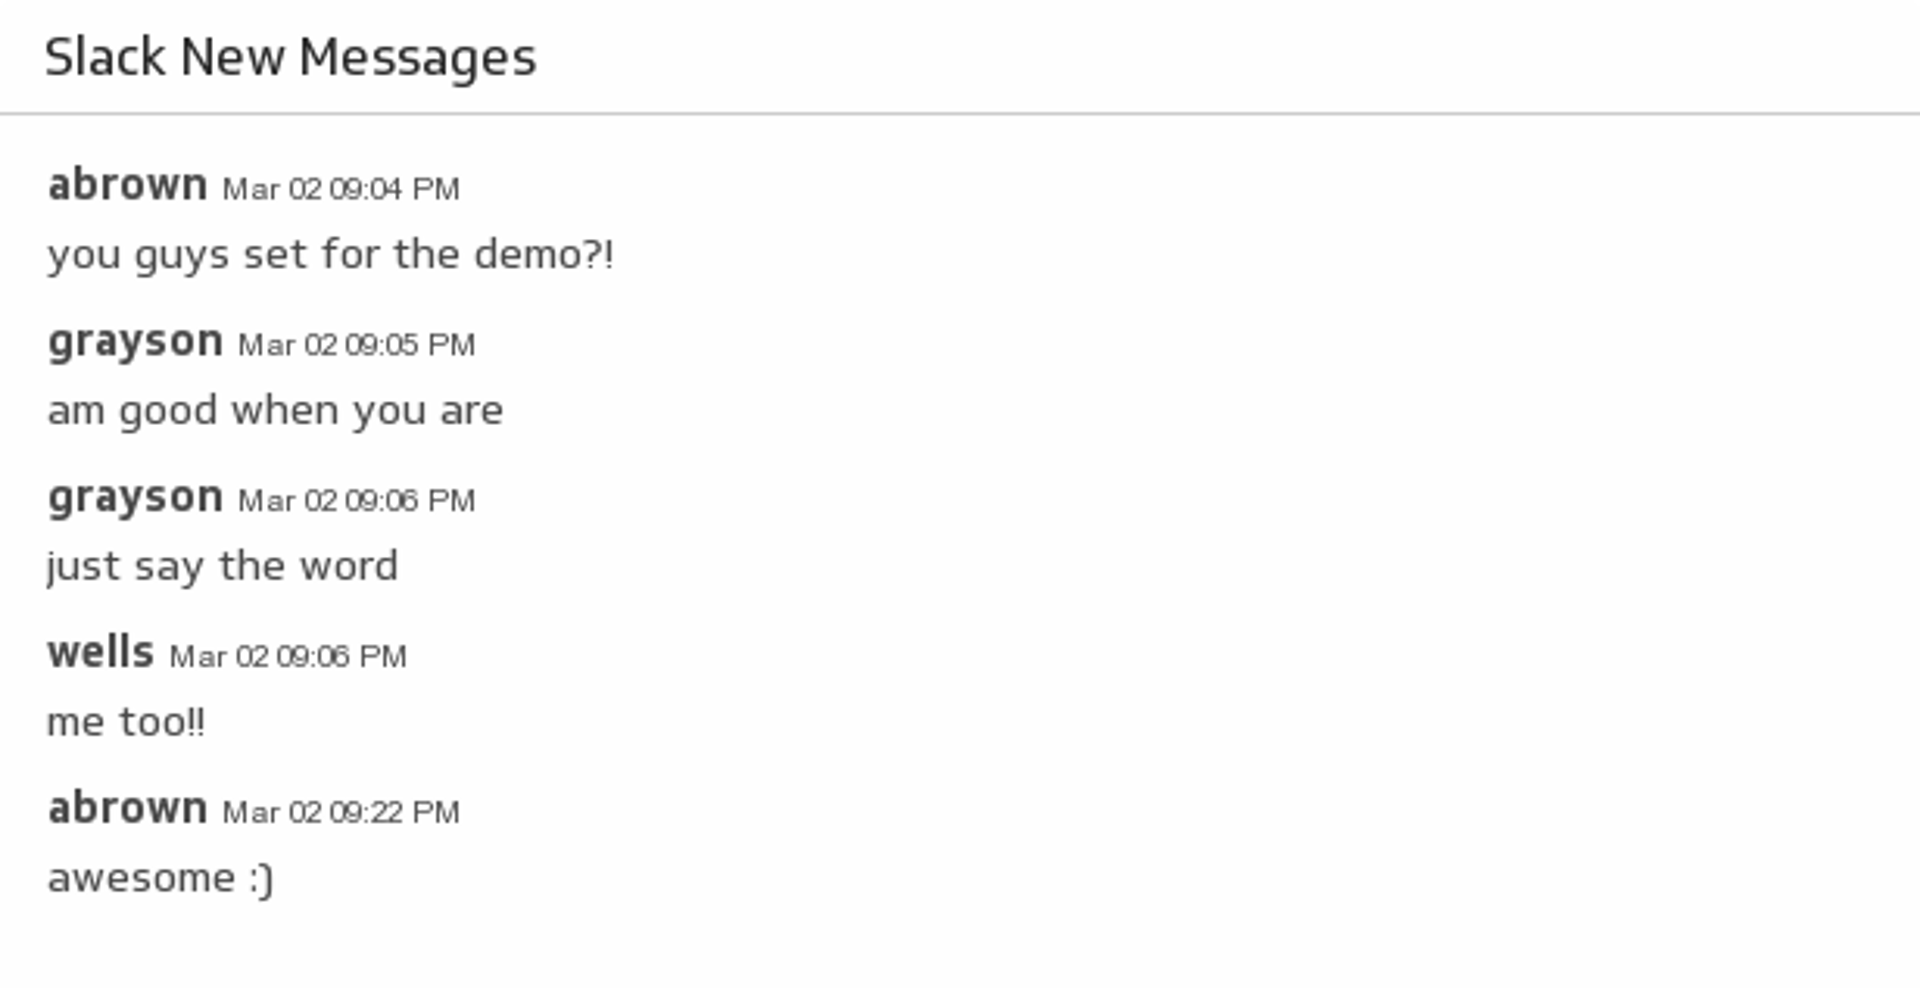
New Messages
Make it easy to see the conversations on your favourite Slack channel by adding it to your dashboard.
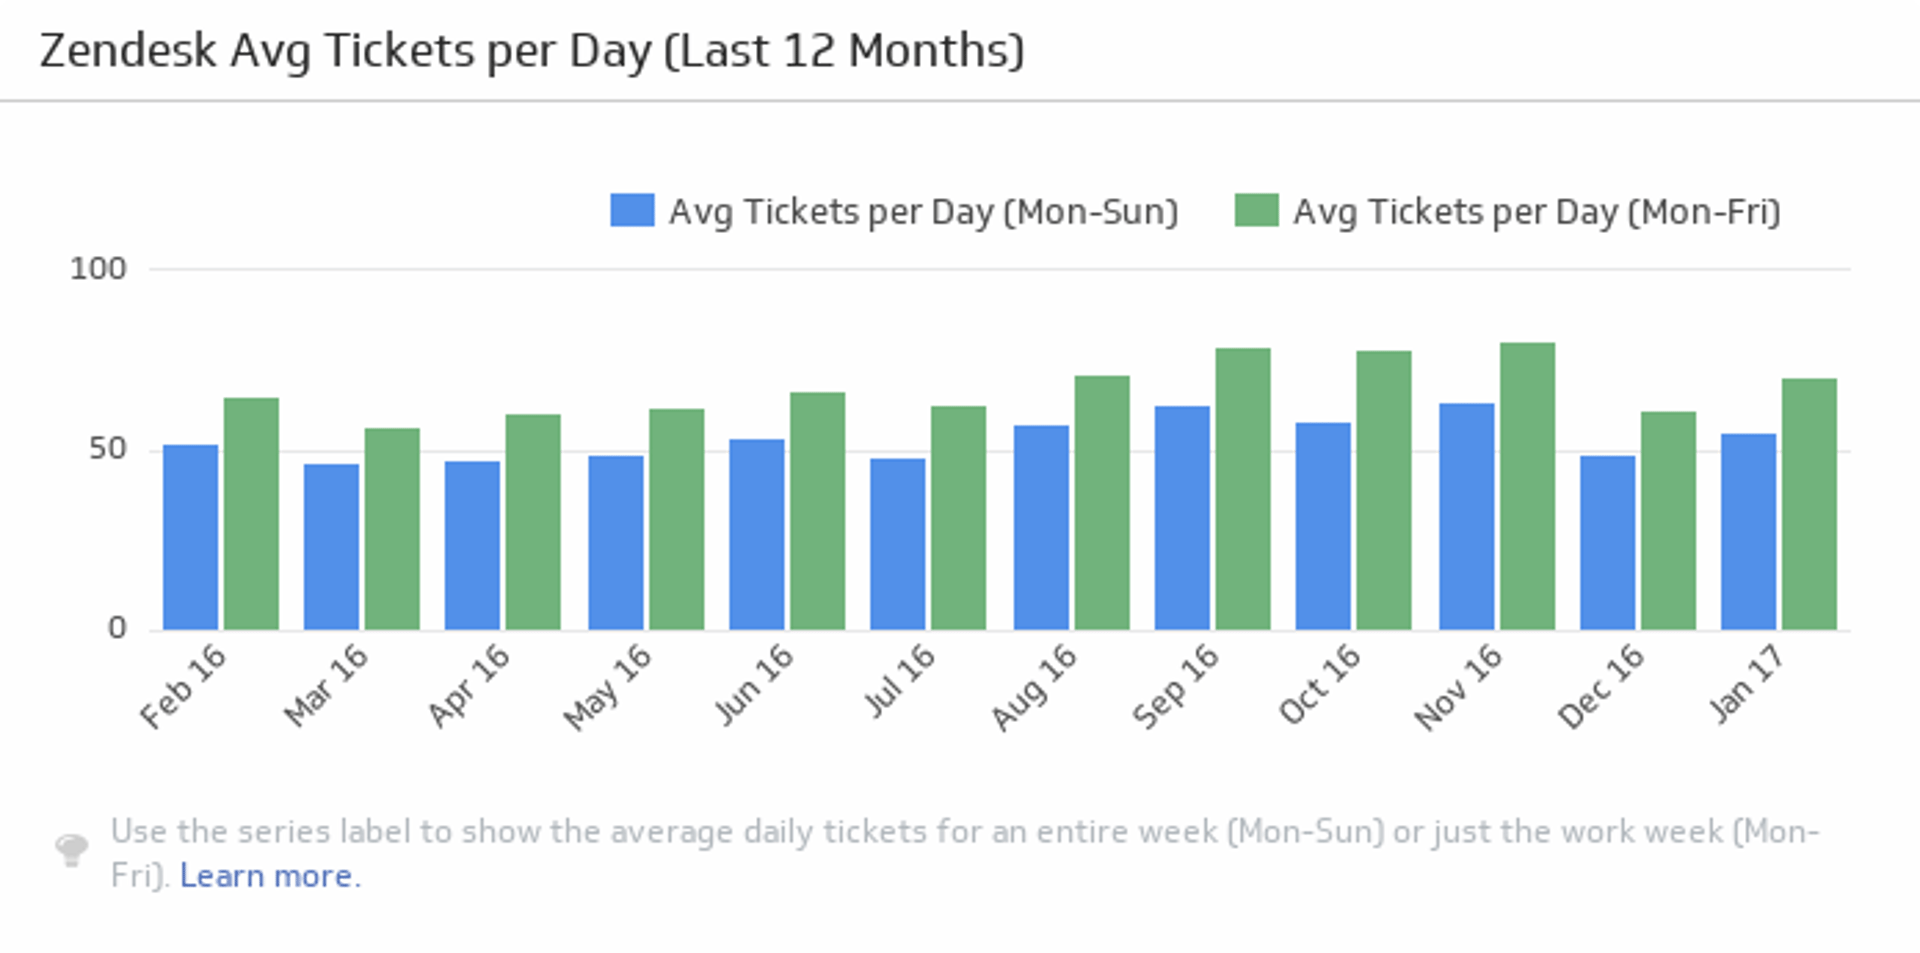
Average Tickets per Day
Monitor the average number of tickets per day over the past twelve months, and compare the monthly averages for five days and seven days.
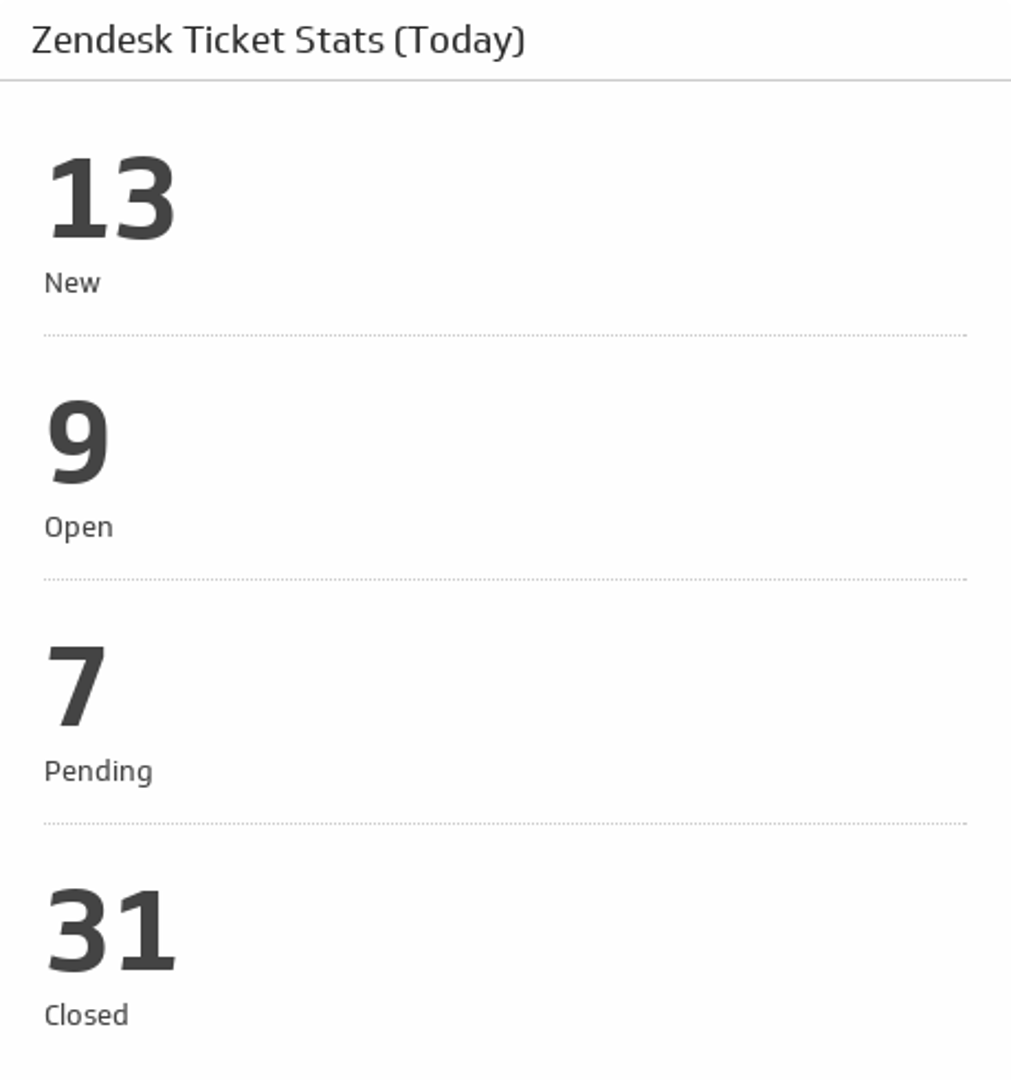
Ticket Stats (Today)
Get an overview of today's new, open, pending and closed tickets.
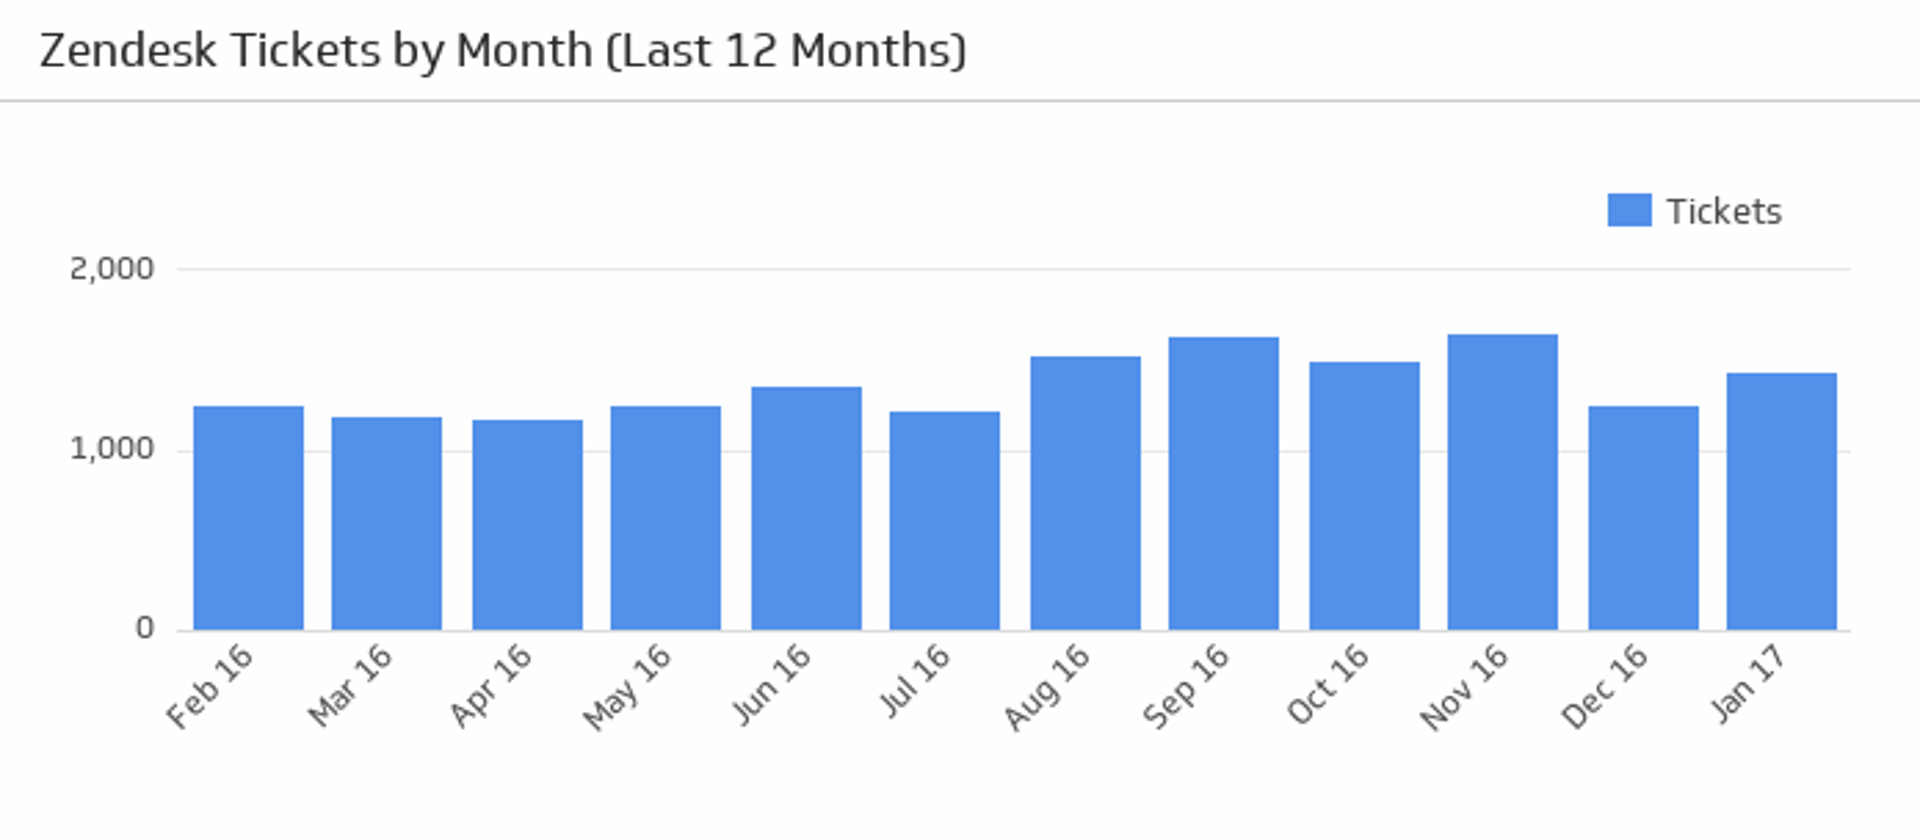
Tickets by Month
Hover over this bar chart to see the total number of tickets over the last twelve months.
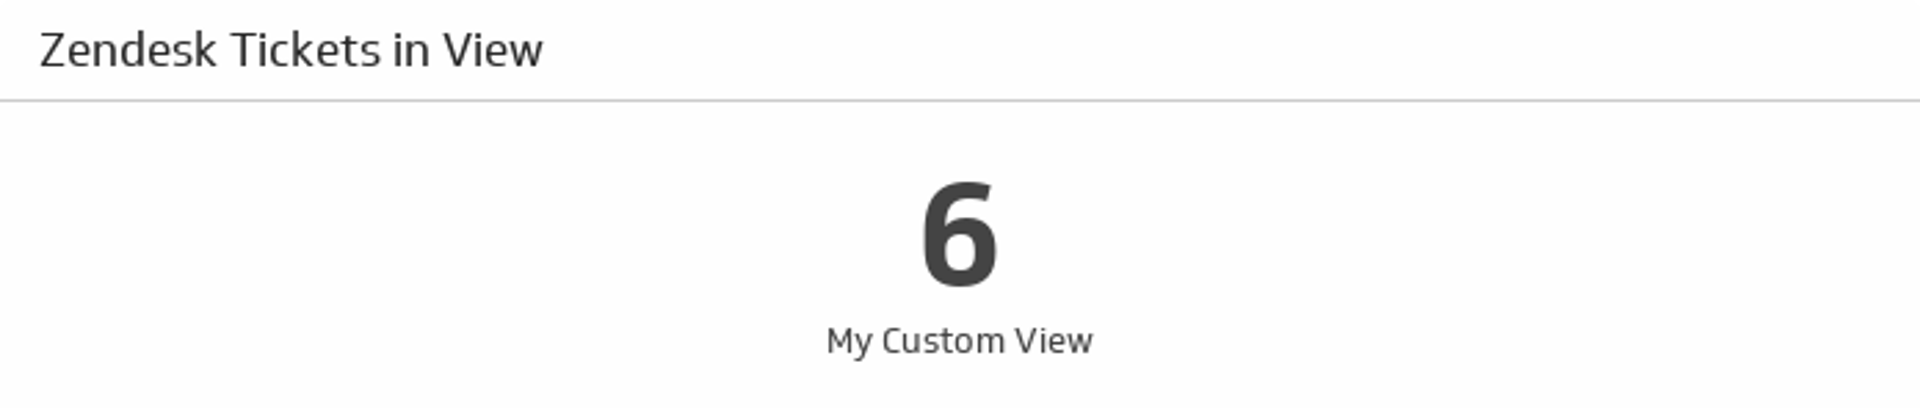
Tickets in View
Discover how many tickets there are in your chosen Zendesk View.


.svg)


.svg)